1
Evolutionary Algorithms with Segment-Based Search for Multiobjective Optimization Problems Miqing Li, Shengxiang Yang, Member, IEEE, Ke Li, Student Member, IEEE, and Xiaohui Liu
Abstract—This paper proposes a variation operator, called segment-based search (SBS), to improve the performance of evolutionary algorithms on continuous multiobjective optimization problems. SBS divides the search space into many small segments according to the evolutionary information feedback from the set of current optimal solutions. Two operations, micro-jumping and macro-jumping, are implemented upon these segments in order to guide an efficient information exchange among “good” individuals. Moreover, the running of SBS is adaptive according to the current evolutionary status. SBS is activated only when the population evolves slowly, depending on general genetic operators (e.g., mutation and crossover). A comprehensive set of 36 test problems is employed for experimental verification. The influence of two algorithm settings (i.e., the dimensionality and boundary relaxation strategy) and two probability parameters in SBS (i.e., the SBS rate and micro-jumping proportion) are investigated in detail. Moreover, an empirical comparative study with three representative variation operators is carried out. Experimental results show that the incorporation of SBS into the optimization process can improve the performance of evolutionary algorithms for multiobjective optimization problems. Index Terms—Multiobjective optimization, hybrid evolutionary algorithms, variation operators, segment-based search.
I. I NTRODUCTION ANY real-world problems involve simultaneous optimization of several competing criteria or objectives: Often, there is no single optimal solution, but rather a set of alternative solutions. Evolutionary algorithms (EAs) have been recognized to be suitable to deal with these multiobjective optimization problems (MOPs) due to their population-based property of achieving an approximation of the Pareto set in a single run. Since Schaffer’s pioneering work [44], numerous efficient evolutionary multiobjective optimization (EMO) algorithms have been proposed, and some of them are widely applied to various problem domains [7]. It is well-known that pure EAs may not be well suited for some complex problems [16]. The hybridization of EAs with other search techniques (e.g., variation operators, optimization algorithms, and machine learning methods) can greatly improve the search ability [32], [48], [60]. Aiming to obtain a balance between exploration and exploitation, hybrid EAs represent one of the growing research areas in the evolutionary computation community. Recent studies on hybrid EAs have
M
M. Li and X. Liu are with the Department of Information Systems and Computing, Brunel University, Uxbridge, Middlesex UB8 3PH, U. K. (email: {miqing.li, xiaohui.liu}@brunel.ac.uk). S. Yang is with the Centre for Computational Intelligence (CCI), School of Computer Science and Informatics, De Montfort University, Leicester LE1 9BH, U. K. (e-mail:
[email protected]). K. Li is with the Department of Computer Science, City University of Hong Kong, Kowloon, Hong Kong (e-mail:
[email protected]).
demonstrated their usefulness on various problem domains [17], [41], [59]. Incorporating new variation operators into EAs is one important research topic in the area of hybrid EAs. According to the property of converging into a local optimum, variation operators can be divided into two categories: local search (LS) operators and non-LS operators. LS, which tries to guide solutions to converge into a local optimum, is a metaheuristic method. In general, an LS method starts from a certain point in the search space and moves it iteratively in a descent direction until a local optimum of the function is reached [27]. Hybridization of EAs with LS is known as memetic algorithms (MAs) [5], [28], [49]. Combining probabilistic search and deterministic search, MAs have been proven to be successful in solving complex optimization problems [14], [31], [37], [55]. One important application area of MAs is in the EMO community [15], [25]. Since the mid-1990s, a number of multiobjective MAs (MOMAs) have been proposed [11], [23], [45], [50]. For example, Ishibuchi and Murata [21] proposed a multiobjective genetic LS approach for flow shop scheduling, which is the first well-known MOMA. Jaszkiewicz [22] developed a weighted sum function-based MOMA, and suggested that scalarizing functions are particularly better at encouraging diversity than dominance ranking methods. The memetic-based Pareto archived evolution strategy (M-PAES), presented by Knowles and Corne [26], is an MOMA based on grid techniques. Unlike the aforementioned two algorithms, MPAES does not use scalarizing functions but rather a Pareto ranking-based selection. Recently, Bosman [3] presented an analytical description of the set of all nondominated improving directions for any point in the decision space of an MOP. Moreover, he used this description in a gradient-based optimization algorithm. On the other hand, some interesting extensions of established EMO algorithms with respect to the idea of MAs have been emerging. These extensions focus on some popular algorithms, such as the nondominated sorting GA II (NSGA-II) [6], strength Pareto EA 2 (SPEA2) [64], decomposition-based multiobjective EA (MOEA/D) [63], S metric selection EMO algorithm (SMS-EMOA) [2], and multiobjective covariance matrix adaptation evolution strategy (MO-CMA-ES) [20]. By integrating efficient LS strategies, these extensions greatly enhance the search ability of algorithms in comparison with their original versions (see [27], [36], [47], [56], [58]). Among these, the convergence acceleration operator (CAO) [1] and hill climber with sidestep (HCS) [30] are two representative local searchers. The former, based on a neural network technique, is
2
used to accelerate the convergence speed of EMO algorithms by mapping the improved vectors of the objective space into the decision space. The latter utilizes the geometry of the directional cones of optimization problems and works with or without the gradient information. Hybridization of EAs with non-LS operators has also attracted increasing attention over the past few years. Despite the lack of the property of converging into a local optimum, these variation operators can clearly enhance the search ability of an EA when an appropriate combination between them and original genetic operators (such as crossover and mutation) in the EA is made. By exploiting specialized knowledge of the problem being solved, such hybrid EAs have been found to be promising in dealing with various optimization problems. Specifically, Tan et al. [51] proposed a two-phase hybrid evolutionary classification technique to extract classification rules in clinical practice for better understanding and prevention of unwanted medical events. Fan and Lampinen [12] incorporated differential evolution with a trigonometric mutation operator. Due to the capability of obtaining an acceptable solution with a lower number of objective function evaluations, this hybrid algorithm can be used in some expensive real-world problems, e.g., neural networks [12]. In order to address constrained optimization problems, Wang et al. [57] developed a hybrid EA which uses the idea of multiobjective optimization to balance exploration and exploitation during the evolutionary process. Tizhoosh [53] proposed an opposition-based learning (OBL) operator for intelligent optimization algorithms. Incorporated into differential evolution, particle swarm optimization, and estimation of distribution algorithms, OBL has been found to be competitive in many fields [42], [43]. For multiobjective optimization, it is also not uncommon to apply non-LS operators to improve the performance of EMO algorithms. Nebro et al. [40] presented a hybrid EMO algorithm that incorporates traditional mutation and crossover into the scatter search technique. In order to adapt the dynamic search of evolutionary operation in multiobjective optimization, Tan et al. [52] developed an adaptive variation operator that exploits the chromosomal structure of binary representation and synergizes the function of crossover and mutation. Elhossini et al. [10] hybridized PSO with genetic operators to solve MOPs. Genetic operators are modified to preserve the position information required by the PSO algorithm. Chan et al. proposed a hybrid EMO algorithm which uses the “jumping gene” operator to enhance the search ability during the evolutionary process for both binary-valued and real-valued scenarios [4], [39]. Overall, the impressive record of hybrid EAs with both LS and non-LS operators has proven their merits in the EMO community. Nevertheless, further study on hybrid EMO algorithms is still greatly needed to deeply explore and exploit the characteristics of multiobjective optimization. This paper focuses on the hybridization of EMO algorithms with non-LS operators and tries to develop a variation operator to improve the performance of EMO algorithms on continuous MOPs by utilizing the characteristics of multiobjective optimization. A conspicuous feature of multiobjective optimizers is to consider the diversity of solutions in the evolutionary process.
In this regard, performing single solution-based search as in single-objective optimization may fail if the information of other solutions is ignored. In fact, the essential characteristic in multiobjective optimization is that there exists no single optimal solution but a set of nondominated solutions due to the conflicting nature of multiple criteria. Therefore, in general, during the evolutionary process of a population, there is no solution better than all other solutions for all objectives, i.e., a solution may be optimal with respect to some objectives but not to the others. In this case, a variation strategy based on the search among “good” solutions may be more beneficial in multiobjective optimization because their offspring may inherit distinct strengths from them. In this paper, we propose a variation operator, called segment-based search (SBS). SBS divides the search space into many small segments according to the evolutionary information feedback from the current optimal solutions (i.e., nondominated solutions), and performs information exchange among “good” individuals, which is called macro-jumping operation, and the local exploitation of a “good” individual, which is called micro-jumping operation, inside these segments. This is done in order to offer, on the one hand, an extensive probe in the space achieved already by the current evolutionary population, and on the other hand, a local refinement in the neighborhood of a single individual. In addition, the running of SBS is adaptive according to the evolutionary status of a population. It is activated only when general genetic operators of an algorithm do not work well, thus providing a needed fuel to the stagnant population without hindering the fast-evolving process of the population. The remainder of the paper is organized as follows. The proposed operator, including the fundamental mechanisms of SBS and specific implementation of SBS in an EMO algorithm, is presented in Section II. Section III gives the algorithm setting, test functions, and performance metrics used for the experimental study in this paper. The performance validation of SBS and the comparison with other three operators are shown in Section IV and Section V, respectively. Finally, Section VI provides some concluding remarks along with pertinent observations and discussions for future work. II. T HE P ROPOSED M ETHOD It is well-established that the key design point for the hybridization of EAs with variation operators lies in the successful promotion of competition and cooperation between the forces of evolution and variation of individuals. When the balance between general genetic operators and introduced variation operators is not appropriately made, the performance of hybrid EAs is often severely degraded. This balance naturally involves several important issues, which should be addressed by the practitioner and are described as follows: • What variation operator should be used in an EA for a particular problem? • How often should the newly-introduced variation be applied (i.e., the frequency of variation operations)? • Which individuals should be selected to perform the variation?
3
Fig. 1. Configuration of segments in a 1-D decision space, where black points stand for a set P of points, S0 , S1 , ..., S7 are the segments determined by P , and |S| denotes the length of a segment. The interval [p − |S|, p + |S|] corresponds to the micro-jumping range of point p, and the grey point p′ is an example of a macro-jumping variation of p.
When shall the variation be applied? In the following subsections, we address these issues stepwise. First, we introduce the basic operation of SBS and then detail its specific implementation in an EMO algorithm. •
A. Segment-Based Search (SBS) Many existing variation operators act on a single individual and generate offspring by exploiting its neighborhood. However, with an MOP, there often exist some individuals that perform well for different objectives. Therefore, search based on information exchange among “good” individuals seems to be beneficial to producing better offspring. Here, we concentrate on the whole nondominated solution set in the current population. To be precise, we consider the region determined by the boundaries of the nondominated set in each dimension of the decision space, and divide it into a certain number of segments. Consequently, the SBS operator, specifically divided into micro-jumping and macro-jumping operations, will be implemented on the basis of these segments. Some segmentrelated concepts are given as follows. For the convenience of discussion, we take a D = 1 dimensional decision space as an example. Figure 1 illustrates the configuration of segments in it. First, the minimum and maximum decision values among a set of points P are found and denoted as min(P ) and max(P ), respectively. The length of each segment will then be determined according to the following formula: |S| = (max(P ) − min(P ))/L
(1)
where L is an integer value and usually set by the size of the population. Then, the lower boundary lb and upper boundary ub of the region are respectively defined as follows: lb = min(P ) − |S|
(2)
ub = max(P ) + |S|
(3)
Clearly, the region is divided into (L + 2) equal segments. They are S0 , S1 , ..., SL , and SL+1 . The serial number of the segment where a point, denoted as p, is located can be calculated as follows: sn(p) = ⌊ (p − lb)/|S| ⌋
(4)
For example, in Fig. 1, the serial number of p is 2. Next, we detail the SBS variation, namely, the microjumping and macro-jumping operations, according to the above preliminary concepts. Micro-jumping is a local refinement scheme which searches in the neighborhood of a solution, while macro-jumping is an extensive probe which explores in the whole specified region. Specifically, for a point p, a micro-jumping operation is to generate a random point in the range [p − |S|, p + |S|]; while for a macro-jumping operation, p is transferred to one of the L + 2 segments in a random manner. That is, an integer i among 0, 1, ..., L, L + 1 is firstly randomly selected, and then a new point (denoted as p′ ) is formed according to the following formula: p′ = p + (i − sn(p)) × |S|
(5)
Clearly, macro-jumping is a jump to a point chosen at random from a limited set of points distributed across the whole search region. For example, in Fig. 1, assuming that i is 5, p will jump rightwards 3 segments to p′ . Note that the SBS operator extends the boundaries of the set of points: the new points generated by SBS have the opportunity of being located in segment S0 or segment SL+1 . This slight relaxation of the interested region will be beneficial to enhancing the diversity of individuals in the evolution search, especially for multiobjective optimization. We will give an explanation regarding this point in the next section. B. SBS in Multiobjective Optimization In hybrid EAs, newly-introduced variation operation inevitably competes with traditional genetic operation for limited computational resources. Given a fixed computational budget, the frequency of new variation operation will directly affect the degree of traditional genetic operation. Clearly, more intense individual variation provides a greater chance of discovering promising solutions but limits the amount of evolution without incurring excessive computational resources. Therefore, care should be taken in setting the frequency of variation operations to utilize limited computational resources for achieving the best search performance. In multiobjective optimization, comparing individuals is often based on their Pareto dominance relation. Given two individuals a and b, a is said to dominate b if and only if a is at least as good as b in all objectives, and better in at least one objective. Accordingly, individuals in a population that are not dominated by any other individuals are denoted as the nondominated individuals with respect to this population. For a genetic operator, if there exist newly generated individuals dominating some individuals of their parent population, it means that the operator has the capability of improving the performance of the current evolutionary population. And if there is no individual in the new population that dominates any individuals in their parent population, it may mean that the operator currently fails to provide enough power to drive the population forwards. Naturally, the number of nondominated individuals in the mixed set consisting of a population and its offspring population will largely reflect the evolutionary status of an EMO algorithm. At the initial stage of evolution,
4
0.14
When |NS|N
0.30
When | When |
NS N NS N |
0.12
0.25
0.20
GD
GD
0.10
0.15
0.08
0.10
0.05
0.06
0.00 0.04
0
50
100
150
200
250
Generations
(a) ZDT1
0
50
100
150
200
250
Generations
(b) WFG1
Fig. 2. Evolutionary trajectory of the convergence metric GD for a typical run of NSGA-II on ZDT1 [65] and WFG1 [19]. The dashed line indicates the stages where the number of nondominated solutions (denoted as |N S|) in the mixed set R (i.e., the combination of the parent and offspring populations in each generation) is smaller than or equal to the population size N (|R| = 2N ), and the solid line indicates the stages where |N S| is larger than N .
it is usually easy to produce new individuals by the genetic operators (such as crossover and mutation operators) that dominate some individuals in their parent population, and thus, the number of nondominated individuals in the mixed population is often small. With the progress of evolution, that number will be gradually increased since there will be more and more nondominated individuals in the parent population, and it becomes harder for new individuals to dominate them. Especially, when the number of nondominated individuals exceeds a significant proportion of the mixed population, the convergence may slow down or even cease. This phenomenon often happens at the time the population approaches the (local) optimal front. This, to some extent, indicates that the current population is difficult to evolve further towards the desired area. Figure 2 gives two examples of the relationship between convergence1 and the number of nondominated individuals in the mixed set consisting of the parent and offspring populations during the evolutionary process of a typical run of the NSGA-II algorithm2 . Clearly, when the number of nondominated individuals exceeds half of the size of the mixed set, the ability to evolve forwards will slow down to some extent. This occurs, for ZDT1 [65], when the population approaches the optimal front, whereas, for WFG1 [19], when the population might be trapped into some local optima in view of its relatively large GD value. In this study, we introduce SBS at this stage in order to enhance the exploration ability for the case of being trapped into local optima (e.g., for WFG1), or to refine the exploitation result for the case of approaching global optima (e.g., for ZDT1). The framework of integrating SBS into a general EMO algorithm is given in Algorithm 1. In Algorithm 1, Step 4 tests the running condition of SBS. If the number of nondominated individuals in R is larger than the population size N , the SBS variation will be activated (Step 5); otherwise, T becomes empty (Step 7). Step 9 implements the mating selection and genetic operations (e.g., crossover and mutation) of the original EMO algorithm to generate (N −|T |) 1 The results are evaluated by the generational distance (GD) metric [7]. GD assesses the convergence of a solution set by calculating the average Euclidean distance from the set to the Pareto front. 2 The parameter settings of the algorithm are the same as in the experimental study, shown in Table II.
Algorithm 1 EMO Algorithm with SBS Require: N (population size) 1. Generate an initial population P and create empty temporary sets R and P ′ 2. Create an empty temporary set Q for storing the nondominated individuals in R, and an empty set T for storing the individuals generated by SBS 3. while termination criterion not fulfilled do 4. if |Q| > N then 5. T ← SBS variation(Q\P, Q) /∗ Implement SBS when the size of Q is larger than N ∗ / 6. else 7. T ←∅ 8. end if 9. P ′ ← M atingselection variation(P, (N − |T |)) /∗ Implement mating selection and genetic variation to generate (N − |T |) individuals ∗ / 10. P′ ← P′ ∪ T 11. R ← P ∪ P′ 12. Q ← N ondominated selection(R) /∗ Find all nondominated individuals of R ∗ / 13. P ← Environmental selection(R) 14. end while 15. return P
individuals. Therefore, a new population will be composed of (N − |T |) individuals generated by genetic operators, and |T | individuals generated by SBS (Step 10). Figure 3 graphically demonstrates the process of the case where SBS is activated. The SBS variation only acts on the set Q\P 3 (i.e., the nondominated individuals that have been eliminated by the environmental selection) rather than either P (i.e., the elite individuals) or R\Q (i.e., the dominated individuals). There are |Q\P | individuals to be generated, but not all of them will be preserved. A new individual will enter the next population only if it is not dominated by its parent. Therefore, the number of evaluations per generation becomes higher when SBS is implemented (i.e., |Q\P | − |T | evaluations are added per generation). Several strengths of applying SBS to the set Q\P are drawn as follows. • Individuals from the set Q\P perform well in terms 3 Note that the segments in the variation are defined using Q, cf. Step 3 in Algorithm 2.
5
Algorithm 2 SBS variation(Q\P, Q)
Fig. 3. A sketch of the integration of SBS, where R denotes the mixed population to be maintained, Q corresponds to the nondominated individuals from R, and P stands for the elite individuals picked out from R by the environmental selection of an EMO algorithm.
•
•
of convergence and there are no individuals dominating them in the set R. Applying SBS on them has a greater chance to generate better offspring in comparison with applying SBS on the dominated individuals in R\Q. Although being nondominated solutions in R, individuals from Q\P are not used as parents to generate offspring. Moreover, in contrast to the probable long time existence of the elite individuals in P during the evolutionary process, solutions in Q\P will not exist in the next generation population. Therefore, applying SBS on them means to give them a chance to contribute their value, which may be beneficial to exploring the potential of every nondominated individual in R. The number of individuals in Q\P varies adaptively according to the evolutionary situation. On the one hand, when the size of the nondominated set Q is relatively small, the evolutionary population appears to still have some potential to be exploited and thus the impact of SBS is relatively weak. On the other hand, when the size becomes larger, the population in general evolves more slowly and the impact of SBS increases correspondingly.
Up to now, the four issues with respect to the design of a hybrid EA mentioned at the beginning of this section have been addressed—a segment-based variation operator is used; it is activated when the number of nondominated individuals exceeds half of the size of the mixed set consisting of the parent and offspring populations; it acts on nondominated individuals that are eliminated by the environmental selection; and it occurs before mating selection and genetic operations but after the environmental selection process. Algorithm 2 gives the pseudocode of the implementation of SBS. The main procedure of SBS can be divided into two parts. The first part, consisting of Steps 2–5, makes preparations for the SBS variation, including setting up the environment of segments (i.e., the length of a segment and the lower and upper boundaries) in each dimension of the decision space and selecting individuals for variation. The second part, consisting of Steps 6–29, details the implementation process of SBS. In this part, there are two user-defined probability parameters, M iP and SR. M iP denotes a proportion of micro-jumping
Require: N (population size), D (problem dimension in the decision space), SR (SBS rate), M iP (micro-jumping proportion), M iM (micro-jumping mark), M aN (macro-jumping number), jrand (random parameter to ensure variation) 1. Create an empty temporary set U and an empty set T for storing the individuals generated by SBS 2. for all dimension j in the decision space, j = 1, ..., D do 3. Set segment(Q, j, N ) /∗ Set the environment of segments in dimension j according to Eqs. (1), (2), and (3), including the length of a segment, the lower and upper boundaries, denoted as |S|j , lbj and ubj , respectively ∗ / 4. end for 5. U ← Q \ P /∗ Act on the nondominated individuals which have been eliminated ∗ / 6. for all pi ∈ U, i = 1, ..., |U | do 7. if rand(0, 1) < M iP /∗ Determine whether micro-jumping or macro-jumping ∗ / then 8. M iM ← 1 9. else 10. M iM ← 0 11. M aN ← ⌊rand[0, 1) × (N + 2)⌋ /∗ Select a random integer among {0, 1, ..., N, N + 1} for the macro-jumping variation ∗ / 12. end if 13. jrand ← ⌊rand[0, 1) × D⌋ + 1 /∗ Select a random integer among {1, 2, ..., D} ∗ / 14. for all dimension j of pi , j = 1, ..., D do 15. if rand(0, 1) < SR ∨ j = jrand then 16. if M iM = 1 then 17. p′ij ← rand[pij − |S|j , pij + |S|j ] /∗ Implement the micro-jumping variation ∗ / 18. else 19. p′ij ← pij + (M aN − Snj (pij )) × |S|j /∗ Implement the macro-jumping variation ∗ / 20. end if 21. else 22. p′ij ← pij 23. end if 24. end for 25. eval(p′i ) /∗ Evaluate new individual ∗ / 26. if ¬(pi ≺ p′i ) /∗ Compare the new individual with its parent ∗ / then 27. T ← T ∪ {p′i } 28. end if 29. end for 30. return T
versus macro-jumping, and SR denotes a rate of the SBS variation. Additionally, parameter jrand is a random integer to ensure that at least one element is selected to vary in each interested individual. Steps 26–28 are used to determine the survival of new individuals. A new individual will be saved only if it does not perform worse than its parent, i.e., it is not dominated by its parent. Finally, it is worthwhile to mention that the range of the concerned region in SBS always changes in the evolutionary process since it is determined by the current population. This, similar to the OBL operator developed in [43], [53], will help to shrink the search space and employ existing knowledge of evolution. Nevertheless, a key difference from the OBL variation is the slight relaxation of the boundaries of the solution set in SBS. This will be more useful to enhance
6
the diversity of the population in multiobjective optimization because the optimal result of an MOP is a region, rather than a solitary point, in contrast to a single-objective optimization problem. An experimental study of this relaxation strategy will be given in Section IV-C. III. E XPERIMENTAL D ESIGN In order to verify SBS, we integrate it into three widely-used EMO algorithms, NSGA-II [6], SPEA2 [64] and SMS-EMOA [2]. NSGA-II is one of the most popular EMO algorithms. The main characteristic is its fast nondominated sorting and crowding distance-based density estimation. SPEA2 is also a prevalent EMO algorithm, which borrows a so-called fitness strength value and the k-th nearest neighbor density estimation to select individuals into the next population. SMS-EMOA is an indicator-based EMO algorithm, which maximizes the hypervolume contribution of a population during the evolutionary process. Combined with the concept of nondominated sorting, SMS-EMOA can produce a well-converged and welldistributed solution set. Note that the original SMS-EMOA adopts a steady-state evolution model, which creates only one new member and then tests whether it can enter the archive or not at each step of the algorithm. Here, to make SMS-EMOA suitable in the framework of SBS, we modify the original SMS-EMOA and adopt a generational evolution version of the algorithm, which, like NSGA-II and SPEA2, creates a set of new solutions and tests whether they can enter the next population or not at each step of the algorithm [8]. In addition, since the original implementation of SPEA2 and SMS-EMOA does not contain any constraint handling mechanism, we modified their implementation by applying the same constraint handling mechanism used in NSGA-II. In the following subsections, we introduce the test problems, performance metrics, and parameter setting for the comparative study. A. Test Problems A comprehensive set of 36 MOPs are used for performance verification of the proposed method. These test problems have been commonly used in the literature. They can be divided into several groups according to the number of objectives and constraint conditions. For the first group of bi-objective unconstrained problems, we first choose problems from Veldhuizen’s studies [54], including Schaffer, Fonseca1, Fonseca2, Kursawe, and Poloni problems. Then, the ZDT problem family (including ZDT1, ZDT2, ZDT3, ZDT4, and ZDT6) [65] is considered. Finally, the walking fish group (WFG) problem family (WFG1 to WFG9) [19] based on variable linkage is also contained in this group. The second group consists of the bi-objective constrained problems from [7], including BEL, BINH, OSY2, TNK, SRIN, and Constr Ex. For the third group, we select MOPs with three objectives. First, four Viennet problems [54] (VNT1, VNT2, VNT3, and VNT4) are chosen, of which the first three problems have three objectives and no constraints, and the fourth one has three objectives and three constraints.
Then, the unconstrained DTLZ problem family [9] (DTLZ1 to DTLZ7) is considered. B. Performance Metrics To compare the algorithms, we use two performance metrics, i.e., inverted generational distance (IGD) [63] and Hypervolume (HV) [7], which are commonly used in the EMO community [34], [35]. In addition, median attainment surfaces [13] are provided for visual inspection of the performance of algorithms on some test problems. IGD measures the average distance from the points in the Pareto front to their closest solution in the obtained set. Mathematically, let P ∗ be a reference set representing the Pareto front, then the IGD value from P ∗ to the obtained solution set P is defined as follows: / ∑ IGD = d(z, P ) |P ∗ | (6) z∈P ∗ ∗
where |P | denotes the size of P ∗ (i.e., the number of points in P ∗ ) and d(z, P ) is the minimum Euclidean distance from point z to P . A low IGD value is preferable, which indicates that the obtained solution set is close to the Pareto front as well as having a good distribution. The HV metric calculates the volume of the objective space enclosed by the obtained solution set and a reference point. A large value is preferable. It can be described as the Lebesgue measure Λ of the union hypercubes hi defined by a solution pi in the set and the reference point xref as follows: ∪ ∪ HV = Λ({ hi | pi ∈ P }) = Λ( {x | pi ≺ x ≺ xref }) i
pi ∈P
(7) Note that, in the calculation of HV, the solutions that do not dominate the reference point are discarded (i.e., the solutions that are worse than the reference point in at least one objective will contribute zero to HV). Plotting median attainment surfaces of EMO algorithms’ results (i.e., the final solutions) is a good performance comparison method, which allows visual inspection of the performance of algorithms regarding convergence and diversity [13]. For one run of an algorithm, the attainment surface of its results divides the objective space into two regions: one containing solutions which are dominated by its results, and another containing solutions that dominate its results. For multiple runs of an algorithm, the median attainment surface is the surface that the algorithm’s results are expected to attain in 50% of the runs. Here, we use Knowles’s approach to plot the median attainment surface [24]. The code is available at http://www.cs.man.ac.uk/∼jknowles/plot attainments/. C. General Experimental Setting The parameter settings for all conducted experiments are given as follows unless explicitly mentioned otherwise. • Parameter setting in SBS: In the SBS operator, both SR and M iP (i.e., the SBS rate and micro-jumping proportion) are set to 0.5 for the comparative study. The effect of these two parameters on the performance of SBS will be investigated in detail in Section IV-D.
7
TABLE I S ETTING OF THE REFERENCE POINT IN HV SCH FON1 FON2 KUR POL ZDT1 ZDT2 ZDT3 ZDT4 ZDT6 WFG1 WFG2
•
•
•
•
•
•
(5, 5) (2, 2) (2, 2) (-14, 1) (0, 1) (2, 2) (2, 2) (2, 2) (2, 2) (2, 2) (3, 5) (3, 5)
WFG3 WFG4 WFG5 WFG6 WFG7 WFG8 WFG9 BEL BINH OSY2 TNK SRIN
(3, 5) (3, 5) (3, 5) (3, 5) (3, 5) (3, 5) (3, 5) (1, 11) (199, 50) (-41, 76) (2, 2) (226, 3)
FOR ALL THE TEST PROBLEMS
ConstrEx VNT1 VNT2 VNT3 VNT4 DTLZ1 DTLZ2 DTLZ3 DTLZ4 DTLZ5 DTLZ6 DTLZ7
(2, (5, (5, (9, (8, (1, (2, (2, (2, (2, (2, (2,
10) 6, 5) -16, -12) 18, 1) -11, 26 1, 1) 2, 2) 2, 2) 2, 2) 2, 2) 2, 2) 2, 7)
Parameter setting of genetic operators in the tested algorithms: In NSGA-II, SPEA2, and SMS-EMOA, two widely-used crossover and mutation operators, i.e., the simulated binary crossover (SBX) and polynomial mutation [7], are chosen. Following the practice in [6], the distribution indexes in both the SBX and polynomial mutation are set to 20. A crossover probability pc = 1.0 and a mutation probability pm = 1/D (where D is the number of decision variables) are used according to [7]. Population and archive size: Like most of the studies of EMO algorithms, the population size is set to 100, and the archive set, if used, is maintained with the same size as the population size. Number of decision variables in scalable problems: ZDT, DTLZ, and WFG are three suites of test problems, whose dimensionality D can be specified by the user. The default dimensionality Ddef ault is set to 30 for the first three ZDT problems, to 10 for ZDT4 and ZDT6, and to 12 for all the DTLZ problems except DTLZ1 and DTLZ7, whose Ddef ault is set to 7 and 22, respectively. For the WFG suite, Ddef ault is set to 6. Number of runs and stopping condition: We independently run each algorithm 30 times for each test problem. The termination criterion of an algorithm is a predefined number of evaluations. Here, we set the number of evaluations to different values for problems with different numbers of objectives, since the difficulty of problems generally increases with the number of objectives [46]. The number of evaluations is set to 25,000 and 30,000 for bi-objective and tri-objective problems, respectively. Reference point setting in HV: Similar to [29], we select the integer point slightly larger than the worst value of each objective on the Pareto front of a problem as its reference point, as given in Table I. Substitution of the Pareto front for IGD: For the IGD metric, it is necessary to know the Pareto front of test problems. In most of the test problems used in this work, including families ZDT, DTLZ, and WFG, their Pareto fronts are known. For them, we select 10,000 evenlydistributed points along the Pareto front as its substitution in the calculation of IGD. For other test problems, the substitution of their Pareto fronts is available from the web site http://www.cs.cinvestav.mx/∼emoobook/.
The parameter settings are summarized in Table II.
TABLE II PARAMETER SETTINGS IN COMPARATIVE EXPERIMENTS SR in SBS M iP in SBS Crossover Mutation ηc in SBX
0.5 0.5 SBX Polynomial 20
Crossover Prob. Mutation Prob. Population Size Archive size Run Number
ηm in Polynomial
20
Evaluation Number
1.0 1/D 100 100 (if existing) 30 25 000 (2-obj MOPs) 30 000 (3-obj MOPs)
D. Experimental Classification In order to carry out a reliable and comprehensive comparison, we categorize the experiments into five groups: 1) Performance verification of SBS; 2) Effect of the problem dimensionality; 3) Effect of the boundary relaxation strategy; 4) Setting of newly added control parameters; 5) Comparison of SBS with OBL [43], [53], jumping gene [4], [39], and M¨uhlenbein’s mutation [38]. Unless mentioned otherwise, the same parameter settings as described in the previous subsection are adopted in each experiment. IV. P ERFORMANCE V ERIFICATION OF SBS In this section, we investigate the performance of the proposed SBS operator following the experimental design outlined in the previous section. We embed SBS into NSGAII, SPEA2, and SMS-EMOA, and call them NSGA-II+SBS, SPEA2+SBS, and SMS-EMOA+SBS, respectively. The values included in the tables of results are mean and standard deviation (SD) over 30 independent runs, and a better mean is highlighted in boldface. In addition, a t-test is used to compare tested algorithms on each function. The symbol “†” indicates that the p value of 58 degrees of freedom is significant at a 0.05 level of significance by a two-tailed t-test. A. Performance Verification of SBS First, we compare NSGA-II+SBS with the original NSGAII. The results of 36 benchmark functions regarding the IGD and HV metrics are given in Table III and Table IV, respectively. Clearly, NSGA-II+SBS performs significantly better than NSGA-II regarding both metrics. NSGA-II+SBS obtains better values in 26 and 25 out of the 36 test problems regarding IGD and HV, respectively. Also, for the majority of the problems on which NSGA-II+SBS outperforms NSGAII, the results have statistical significance (16 out of the 26 problems for IGD and 19 out of the 25 problems for HV). Note that the degree of performance improvement brought by SBS is considerable on some problems where NSGA-II fails to converge, such as WFG1 and DTLZ6. For these test cases, NSGA-II+SBS can greatly enhance the search ability, successfully guiding the solutions to approximate the Pareto front of the problem. This occurrence may be attributed to the macro-jumping operation in SBS which can produce some promising individuals to help the current stagnant population. Figure 4 plots the 50% attainment surfaces [24] across the 30 runs of NSGA-II and NSGA-II+SBS on DTLZ6. It is clear that NSGA-II+SBS performs better than NSGA-II since
8
IGD
COMPARISON ( MEAN AND
Problem
NSGA-II
SCH FON1 FON2 KUR POL ZDT1 ZDT2 ZDT3 ZDT4 ZDT6 WFG1 WFG2
1.8771E–2 (4.3E–4) 5.5654E–3 (1.7E–4) 5.1506E–3 (4.8E–4) 4.2322E–2 (1.9E–3) 6.9685E–2 (5.7E–3) 4.8182E–3 (2.1E–4) 4.8259E–3 (1.5E–4) 5.6881E–3 (2.9E–3) 6.5921E–3 (1.8E–3) 7.6800E–3 (7.9E–4) 6.0320E–1 (1.6E–1) 1.4325E–2 (1.8E–3)
SD)
OF
NSGA-II
AND
TABLE III NSGA-II+SBS, WHERE A BETTER MEAN FOR EACH
NSGA-II+SBS
Problem
2.0708E–2 (1.0E–3)† 5.3936E–3 (1.6E–4)† 4.7103E–3 (3.8E–4)† 4.0716E–2 (1.7E–3)† 6.8244E–2 (6.5E–3) 4.7562E–3 (1.5E–4) 4.8336E–3 (1.8E–4) 5.2475E–3 (1.5E–4)† 4.8866E–3 (3.9E–4)† 7.6767E–3 (9.2E–4) 3.8278E–1 (9.4E–2)† 1.3368E–2 (1.8E–3)
WFG3 WFG4 WFG5 WFG6 WFG7 WFG8 WFG9 BEL BINH OSY2 TNK SRIN
NSGA-II 1.4912E–2 (8.4E–4) 1.3453E–2 (8.4E–4) 6.7917E–2 (1.6E–3) 3.1062E–2 (2.2E–2) 1.6107E–2 (8.3E–4) 1.6122E–1 (4.4E–2) 1.7037E–2 (1.3E–3) 4.6136E–2 (1.6E–3) 7.0908E–1 (3.5E–2) 1.9822E+0 (1.6E+0) 4.6804E–3 (1.9E–4) 1.0620E+0 (5.6E–2)
CASE IS HIGHLIGHTED IN BOLDFACE
NSGA-II+SBS
Problem
1.6040E–2 (8.6E–4)† 1.3952E–2 (1.2E–3)† 4.8085E–2 (1.0E–2)† 1.6322E–2 (7.9E–4)† 1.6887E–2 (9.0E–4)† 1.5364E–1 (5.1E–2) 1.6340E–2 (1.1E–3)† 4.6982E–2 (2.7E–3) 6.7334E–1 (2.6E–2)† 2.3752E+0 (3.1E+0) 4.5008E–3 (1.8E–4)† 1.0618E+0 (6.9E–2)
ConstrEx VNT1 VNT2 VNT3 VNT4 DTLZ1 DTLZ2 DTLZ3 DTLZ4 DTLZ5 DTLZ6 DTLZ7
NSGA-II
NSGA-II+SBS 1.9411E–2 (4.9E–4)† 1.5755E–1 (4.9E–3) 2.7150E–2 (3.1E–3)† 4.9483E–2 (4.1E–3) 1.9224E–1 (1.7E–2)† 2.6728E–2 (2.3E–3)† 6.7885E–2 (1.8E–3)† 2.4079E+0 (2.0E+0) 6.4644E–2 (2.7E–3)† 5.5862E–3 (2.3E–4) 6.1896E–3 (4.4E–4)† 7.6039E–2 (3.7E–3)
1.9920E–2 (6.3E–4) 1.5816E–1 (6.7E–3) 2.3144E–2 (2.3E–3) 4.9851E–2 (3.2E–3) 1.7792E–1 (1.2E–2) 3.3798E–2 (3.2E–2) 6.8952E–2 (3.0E–3) 2.6043E+0 (2.0E+0) 2.0072E–1 (1.0E–1) 5.5368E–3 (3.7E–4) 6.5039E–1 (6.1E–2) 7.7007E–2 (4.1E–3)
“†” indicates that the p-value of 58 degrees of freedom is significant at a 0.05 level of significance by a two-tailed t-test.
HV
COMPARISON ( MEAN AND
Problem SCH FON1 FON2 KUR POL ZDT1 ZDT2 ZDT3 ZDT4 ZDT6 WFG1 WFG2
NSGA-II
SD)
OF
TABLE IV NSGA-II AND NSGA-II+SBS, WHERE A BETTER MEAN FOR EACH
NSGA-II+SBS
Problem †
2.2270E+1 (2.0E–3) 3.0617E+0 (2.0E–4) 3.3337E+0 (3.6E–4) 3.7002E+1 (1.3E–2) 7.5255E+1 (7.8E–2) 3.6591E+0 (4.3E–4) 3.3250E+0 (4.9E–4) 4.8129E+0 (4.1E–4) 3.6530E+0 (3.9E–3) 3.0221E+0 (2.4E–3) 8.2253E+0 (9.8E–1) 1.0978E+1 (4.1E–1)
WFG3 WFG4 WFG5 WFG6 WFG7 WFG8 WFG9 BEL BINH OSY2 TNK SRIN
2.2263E+1 (5.6E–3) 3.0620E+0 (2.0E–4)† 3.3358E+0 (2.8E–4)† 3.7013E+1 (1.7E–2)† 7.5278E+1 (6.9E–2) 3.6595E+0 (3.5E–4)† 3.3255E+0 (5.3E–4)† 4.8138E+0 (2.1E–4)† 3.6579E+0 (2.1E–3)† 3.0238E+0 (3.6E–3)† 9.2293E+0 (5.1E–1)† 1.1068E+1 (4.2E–1)
NSGA-II
NSGA-II+SBS
1.0933E+1 (6.4E–3) 8.6685E+0 (2.8E–3) 8.1585E+0 (3.1E–2) 8.5565E+0 (1.0E–1) 8.6704E+0 (2.7E–3) 7.0983E+0 (5.7E–1) 8.4303E+0 (1.6E–2) 7.0334E+1 (2.6E–2) 8.2259E+3 (3.4E+0) 1.2559E+4 (1.2E+3) 3.2230E+0 (3.1E–4) 2.5754E+4 (1.6E+1)
CASE IS HIGHLIGHTED IN BOLDFACE
Problem †
NSGA-II
ConstrEx VNT1 VNT2 VNT3 VNT4 DTLZ1 DTLZ2 DTLZ3 DTLZ4 DTLZ5 DTLZ6 DTLZ7
1.0927E+1 (3.9E–3) 8.6611E+0 (7.5E–3)† 8.2788E+0 (6.8E–2)† 8.6586E+0 (4.6E–3)† 8.6659E+0 (2.6E–3)† 7.1459E+0 (5.3E–1) 8.4380E+0 (9.6E–3)† 7.0285E+1 (4.0E–2)† 8.2380E+3 (2.0E+0)† 1.2541E+4 (2.0E+2) 3.2231E+0 (2.7E–4) 2.5770E+4 (1.9E+1)†
NSGA-II+SBS 1.3399E+1 (1.5E–3)† 6.1052E+1 (1.3E–1)† 1.9062E+0 (2.0E–3)† 2.8359E+1 (4.3E–3)† 8.9139E+1 (2.1E–1)† 9.6833E–1 (2.4E–3) 7.3621E+0 (1.3E–2)† 1.3467E+0 (2.0E+0) 7.3853E+0 (5.1E–3)† 6.0983E+0 (6.6E–4)† 6.0904E+0 (2.1E–2)† 1.3201E+1 (4.9E–2)†
1.3398E+1 (1.5E–3) 6.1205E+1 (1.3E–1) 1.9098E+0 (1.5E–3) 2.8353E+1 (3.6E–3) 8.9195E+1 (2.2E–1) 9.6730E–1 (2.0E–3) 7.3560E+0 (1.5E–2) 6.9193E–1 (1.7E+0) 7.3790E+0 (7.8E–3) 6.0992E+0 (5.8E–4) 3.9239E+0 (2.8E–1) 1.3259E+1 (4.7E–2)
“†” indicates that the p-value of 58 degrees of freedom is significant at a 0.05 level of significance by a two-tailed t-test.
1.0
3.0
50
3.0
2.5
2.5
0.8
1.5
f3
0.5
0.5 0.0
0.0
0.0
1.5
0.5
2.0
1.0
1.5
f2
2.0
2.5
(a) NSGA-II
2.5
0.0
0.5
0.5
0.6
30
20
0.4
10
0.2
1.0
1.0
0.0
f3
1.0
Probability
1.5
1.0
Solution Number
40 2.0
2.0
f1
1.5
0.0
0.5
f1
2.0 1.0
1.5
f2
2.0
2.5
2.5
(b) NSGA-II+SBS
Fig. 4. 50% attainment surfaces across the 30 runs of NSGA-II and NSGAII+SBS on DTLZ6.
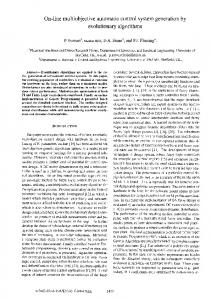
the median attainment surface of NSGA-II+SBS has a larger dominated space than that of NSGA-II. In order to investigate the “success rate” of the SBS operator during the evolutionary process, we also show, as a function of the number of evaluations, the probability that a solution generated by SBS has been inserted into the population across the 30 runs of NSGA-II+SBS on DTLZ6 in Fig. 5. Clearly, despite fluctuating, the probability value exceeds 30% most of the time. This means that SBS is an efficient operator to generate “good” solutions (i.e., solutions that are not dominated by their parent) during the evolutionary process. To better understand the performance difference between NSGA-II and NSGA-II+SBS, we show the average HV result with standard errors during the whole evolutionary process
0
0.0 0
5000
10000
15000
20000
25000
30000
Evaluations
Fig. 5. Probability that a solution generated by SBS has been inserted into the population during the evolutionary process across the 30 runs of NSGAII+SBS on DTLZ6 (denoted by dashed line). Black square denotes the average number of solutions generated by SBS, and hollow circle denotes the average number of solutions inserted into the population.
across all 30 runs of the two algorithms on DTLZ6 and WFG1 in Fig. 6 and Fig. 7, respectively. As can be seen from the figures, an evident improvement of the HV value can be achieved when SBS is embedded into NSGA-II. For DTLZ6, the HV trajectory of NSGA-II+SBS increases rapidly from about 6,000 evaluations and approximates the optimal value (around 6.10) at about 23,000 evaluations. For WFG1, NSGAII+SBS shows a clear advantage over NSGA-II from around 7,000 evaluations until the end. Tables V and VI show the comparative results of SPEA2 and SPEA2+SBS. Similar to the case of NSGA-II+SBS, SPEA2+SBS has a clear advantage over the original SPEA2. It obtains a better value in 26 and 25 out of all 36 test
9
IGD Problem
COMPARISON ( MEAN AND
SPEA2
SCH FON1 FON2 KUR POL ZDT1 ZDT2 ZDT3 ZDT4 ZDT6 WFG1 WFG2
1.6602E–2 (1.1E–4) 4.6642E–3 (7.1E–5) 4.1800E–3 (3.2E–4) 3.4163E–2 (7.1E–4) 5.3129E–2 (1.1E–3) 4.1795E–3 (9.3E–5) 4.1675E–3 (1.2E–4) 5.5675E–3 (4.5E–3) 6.5020E–3 (2.1E–3) 8.3703E–3 (5.8E–4) 6.7301E–1 (1.5E–1) 1.2936E–2 (1.7E–3)
SD)
SPEA2
OF
SPEA2+SBS
AND
Problem
1.7022E–2 (1.2E–4)† 4.6273E–3 (6.3E–5)† 4.1763E–3 (2.6E–4) 3.3744E–2 (6.3E–4)† 5.2946E–2 (1.2E–3) 4.0831E–3 (9.2E–5)† 4.1325E–3 (7.4E–5) 4.8729E–3 (1.1E–4)† 6.1787E–3 (4.3E–3)† 7.8012E–3 (8.2E–4)† 4.7889E–1 (1.2E–1)† 1.2822E–2 (1.8E–3)
WFG3 WFG4 WFG5 WFG6 WFG7 WFG8 WFG9 BEL BINH OSY2 TNK SRIN
TABLE V SPEA2+SBS. A BETTER SPEA2 1.2377E–2 (3.2E–4) 1.2912E–2 (3.6E–4) 6.6539E–2 (1.2E–3) 3.3100E–2 (2.1E–2) 1.3062E–2 (2.8E–4) 1.6963E–1 (4.1E–2) 1.4066E–2 (1.2E–3) 3.7481E–2 (3.0E–4) 5.8733E–1 (1.6E–2) 5.1471E+0 (3.7E+0) 3.7424E–3 (1.8E–4) 8.4629E–1 (1.8E–2)
MEAN FOR EACH CASE IS HIGHLIGHTED IN BOLDFACE
SPEA2+SBS
Problem
1.2904E–2 (2.1E–4)† 1.3143E–2 (4.2E–4)† 4.6067E–2 (1.3E–2)† 1.5485E–2 (1.1E–2)† 1.3405E–2 (2.6E–4)† 1.7173E–1 (4.0E–2) 1.3965E–2 (1.2E–3) 3.8534E–2 (4.8E–4)† 5.6963E–1 (8.2E–3)† 5.7442E+0 (4.7E+0) 3.5562E–3 (1.2E–4)† 8.3597E–1 (1.4E–2)†
ConstrEx VNT1 VNT2 VNT3 VNT4 DTLZ1 DTLZ2 DTLZ3 DTLZ4 DTLZ5 DTLZ6 DTLZ7
SPEA2
SPEA2+SBS
1.9448E–2 (6.5E–4) 1.2716E–1 (2.7E–3) 1.2320E–2 (3.7E–4) 3.2437E–2 (1.0E–3) 1.1104E–1 (2.0E–3) 2.2106E–2 (2.7E–3) 5.4307E–2 (1.4E–3) 1.6749E+0 (1.3E+0) 1.9740E–1 (1.5E–1) 4.3666E–3 (3.8E–4) 6.4673E–1 (5.9E–2) 6.3174E–2 (2.8E–3)
1.9439E–2 (7.9E–4) 1.2588E–1 (2.8E–3)† 1.2094E–2 (2.8E–4)† 3.1997E–2 (1.0E–3) 1.1077E–1 (2.3E–3) 2.3114E–1 (8.4E–4)† 5.8633E–2 (2.0E–3)† 1.5016E+0 (1.1E+0) 1.4126E–1 (1.3E–1) 4.5009E–3 (1.1E–4)† 4.4969E–3 (2.0E–4)† 6.1327E–2 (1.7E–3)†
“†” indicates that the p-value of 58 degrees of freedom is significant at a 0.05 level of significance by a two-tailed t-test.
HV Problem
COMPARISON ( MEAN AND
SPEA2
SCH FON1 FON2 KUR POL ZDT1 ZDT2 ZDT3 ZDT4 ZDT6 WFG1 WFG2
2.2275E+1 (6.9E–4) 3.0621E+0 (1.1E–4) 3.3356E+0 (8.2E–4) 3.7069E+1 (1.1E–2) 7.5319E+1 (3.5E–2) 3.6596E+0 (4.4E–4) 3.3244E+0 (1.7E–3) 4.8000E+0 (6.6E–2) 3.6533E+0 (5.7E–3) 3.0192E+0 (3.0E–3) 7.6940E+0 (7.5E–1) 1.1090E+1 (4.1E–1)
SD)
OF
SPEA2
SPEA2+SBS
AND
Problem †
2.2273E+1 (8.7E–4) 3.0623E+0 (1.3E–4)† 3.3369E+0 (1.4E–4)† 3.7071E+0 (1.1E–2) 7.5322E+1 (3.8E–2) 3.6603E+0 (3.5E–4)† 3.3261E+0 (1.1E–3)† 4.8136E+0 (3.7E–4)† 3.6543E+0 (5.4E–3) 3.0234E+0 (4.7E–3)† 8.6995E+0 (6.5E–1)† 1.0957E+1 (4.1E–1)
WFG3 WFG4 WFG5 WFG6 WFG7 WFG8 WFG9 BEL BINH OSY2 TNK SRIN
TABLE VI SPEA2+SBS. A BETTER SPEA2 1.0943E+1 (4.2E–3) 8.6725E+0 (4.5E–3) 8.1666E+0 (3.2E–2) 8.4632E+0 (1.9E–1) 8.6758E+0 (4.1E–3) 7.0194E+0 (4.4E–1) 8.4399E+0 (1.8E–2) 7.0464E+1 (6.1E–3) 8.2314E+3 (2.4E+0) 1.2319E+4 (2.5E+2) 3.2236E+0 (3.8E–4) 2.5832E+4 (7.9E+0)
MEAN FOR EACH CASE IS HIGHLIGHTED IN BOLDFACE
SPEA2+SBS
Problem †
ConstrEx VNT1 VNT2 VNT3 VNT4 DTLZ1 DTLZ2 DTLZ3 DTLZ4 DTLZ5 DTLZ6 DTLZ7
1.0938E+1 (2.3E–3) 8.6676E+0 (5.8E–3)† 8.2676E+0 (7.9E–2)† 8.6516E+0 (7.6E–2)† 8.6734E+0 (1.7E–3)† 6.9500E+0 (4.1E–1) 8.4464E+0 (2.1E–2)† 7.0415E+1 (1.4E–2)† 8.2394E+3 (1.8E+0)† 1.2321E+4 (2.9E+2) 3.2239E+0 (2.7E–4)† 2.5840E+4 (5.1E+0)†
SPEA2
SPEA2+SBS
1.3403E+1 (1.3E–3) 6.1585E+1 (3.3E–2) 1.9143E+0 (4.9E–4) 2.8298E+1 (8.5E–3) 8.9791E+1 (9.2E–2) 9.7239E–1 (7.9E–4) 7.3936E+0 (6.3E–3) 2.5928E+0 (3.0E+0) 7.1064E+0 (4.5E–1) 6.1010E+0 (6.9E–4) 4.1246E+0 (2.2E–1) 1.3331E+1 (1.7E–2)
1.3404E+1 (1.5E–3) 6.1584E+1 (4.1E–2) 1.9149E+0 (3.3E–4)† 2.8304E+1 (9.1E–3)† 8.9861E+1 (7.7E–2)† 9.7150E–1 (4.0E–4)† 7.3864E+0 (6.0E–3)† 2.7554E+0 (2.8E+0) 7.1828E+0 (3.5E–1) 6.1003E+0 (4.9E–4)† 6.1014E+0 (7.2E–4)† 1.3369E+1 (2.0E–2)†
“†” indicates that the p-value of 58 degrees of freedom is significant at a 0.05 level of significance by a two-tailed t-test.
IGD
COMPARISON ( MEAN AND
Problem SCH FON1 FON2 KUR POL ZDT1 ZDT2 ZDT3 ZDT4 ZDT6 WFG1 WFG2
SMS-EMOA 1.9287E–2 (3.0E–4) 6.3745E–3 (5.5E–5) 4.2505E–3 (2.6E–4) 3.3400E–2 (6.1E–4) 5.2512E–3 (1.2E–5) 3.7291E–3 (1.6E–5) 4.5852E–3 (5.6E–5) 4.3742E–3 (1.9E–5) 4.3821E–3 (3.2E–4) 4.9154E–3 (2.8E–4) 4.2024E–1 (2.1E–1) 1.1878E–2 (1.8E–3)
SD)
OF
SMS-EMOA
AND
SMS-EMOA+SBS Problem 1.9263E–2 (4.1E–4) 6.3567E–3 (3.4E–5)† 4.3505E–3 (2.4E–4) 3.3426E–2 (4.1E–4) 5.2321E–3 (1.0E–5)† 3.7474E–3 (1.6E–5)† 4.5214E–3 (6.4E–5)† 4.3763E–3 (2.2E–5) 4.7301E–3 (8.6E–4) 4.6238E–3 (2.1E–4)† 1.4032E–1 (6.1E–2)† 1.0235E–2 (2.3E–4)†
WFG3 WFG4 WFG5 WFG6 WFG7 WFG8 WFG9 BEL BINH OSY2 TNK SRIN
TABLE VII SMS-EMOA+SBS. A BETTER MEAN FOR EACH CASE IS HIGHLIGHTED SMS-EMOA 1.1744E–2 (1.6E–4) 1.0243E–2 (1.7E–4) 6.6545E–2 (2.9E–5) 2.5436E–2 (9.5E–3) 1.2079E–2 (1.1E–4) 1.7709E–1 (4.2E–2) 1.2280E–2 (1.4E–4) 3.6738E–2 (9.9E–5) 5.8661E+0 (5.6E–3) 2.1710E+0 (7.3E–1) 3.4116E–3 (1.3E–4) 7.9115E–1 (1.1E–2)
SMS-EMOA+SBS †
1.1871E–2 (1.6E–4) 1.0196E–2 (5.5E–5) 5.1006E–2 (9.9E–4)† 1.2295E–2 (1.4E–4)† 1.2229E–2 (1.5E–4)† 1.7062E–1 (1.4E–2) 1.2142E–2 (1.2E–4)† 3.7250E+0 (9.3E–5)† 5.8607E+0 (2.0E–3)† 2.3157E+0 (1.1E+0) 2.9221E–3 (1.1E–4)† 8.0513E–1 (5.7E–3)†
IN BOLDFACE
Problem
SMS-EMOA
SMS-EMOA+SBS
ConstrEx VNT1 VNT2 VNT3 VNT4 DTLZ1 DTLZ2 DTLZ3 DTLZ4 DTLZ5 DTLZ6 DTLZ7
1.5830E–2 (1.4E–4) 2.3232E–1 (3.2E–3) 1.6234E–2 (2.4E–4) 4.0002E–1 (1.1E–2) 2.3710E–1 (2.7E–3) 1.9725E–2 (1.4E–4) 7.3870E–2 (1.0E–3) 1.9231E+0 (1.2E+0) 7.3758E–2 (9.8E–4) 4.9638E–3 (2.7E–4) 1.7904E–2 (5.7E–3) 1.6411E–1 (7.1E–3)
1.5679E–2 (9.1E–5)† 2.3667E–3 (5.4E–3)† 1.5960E–2 (2.7E–4)† 3.7158E–1 (2.8E–2)† 2.3530E–1 (3.9E–3) 1.9846E–2 (1.7E–4)† 7.3880E–2 (6.0E–4) 1.9121E+0 (1.6E+0) 7.4315E–2 (1.8E–3) 5.3310E–3 (2.1E–4)† 4.9430E–3 (4.0E–4)† 1.5950E–1 (5.0E–3)†
“†” indicates that the p-value of 58 degrees of freedom is significant at a 0.05 level of significance by a two-tailed t-test.
HV Problem SCH FON1 FON2 KUR POL ZDT1 ZDT2 ZDT3 ZDT4 ZDT6 WFG1 WFG2
COMPARISON ( MEAN AND
SMS-EMOA 2.2281E+1 (2.0E–4) 3.0631E+0 (5.1E–5) 3.3374E+0 (2.7E–5) 3.7133E+1 (3.2E–3) 7.5412E+1 (1.5E–3) 3.6616E+0 (6.0E–5) 3.3279E+0 (1.5E–4) 4.8151E+0 (9.1E–5) 3.6575E+0 (1.6E–3) 3.0305E+0 (1.8E–3) 1.0114E+1 (1.0E+0) 1.1121E+1 (4.1E–1)
SD)
OF
SMS-EMOA
SMS-EMOA+SBS †
2.2280E+1 (9.8E–5) 3.0632E+0 (2.3E–5)† 3.3375E+0 (4.9E–5) 3.7129E+1 (1.9E–3)† 7.5428E+1 (1.2E–3)† 3.6615E+0 (6.1E–5)† 3.3280E+0 (2.1E–4) 4.8150E+0 (1.6E–4) 3.6564E+0 (3.6E–3) 3.0326E+0 (1.7E–4)† 1.1288E+1 (8.9E–1)† 1.1461E+1 (1.7E–4)†
AND
Problem WFG3 WFG4 WFG5 WFG6 WFG7 WFG8 WFG9 BEL BINH OSY2 TNK SRIN
TABLE VIII SMS-EMOA+SBS. A SMS-EMOA 1.0955E+1 (9.2E–4) 8.6828E+0 (2.4E–3) 8.1588E+0 (2.5E–2) 8.5623E+0 (7.5E–2) 8.6858E+0 (2.1E–4) 7.0667E+0 (4.7E–1) 8.4575E+0 (4.2E–3) 7.0480E+1 (1.3E–3) 8.2459E+3 (1.4E–2) 1.2560E+4 (6.2E+1) 3.1383E+0 (2.7E–3) 2.5873E+4 (2.5E+0)
BETTER MEAN FOR EACH CASE IS HIGHLIGHTED IN BOLDFACE
SMS-EMOA+SBS †
1.0954E+1 (6.5E–4) 8.6812E+0 (6.2E–3) 8.2425E+0 (5.4E–2)† 8.6830E+0 (1.7E–3)† 8.6863E+0 (1.0E–4)† 7.1006E+0 (2.4E–1) 8.4610E+0 (3.5E–3)† 7.0462E+1 (3.1E–3)† 8.2466E+3 (5.0E–2)† 1.2537E+4 (1.1E+2) 3.1419E+0 (1.7E–3)† 2.5872E+4 (1.1E+0)
“†” indicates that the p-value of 58 degrees of freedom is significant at a 0.05 level of significance by a two-tailed t-test.
Problem
SMS-EMOA
ConstrEx VNT1 VNT2 VNT3 VNT4 DTLZ1 DTLZ2 DTLZ3 DTLZ4 DTLZ5 DTLZ6
1.3410E+1 (2.4E–4) 6.1307E+1 (1.4E–2) 1.9183E+0 (4.0E–5) 2.8384E+1 (1.9E–3) 8.9927E+1 (1.1E–2) 9.7361E–1 (3.0E–4) 7.4258E+0 (7.1E–5) 1.1308E+0 (2.8E+0) 7.4260E+0 (9.6E–5) 6.1040E+0 (2.4E–5) 6.0725E+0 (4.1E–4)
DTLZ7
SMS-EMOA+SBS
1.3411E+1 (2.9E–4)† 6.1277E+1 (3.2E–2)† 1.9184E+0 (1.9E–5)† 2.8385E+1 (3.5E–4)† 8.9961E+1 (3.0E–2)† 9.7370E–1 (9.2E–5) 7.4250E+0 (1.2E–4)† 1.3579E+0 (2.7E+0) 7.4257E+0 (1.6E–4)† 6.1036E+0 (8.8E–5)† 6.1038E+0 (4.4E–5)† 1.3427E+1 (8.2E–3) 1.3438E+1 (7.7E–3)†
10
6
5
NSGA-II
SPEA2 SPEA2+SBS
NSGA-II+SBS
5
4
4
3
f2
HV
3 2 1
2
1
0
0
0
5000
10000
15000
20000
25000
30000
Evaluations
0.0
0.5
1.0
1.5
2.0
2.5
f1
Fig. 6. Evolutionary trajectories of HV obtained by NSGA-II and NSGAII+SBS on DTLZ6.
Fig. 8. 50% attainment surfaces over 30 runs of SPEA2 and SPEA2+SBS on WFG6.
10 NSGA-II NSGA-II+SBS
8
HV
6 4 2 0
0
5000
10000
15000
20000
25000
Evaluations Fig. 7. Evolutionary trajectories of HV obtained by NSGA-II and NSGAII+SBS on WFG1.
problems in terms of IGD and HV, respectively. Also, the difference of the two algorithms on most of the problems has statistical significance. Specifically, the proportion of the problems where SPEA2+SBS outperforms SPEA2 with statistical significance is 16/26 and 18/25 instances regarding IGD and HV, respectively. Additionally, the performance improvement is noticeable for some cases, e.g., WFG5 and WFG6. Figure 8 plots the 50% attainment surfaces across the 30 runs of SPEA2 and SPEA2+SBS on WFG6. Clearly, the median attainment surface of SPEA2+SBS has a larger dominated space than that of SPEA2. In fact, the median attainment surface of SPEA2+SBS already approximates the Pareto front of the problem, which means that the final solutions obtained by SPEA2+SBS can statistically achieve a good balance between convergence and diversity. Tables VII and VIII show the comparative results between SMS-EMOA and SMS-EMOA+SBS. Although the advantage of SMS-EMOA+SBS over SMS-EMOA seems to be not as clear as that of NSGA-II+SBS over NSGA-II and of SPEA2+SBS over SPEA2, the proposed operator can improve SMS-EMOA for the majority of the problems. Specifically, SMS-EMOA+SBS outperforms SMS-EMOA in 21 and 22 out of the 36 test problems regarding IGD and HV, respectively. Also, for most of the problems on which SMS-EMOA+SBS performs better, the results have statistical significance (16 out of the 21 problems for IGD and 17 out of the 22 problems for HV). In contrast, the number of problems where SMS-EMOA outperforms SMS-EMOA+SBS with statistical significance is 8 and 9 in terms of IGD and HV, respectively. It is important to note that the influence of SBS is different for different kinds of test problems. Integrated by the proposed
operator, NSGA-II and SPEA2 achieve a clear improvement for most of the ZDT and DTLZ problems. For the WFG family, the proposed operator works well on some problems where the algorithm fails to approach the Pareto front, such as WFG1, WFG5, and WFG6, but performs poorly on some relatively easy problems, such as WFG3 and WFG4. The UF and CF family [62] is also a set of popular test problems, which emphasize the complexity of the shape of the Pareto set. In some preliminary experiments, we observed that for the UF and CF problem family, the performance of the tested algorithms (i.e., NSGA-II, SPEA2, and SMS-EMOA) has not a clear improvement when integrated with the proposed SBS operator. This may mean that SBS is not well suited for MOPs with the Pareto set having such complex shape in the decision space. Result summary—From the three groups of experiments on 36 benchmark functions, the algorithms with the integration of the SBS operator show a clear improvement. For most of the test problems, a better balance between convergence and diversity can be achieved when SBS is integrated into the algorithms. B. Effect of Dimensionality The experimental results in the previous section have shown that the SBS operator can improve the performance of EMO algorithms. Next, we study the influence of parameter setting on the performance of algorithms. Due to space limitation, we only consider the implementation of SBS into NSGA-II and present the HV results of NSGA-II and NSGA-II+SBS in this and the following sections. Similar results can also be observed for the other algorithms. This section investigates the effect of problem dimensionality (i.e., the number of decision variables) on the performance of NSGA-II+SBS. The same experiments are repeated for D = 2Ddef ault on each scalable function from our test set. All other control parameters are kept unchanged. Table IX gives the results on all 21 scalable functions. Note that for some problems, the HV value of the obtained solution set may be equal to zero, which means that no solutions in the set can converge into the area determined by the reference point. In the case, the assessment result fails to indicate the performance difference between algorithms. To solve this issue, we reset the reference point for these problems (marked by ∗ in the table) by specifying the integer point slightly larger than the
11
HV
COMPARISON ( MEAN AND
SD)
OF
NSGA-II
AND
TABLE IX NSGA-II+SBS (D = 2Ddef ault ),
WHERE A BETTER MEAN FOR EACH CASE IS HIGHLIGHTED IN
BOLDFACE
Problem ZDT1 ZDT2 ZDT3 ZDT4 ZDT6 WFG1 WFG2
NSGA-II 3.6586E+0 3.3240E+0 4.8125E+0 3.6552E+0 3.0148E+0 6.7358E+0 1.0933E+1
(4.9E–4) (7.1E–4) (6.4E–4) (4.6E–3) (5.1E–3) (5.9E–1) (4.0E–1)
NSGA-II+SBS 3.6594E+0 3.3252E+0 4.8137E+0 3.6553E+0 3.0184E+0 7.8103E+0 1.1031E+1
Problem †
WFG3 WFG4 WFG5 WFG6 WFG7 WFG8 WFG9
(3.0E–4) (5.6E–4)† (3.8E–4)† (4.9E–2) (5.2E–3)† (3.5E–1)† (4.1E–1)
NSGA-II
NSGA-II+SBS
Problem †
1.0905E+1 (1.0E–2) 8.6447E+0 (6.9E–3) 8.1637E+0 (3.2E–2) 8.1810E+0 (1.5E–1) 8.6570E+0 (4.5E–3) 7.5864E+0 (2.0E–2) 8.2924E+0 (3.2E–1)
1.0911E+1 (6.4E–3) 8.6434E+0 (7.0E–3)† 8.1633E+0 (3.7E–2) 8.2191E+0 (1.6E–1)† 8.6564E+0 (3.6E–3) 7.5944E+0 (3.1E–2) 8.3648E+0 (1.9E–1)†
DTLZ1 DTLZ2 DTLZ3∗ DTLZ4 DTLZ5 DTLZ6∗ DTLZ7
NSGA-II 4.6842E–3 (2.5E–2) 7.33448+0 (2.0E–2) 6.8115E+4 (3.3E+4) 7.3752E+0 (5.8E–3) 6.0982E+0 (8.2E–4) 5.5470E+2 (1.9E+1) 1.3021E+1 (6.8E–2)
NSGA-II+SBS 2.6878E–1 (1.0E–1) 7.3553E+0 (7.6E–3)† 6.1974E+4 (3.9E+4) 7.3801E+0 (3.9E–3)† 6.0965E+0 (8.9E–4)† 6.9972E+2 (1.4E+1)† 1.3093E+1 (6.5E–2)†
“†” indicates that the p-value of 58 degrees of freedom is significant at a 0.05 level of significance by a two-tailed t-test.
HV
COMPARISON ( MEAN AND
SD)
OF
NSGA-II
TABLE X NSGA-II+SBS (D = 100),
AND
WHERE A BETTER MEAN FOR EACH CASE IS HIGHLIGHTED IN
BOLDFACE
Problem ZDT1 ZDT2 ZDT3 ZDT4 ZDT6 WFG1 WFG2
NSGA-II 3.6577E+0 (6.2E–4) 3.3226E+0 (1.5E–3) 4.8116E+0 (7.3E–4) 3.4870E+0 (2.4E–1) 2.9420E+0 (1.8E–2) 4.5436E+0 (1.4E–1) 1.0354E+1 (3.4E–1)
NSGA-II+SBS
Problem
3.6591E+0 (3.8E–4)† 3.3245E+0 (9.5E–4)† 4.8136E+0 (3.8E–4)† 3.1147E+0 (4.8E–1) 2.9471E+0 (2.5E–2) 5.7511E+0 (2.5E–2)† 1.0654E+1 (3.5E–1)
WFG3 WFG4 WFG5 WFG6 WFG7 WFG8 WFG9
NSGA-II
NSGA-II+SBS
Problem
1.0544E+1 (3.6E–2)† 8.4023E+0 (3.1E–2) 8.0960E+0 (3.7E–2)† 8.2147E+0 (2.9E–2)† 8.4682E+0 (1.3E–2) 7.8989E+0 (3.7E–2)† 8.1249E+0 (7.7E–2)
1.0165E+1 (5.9E–2) 8.3931E+0 (3.3E–2) 8.0309E+0 (3.0E–2) 8.2846E+0 (1.9E–2) 8.4778E+0 (1.4E–2) 7.8517E+0 (3.7E–2) 8.0918E+0 (2.6E–2)
DTLZ1∗ DTLZ2 DTLZ3∗ DTLZ4 DTLZ5 DTLZ6∗ DTLZ7
NSGA-II 3.9811E+6 7.2409E+0 7.2811E+6 7.2843E+0 6.0366E+0 1.0314E+5 1.0995E+1
(4.4E+7) (2.4E–2) (9.5E+6) (2.1E–2) (7.8E–3) (6.2E+3) (4.0E–1)
NSGA-II+SBS 1.3380E+7 7.2691E+0 1.7148E+7 7.3014E+0 6.0617E+0 2.3337E+5 1.2949E+1
(1.5E+7)† (1.2E–2)† (3.2E+7) (1.2E–2)† (5.1E–2)† (5.0E+3)† (8.2E–2)†
“†” indicates that the p-value of 58 degrees of freedom is significant at a 0.05 level of significance by a two-tailed t-test.
HV
COMPARISON ( MEAN AND
SD)
OF
NSGA-II
AND
TABLE XI NSGA-II+SBS (D = 1000),
WHERE A BETTER MEAN FOR EACH CASE IS HIGHLIGHTED IN
BOLDFACE
Problem ZDT1 ZDT2 ZDT3 ZDT4∗ ZDT6 WFG1 WFG2
NSGA-II 3.6031E+0 (3.0E–2) 3.1173E+0 (2.8E–1) 4.7260E+0 (4.0E–2) 8.6472E+0 (4.1E+0) 1.0507E+0 (5.5E–1) 3.8342E+0 (1.7E–1) 9.0073E+1 (2.8E–1)
NSGA-II+SBS 3.5960E+0 (2.6E–2) 3.1773E+0 (7.9E–2) 4.7484E+0 (3.2E–2)† 7.3600E+0 (4.6E+0) 9.7416E–1 (4.8E–1) 5.3382E+0 (1.5E–2)† 9.1212E+1 (3.5E–1)
Problem WFG3 WFG4 WFG5 WFG6 WFG7 WFG8 WFG9
NSGA-II 8.7136E+0 7.4829E+0 6.6600E+0 6.3660E+0 6.9965E+0 6.9446E+0 6.4806E+0
NSGA-II+SBS
(5.7E–2) (3.2E–2) (6.8E–2) (4.5E–2) (3.3E–2) (1.7E–2) (2.8E–2)
9.4514E+0 7.8254E+0 7.7248E+0 6.8757E+0 7.3645E+0 7.2084E+0 7.2263E+0
Problem †
(8.9E–2) (3.0E–2)† (1.0E–1)† (2.5E–1)† (9.4E–2)† (6.7E–3)† (1.1E–1)†
DTLZ1∗
DTLZ2∗ DTLZ3∗ DTLZ4∗ DTLZ5∗ DTLZ6∗ DTLZ7∗
NSGA-II 7.8798E+11 (1.4E+11) 4.2205E+3 (4.6E+2) 3.7336E+12 (1.4E+12) 3.7630E+3 (8.6E+2) 3.7873E+3 (6.4E+2) 2.3940E+8 (5.2E+6) 1.2027E+1 (6.6E–1)
NSGA-II+SBS 1.1384E+12 (1.2E+12) 7.4266E+3 (2.7E+2)† 4.5307E+13 (2.0E+12)† 7.1455E+3 (4.0E+2)† 7.1343E+3 (2.8E+2)† 6.0119E+8 (6.6E+6)† 2.8153E+1 (1.6E+0)†
“†” indicates that the p-value of 58 degrees of freedom is significant at a 0.05 level of significance by a two-tailed t-test.
extreme value of each objective of a mixed set that consists of the final solutions obtained by all algorithms across all runs on a particular problem. As can be seen from the table, NSGA-II+SBS outperforms NSGA-II in 16 out of the 21 problems, yet the latter obtains a better value only on 5 problems. Also, the difference on most of the test problems where NSGA-II+SBS performs better than NSGA-II has statistical significance (12 out of the 16 problems), whereas only for WFG4 and DTLZ5, NSGA-II outperforms NSGA-II+SBS with statistical significance. On the other hand, it is clear that as the number of decision variables increases, both algorithms perform worse on all functions except on WFG8, where, interestingly, higher dimensionality seems to be more suitable. In addition, by a comparative observation in Tables IV and IX, it can be found that the advantage of NSGA-II over NSGA-II+SBS varies with the increase of problem dimensionality on some test problems. For problems WFG3 and DTLZ7 where NSGA-II outperforms NSGA-II+SBS under the default settings, NSGAII+SBS achieves a better result when D = 2Ddef ault . In real-world scenarios, it is not uncommon to face a problem with hundreds of decision variables. To verify the efficiency of SBS for the problems with a high dimensionality,
we compare the performance between the two algorithms on all problems with dimensions 100 and 1,000, as shown in Tables X and XI, respectively. Interestingly, from the tables the advantage of NSGA-II+SBS over NSGA-II becomes clearer when a high number of decision variables are involved. For both D = 100 and D = 1000, NSGA-II+SBS performs better than NSGA-II in 18 out of the 21 problems. Also, for most of the problems on which NSGA-II+SBS outperforms its competitor, the results have statistical significance (14 out of the 18 problems when D = 100 and 15 out of the 18 problems when D = 1000). In addition, the investigation of problem dimensionality in the objective space is also an important issue, which we leave for future study. In this context, we plan to apply SBS to some recent evolutionary many-objective optimization algorithms, such as GrEA [61] and SPEA2+SDE [33], and test the performance of the proposed operator in a highdimensional objective space. Result summary—While the algorithm integrated with the SBS operator obtains a lower HV value on most of the scalable functions with the increase of dimensionality, it still maintains stable advantage over its original version. Moreover, the advantage becomes clearer when the problem
12
TABLE XII E FFECT OF BRS. F OR EACH PROBLEM , THE LEFT HV VALUE ( MEAN AND SD) IS OBTAINED BY NSGA-II+SBS WITHOUT BRS, AND THE RIGHT ONE BY NSGA-II+SBS WITH BRS ( I . E ., THE ORIGINAL NSGA-II+SBS). A BETTER MEAN FOR EACH CASE IS HIGHLIGHTED IN BOLDFACE Problem SCH FON1 FON2 KUR POL ZDT1 ZDT2 ZDT3 ZDT4 ZDT6 WFG1 WFG2
NSGA-II+SBS (Without BRS)
NSGA-II+SBS (With BRS)
Problem
NSGA-II+SBS (Without BRS)
NSGA-II+SBS (With BRS)
Problem
NSGA-II+SBS (Without BRS)
NSGA-II+SBS (With BRS)
2.2264E+1 (4.2E–3) 3.0620E+0 (2.0E–4) 3.3357E+0 (4.3E–4) 3.7011E+1 (1.8E–2) 7.5287E+1 (4.9E–2) 3.6587E+0 (4.0E–4) 3.3245E+0 (5.5E–4) 4.8005E+0 (6.6E–2) 3.6554E+0 (3.2E–3) 3.0180E+0 (3.2E–3) 8.7538E+0 (8.7E–1) 1.1039E+1 (4.2E–1)
2.2263E+1 (5.6E–3) 3.0620E+0 (2.0E–4) 3.3358E+0 (2.8E–4) 3.7013E+1 (1.7E–2) 7.5278E+1 (6.9E–2) 3.6595E+0 (3.5E–4)† 3.3255E+0 (5.3E–4)† 4.8138E+0 (2.1E–4)† 3.6579E+0 (2.1E–3)† 3.0238E+0 (3.6E–3)† 9.2293E+0 (5.1E–1)† 1.1068E+1 (4.2E–1)
WFG3 WFG4 WFG5 WFG6 WFG7 WFG8 WFG9 BEL BINH OSY2 TNK SRIN
1.0926E+1 (4.4E–3) 8.6628E+0 (3.4E–3) 8.2288E+0 (6.7E–2) 8.6556E+0 (5.0E–3) 8.6611E+0 (5.2E–3) 6.9476E+0 (4.0E–1) 8.4408E+0 (2.3E–2) 7.0286E+1 (2.8E–2) 8.2375E+3 (2.0E+0) 1.2352E+4 (6.1E+2) 3.2232E+0 (2.0E–4) 2.5775E+4 (2.1E+1)
1.0927E+1 (3.9E–3) 8.6611E+0 (7.5E–3) 8.2788E+0 (6.8E–2)† 8.6586E+0 (4.6E–3)† 8.6659E+0 (2.6E–3)† 7.1459E+0 (5.3E–1) 8.4380E+0 (9.6E–3) 7.0285E+1 (4.0E–2) 8.2380E+3 (2.0E+0) 1.2541E+4 (2.0E+2)† 3.2231E+0 (2.7E–4)† 2.5770E+4 (1.9E+1)
ConstrEx VNT1 VNT2 VNT3 VNT4 DTLZ1 DTLZ2 DTLZ3 DTLZ4 DTLZ5 DTLZ6 DTLZ7
1.3398E+1 (1.6E–3) 6.1051E+1 (1.2E–1) 1.9056E+0 (2.8E–3) 2.8357E+1 (3.5E–3) 8.9162E+1 (2.4E–1) 9.5216E–1 (2.4E–2) 7.3541E+0 (1.0E–2) 1.0315E+0 (2.1E+0) 7.3858E+0 (4.1E–3) 6.0984E+0 (9.0E–4) 5.4404E+0 (1.7E–1) 1.3137E+1 (8.3E–2)
1.3399E+1 (1.5E–3)† 6.1052E+1 (1.3E–1) 1.9062E+0 (2.0E–3) 2.8359E+1 (4.3E–3) 8.9139E+1 (2.1E–1) 9.6833E–1 (2.4E–3)† 7.3621E+0 (1.3E–2)† 1.3467E+0 (2.0E+0) 7.3853E+0 (5.1E–3) 6.0983E+0 (6.6E–4) 6.0904E+0 (2.1E–2)† 1.3201E+1 (4.9E–2)†
“†” indicates that the p-value of 58 degrees of freedom is significant at a 0.05 level of significance by a two-tailed t-test.
10.0
dimensionality increases, with NSGA-II+SBS outperforming NSGA-II on around 85% of all the problems when D = 100 and D = 1000.
WFG1 WFG2 WFG8
9.6
HV
9.2
C. Effect of the Boundary Relaxation Strategy In this section, we investigate the effect of the boundary relaxation strategy (BRS) in SBS by 1) implementing SBS without BRS and 2) expanding the boundary in BRS. For this purpose, all parts of the proposed SBS operator are kept untouched except that the boundary is adjusted. First, considering the SBS without BRS, Eqs. (2) and (3) will be changed into lb = min(P ) and ub = max(P ), respectively, and there will be L, instead of (L + 2), segments to be considered in each dimension (L is set to N , i.e., the population size). Table XII gives the HV values of NSGA-II+SBS without BRS on all the 36 test problems, and the results of NSGAII+SBS from Table IV are also repeated in this table to ease the comparison between them. Clearly, the algorithm without BRS performs significantly worse than the original NSGA-II+SBS. The former outperforms the latter in 10 out of the 36 problems, and with statistical significance for only one problem (TNK). On the other hand, NSGA-II+SBS with BRS achieves a better HV value in 25 out of the 36 problems, and with statistical significance for more than half of these problems (15 of the 25 problems). In addition, on the problem FON1, both algorithms have an equal result regarding the mean and SD values. Next, we test the effect of the boundary relaxation degree in SBS to the algorithm’s performance. Specifically, the upper and low boundaries are expanded to lb = min(P ) − k|S| and ub = max(P ) + k|S|, respectively, where k is set to 2, 3, 5, and 10. Therefore, there are L + 2k segments to be considered in each dimension. Interestingly, we observe that the effect of the boundary relaxation degree is different for different problems. Here, we demonstrate the results of NSGA-II+SBS on three WFG test problems, WFG1, WFG2, and WFG8. Figure 9 plots the HV curve of the algorithm with different degrees of boundary relaxation in SBS. Clearly, the optimal setting of k is varying, with k = 5, k = 10, and k = 1 for WFG1, WFG2, WFG8, respectively. This means
8.8
8.4
8.0
1
2
3
4
5
6
7
8
9
10
k
Fig. 9. HV comparison of NSGA-II+SBS with different degrees of boundary relaxation in SBS on WFG1, WFG2, and WFG8. The HV value of WFG2 and WFG8 is modified by adding or subtracting a constant in order to integrate them into one figure clearly (i.e., HVWFG2 = HVWFG2 − 1.6 and HVWFG8 = HVWFG8 + 1.9).
that a good tradeoff between extensive exploration and local exploitation is distinct for different problems. Result summary—After eliminating the BRS in SBS, the HV value of the algorithm drops on 25 problems, and has a slight improvement on only 10 problems. This clearly demonstrates that BRS is useful to enhance the search ability in multiobjective optimization. However, the optimal setting of the boundary relaxation degree is varying for different problems. Adaptive setting according to the evolutionary information may be a promising direction in the future study. D. Effects of the SBS Rate (SR) and Micro-jumping Proportion (M iP ) In SBS, two probability parameters, SR and M iP , are introduced to control the rate of the SBS variation and the proportion of micro-jumping versus macro-jumping, respectively. Although both parameters were fixed for all experiments, the performance of SBS can vary with their different settings. In this section, we investigate the effects of SR and M iP , and try to provide a proper value (or range) of them for users. Here, a representative function set, the WFG problem family, is selected for demonstration. To study the sensitivity of SBS to SR and M iP , we repeat the experiments conducted in Section IV-A
13
10 .0
10 .9 6 10 .9 5
9. 5
HV
10 .9 1
9. 0
NSGA-II (10.933)
10 .9 3 10 .9 2
8. 5
NSGA-II (8.225)
10 .9 0
.0 1 .9 0 .8 0 .7 0 .6 0
.5 0 .4 0
.1 0 .0 0
Mi
8. 0 1 0 .0 0 .9 . 8 0 . 7 0 0 .6 .5 0 .4 0 .3 0 .2 0 .1 0 .0
.0 1 .9 0 .8 0 .7 0 .6 0
1 0 .0 0 .9 0 .8 . 7 0 .6 0 .5 0 .4 0 .3 0 .2 0 .1 0 .0
.5 0 .4 0
P
SR
SR
.3 0 .2 0
Mi
.3 0 .2 0
.1 0 .0 0
(a) WFG1
P
(b) WFG3
HV of NSGA-II+SBS with 121 different combinations of SR and M iP on WFG1 and WFG3.
Fig. 10. WFG1
WFG3
WFG5
WFG2
WFG6
WFG4
8.7
WFG3 WFG4
HV
10 .9 4
WFG7 (8.6704)
WFG7 11
WFG2 (10.978)
WFG5
WFG9
WFG4 (8.6685)
8.668
8.6
WFG6
WFG6 (8.5565)
WFG7 WFG8
10
8.664
8.5
WFG3 (8.6630)
9
WFG1 (8.225)
8
HV
HV
HV
WFG9
8.4
8.660
8.3
8.656
8.2
WFG8 (7.098)
7
WFG5 (8.1585)
8.652
WFG9 (8.6503)
8.1
0.0
0.1
0.2
0.3
0.4
0.5
0.6
0.7
0.8
0.9
SR
(a) All WFG Problems Fig. 11.
1.0
0.0
0.1
0.2
0.3
0.4
0.5
0.6
0.7
0.8
0.9
1.0
0.0
0.1
0.2
0.3
0.4
0.5
0.6
0.7
0.8
0.9
1.0
SR
SR
(b) WFG5 and WFG6
(c) WFG3, WFG4, WFG7 and WFG9
HV of NSGA-II+SBS with different settings of SR on the WFG problem family. The results of NSGA-II are shown on the right of the figure.
for SR, M iP ∈ [0, 1] using a step size of 0.1 (i.e., 30 trials per function for each combination of SR, M iP ∈ {0.0, 0.1, 0.2, 0.3, 0.4, 0.5, 0.6, 0.7, 0.8, 0.9, 1.0}). Due to space limitation, we do not show the results for all WFG problems. Instead, we show only the results for two representative functions WFG1 and WFG3 with respect to the 121 different combinations of SR and M iP in Fig. 10. Moreover, for comparison, we also show the HV value obtained by the original NSGA-II in the figure. It is clear from Fig. 10 that the performance of NSGAII+SBS varies drastically with SR and M iP . For WFG1, NSGA-II+SBS works well when both SR and M iP are around 0.5, and interestingly, NSGA-II+SBS with any settings of the two parameters significantly outperforms the original NSGA-II (the worst HV value of NSGA-II+SBS in the 121 combinations is 8.7250, which is larger than the HV value 8.2253 of NSGA-II). For WFG3, a better HV can be obtained by the algorithm when working with a lower SR or a higher M iP value. The best and worst HV values of NSGA-II+SBS in the 121 combinations are 10.9376 and 10.9127, respectively. And the HV value for NSGA-II is 10.9333, which is higher than most of the results obtained by NSGA-II+SBS under different combinations of the parameters. In the following, we separately investigate the two parameters, trying to give a proper setting of them for users. First, we consider the parameter SR. We repeat the experiments conducted in Section IV-A for SR ∈ [0, 1] with a step size of 0.1. All other control parameters are kept unchanged. Figure 11(a) gives the results of NSGA-II+SBS with different settings of SR on the WFG problem family, and the results of
NSGA-II are also shown for comparison. Note that SR = 0 does not mean that SBS is not performed, but rather it means that only one dimension of the decision space is selected to vary (i.e., j = jrand from Step 15 in Algorithm 2). It is clear from the figure that the variation degree of performance has an apparent distinction on different problems with respect to different settings of the parameter. For some problems, such as WFG1, WFG2, and WFG8, the HV value varies with different settings of SR; but for some other problems, such as WFG3, WFG4, WFG7, and WFG9, the HV value appears to be relatively invariant. This occurrence is due to the difference of the performance of NSGA-II on the WFG problems. For WFG1, WFG2, and WFG8, the solutions obtained by NSGAII are far from the Pareto front. A clear improvement of the HV result can be achieved when setting SR and M iP properly in SBS. For WFG3, WFG4, WFG7, and WFG9, the solutions of NSGA-II are already quite close to the Pareto front. So whatever setting for SR and M iP , the degree of change of the HV result is relatively inapparent, compared with that on WFG1, WFG2, and WFG8. In order to investigate the effect of SR on all the WFG problems more clearly, we show the HV value with finer scales for some problems where it is difficult to identify in Fig. 11(a). The results of WFG5 and WFG6 are given in Fig. 11(b). The results of WFG3, WFG4, WFG7, and WFG9 are plotted in Fig. 11(c), where the HV value of WFG3 and WFG9 is modified by adding or subtracting a constant to integrate them into one figure as follows: HVWFG3 = HVWFG3 − 2.27 and HVWFG9 = HVWFG9 + 0.22. It is clear from the figure that the WFG problems can
14
1.0 50
0.8
0.6
30
0.4
20
Probability
Solution Number
40
0.2
10
0.0
0 0
5000
10000
15000
20000
25000
Evaluations
Fig. 12. Probability that a solution generated by SBS has been inserted into the population during the evolutionary process across the 30 runs of NSGAII+SBS on WFG3 when SR = 0 (denoted by dashed line). Black square denotes the average number of solutions generated by SBS, and hollow circle denotes the average number of solutions inserted into the population.
generally be divided into three categories according to the trend of their HV trajectories. The first category corresponds to the problems where the HV trajectory rises with SR, including WFG2 and WFG5. The second category contains WFG3 and WFG4, where the trajectory falls with the growth of the parameter. The remaining problems are the last category in which HV reaches the best when SR takes some middle values. This indicates that a rare occurrence of the SBS variation is suitable for WFG3 and WFG4, and a frequent one is more acceptable for WFG2 and WFG5. In fact, given that both algorithms (NSGA-II+SBS and NSGA-II) perform fairly well on WFG3 and WFG4 but have difficulties in obtaining a well-converged and well-distributed solution set on WFG2 and WFG5, a low SR value may be advisable for some relatively simple functions while a high SR value seems more useful for intractable problems. In addition, for an unknown optimization problem, the interval [0.4, 0.6] may be more reliable since the HV of the algorithm with SR set in this interval is acceptable on most test problems, as shown in Fig. 11. In order to further understand the effect of SR, Figure 12 shows the “success rate” of individuals generated by SBS that have been inserted into the population during the evolutionary process on WFG3 when SR = 0. Clearly, from 5000 evaluations, there is a relatively stable number (around 20) of individuals inserted into the population, close to half of the number of individuals generated by SBS. This means that SBS can continuously generate promising solutions during the evolutionary process even when SR = 0. The other parameter M iP in SBS is to adjust the proportion of micro-jumping versus macro-jumping, with a low value corresponding to a high rate of macro-jumping. Unlike for SR where the trend of performance trajectories shows clear differences on a variety of functions, for M iP , NSGA-II+SBS obtains a similar trend of the HV trajectories on different functions. The results with different settings of M iP on the WFG problem family are shown in Fig. 13(a). Also, for a clearer observation, Fig. 13(b) shows the results on WFG5 and WFG6, and Fig. 13(c) on WFG3, WFG4, WFG7, and WFG9 (HVWFG3 = HVWFG3 − 2.22 and HVWFG9 = HVWFG9 + 0.19). As can be seen from the figure, all HV trajectories rise at the beginning and then fall when M iP approaches 1.0. Specifically, the algorithm performs best for WFG1, WFG2, and WFG8 when M iP = 0.5, 0.4, and 0.4, respectively; for
WFG5 and WFG6 when M iP = 0.5 and 0.6, respectively; and for WFG3, WFG4, WFG7, and WFG9 when M iP = 0.8, 0.6, 0.7, and 0.8, respectively. Consequently, setting M iP within the range of [0.4, 0.8] seems reliable for an unknown optimization problem. Result summary—High sensitivity of the algorithm to the parameters SR and M iP demands a proper setting of them in SBS. Our experiments suggest that the range of [0.4, 0.6] and [0.4, 0.8] may be reliable for SR and M iP , respectively, for an unknown optimization problem. And a median of them (i.e., SR = 0.5 and M iP = 0.6) may be considered as a first attempt. Furthermore, for some relatively easy problems, a lower SR is recommended, while for some difficult ones, a higher SR may be more suitable. V. C OMPARISON WITH T HREE VARIATION O PERATORS The primary purpose of our study is to introduce a variation operator to improve the performance of EMO algorithms. For a better validation, we compare SBS with three representative variation operators—opposition-based learning (OBL) [43], jumping gene (JG) [4], and M¨uhlenbein’s mutation [38]. The OBL operator proposed by Tizhoosh [53] has been found to be competitive in many fields. The main idea of OBL is the simultaneous consideration of an estimate and its corresponding opposite estimate in order to achieve a better approximation for the candidate solution in the population. Let xi be the value of an individual in the ith dimensional decision space (xi ∈ [ai , bi ], i = 1, 2, ..., D), and the opposite value of xi can be calculated as follows: x′i = ai + bi − xi
(8)
Similar to the SBS variation, OBL shrinks the search space and the concerned interval [ai , bi ] is determined by the boundary of the current evolutionary population. However, one important difference is that the place of newly-generated individuals is fixed in OBL, while in SBS newly-generated individuals jump among different segments and vary over the current search space. JG, which emulates the gene transposition in the genome, is a variation operator to improve the performance of EAs in multiobjective optimization. Inspired from the “jumping gene” phenomenon in biological evolution, the JG operator introduces two types of transpositions: 1) cut-and-paste transposition and 2) copy-and-paste transposition, to exchange information between individuals. JG can be implemented in both binary-valued and real-valued scenarios [4], [39], and the combination of JG with NSGA-II has been found to achieve a good search performance. Further details of the JG variation can be found in [4], [39]. M¨uhlenbein’s mutation is a mutation operator for realvalued problems. It is able to generate points in the hypercube with the center at a point, defined by xi ± rangei × γ, where rangei defines the mutation range and is normally set to 0.1 × (bi − ai ), the + or − sign is chosen with a probability of 0.5, and γ is defined as follows: γ=
15 ∑ k=0
αk 2−k
(9)
15
WFG1
WFG3
WFG5
WFG2
WFG6
WFG4
8.7
WFG3 WFG4
8.72
WFG7 11
WFG2 (10.978)
WFG5
WFG3 (8.7130)
WFG9 8.6
WFG6
WFG8
8.70
WFG6 (8.5565)
WFG7 10
8.5
WFG7 (8.6704)
9
HV
8.68
HV
HV
WFG9
8.4
WFG4 (8.6685) 8.66
WFG1 (8.225)
8
8.3
8.64 8.2
WFG8 (7.098)
7
0.0
0.1
0.2
0.3
0.4
0.5
0.6
0.7
0.8
0.9
MiP
(a) All WFG Problems Fig. 13.
1.0
WFG5 (8.1585) 8.1 0.0
0.1
0.2
0.3
0.4
0.5
0.6
0.7
0.8
0.9
1.0
WFG9 (8.6203)
8.62 0.0
0.1
0.2
0.3
0.4
0.5
0.6
0.7
0.8
0.9
1.0
MiP
MiP
(b) WFG5 and WFG6
(c) WFG3, WFG4, WFG7 and WFG9
HV of NSGA-II+SBS with different settings of M iP on the WFG problem family. The results of NSGA-II are shown on the right of the figure.
where αi ∈ {0, 1} is randomly generated with p(αi = 1) = 1/16. In this mutation operator, the probability parameter p(αi = 1) being set to 1/16 indicates that on the average there will be just one αi with value 1. In addition, from the settings of parameter k in Eq. (9) (i.e., k = 0, ..., 15), new generated points are located much more often in the neighborhood of xi and the minimum possible proximity can be up to a precision of rangei × 2−15 . M¨uhlenbein’s mutation is a discrete variation operator, which can be considered as searching among different parts (segments) in the concerned region [18]. However, it has two key differences from the SBS operator: 1) M¨uhlenbein’s mutation generates points more often in the neighborhood of a given point, and 2) the concerned region in M¨uhlenbein’s mutation is only a fraction of the whole search space. In addition, it is necessary to point out that despite being a general genetic operator in classical EAs [32], M¨uhlenbein’s mutation, due to its similarity to SBS, is used here as an auxiliary variation operator to be integrated into EAs to serve the purpose of comparative study. In order to ensure a fair competition between SBS and the other three operators, the OBL, JG, and M¨uhlenbein’s mutation operators adopt the evolutionary frame of SBS, and also only act on the nondominated individuals which have been eliminated by the environmental selection (i.e., Algorithm 1 remains unchanged, while Steps 2–4 and Steps 7– 24 of Algorithm 2 are replaced by the other operators). NSGAII is also considered as the test algorithm, and the new three hybrid algorithms are denoted as NSGA-II+OBL, NSGAII+JG, and NSGA-II+MM, respectively. The parameters used in the peer operators are set according to the recommendation in their original papers, and the common parameters of the four algorithms are kept unchanged. Table XIII gives the HV results of the peer operators on all the 36 test problems, where the results of NSGA-II+SBS from Table IV are also repeated in this table for the convenience of comparison. Clearly, NSGA-II+SBS considerably outperforms the other three operators, and achieves the best HV value in 18 out of the 36 problems. NSGA-II+OBL, NSGA-II+MM, and NSGA-II+JG perform the best in 3, 8, and 7 out of the 36 problems, respectively. Additionally, for the majority of problems on which NSGA-II+SBS outperforms its competitors, the results have statistical significance (25 out of 32 problems for NSGA-II+OBL, 13 out of 21 problems for NSGA-II+MM, and 19 out of 27 problems for NSGA-II+JG). In order to further understand the performance difference among these operators, we show their “success rate” during
the evolutionary process. Specifically, we show, as a function of the number of evaluations, the probability that a solution generated by SBS has been inserted into the population across the 30 runs of the four algorithms on WFG1 in Fig. 14. Clearly, the success rate of NSGA-II+SBS is higher than that of the other three algorithms, which means that SBS is more efficient to generate “good” solutions that can contribute their value in the evolutionary process. Result summary—From the above experiments, SBS has shown a clear advantage over the other three variation operators in multiobjective optimization. Hybridized with SBS, NSGA-II can achieve a better HV value than hybridized with OBL, JG, and M¨uhlenbein’s mutation on half of the tested problems. This means that SBS is a promising operator in enhancing the search ability of EMO algorithms. VI. C ONCLUSIONS This paper presented a variation operator, segment-based search (SBS), to improve the performance of EMO algorithms on continuous MOPs. SBS divides the search space into many small segments according to the current evolutionary status, and performs the macro-jumping and micro-jumping operations inside them to guide the information exchange among “good” individuals. Moreover, the proposed SBS operator is activated when general genetic operators of an algorithm do not work well, thus providing a new power for the algorithm to search towards the desired direction. Systematic experiments have been carried out by providing an extensive comparison on a set of 36 test problems. From the experimental results, it can be observed that an EMO algorithm with the integration of SBS can improve its performance for MOPs. The new algorithm also outperforms its original version when the number of decision variables shifts. A comparative study on the BRS strategy of SBS reveals that the boundary relaxation is very important to enhance the search ability in multiobjective optimization. In addition, the effect of parameters SR and M iP was investigated, and their ranges, [0.4, 0.6] for SR and [0.4, 0.8] for M iP , are recommended for an unknown optimization problem. Finally, a comparison with three representative variation operators confirmed the competitiveness of the SBS operator in dealing with MOPs. Segment-based search is a new concept as a variation operator. Further studies are still required to investigate its benefits and limitations. Possible directions of future work include the adaptive setting of the SBS rate and micro-jumping proportion, the investigation of SBS for other algorithms (e.g.,
16
HV
RESULTS ( MEAN AND
SD)
OF
TABLE XIII NSGA-II+SBS, NSGA-II+OBL, NSGA-II+MM,
AND NSGA-II+JG, WHERE THE BEST MEAN AMONG THE ALGORITHMS FOR EACH CASE IS HIGHLIGHTED IN BOLDFACE
Problem SCH FON1 FON2 KUR POL ZDT1 ZDT2 ZDT3 ZDT4 ZDT6 WFG1 WFG2 WFG3 WFG4 WFG5 WFG6 WFG7 WFG8 WFG9 BEL BINH OSY2 TNK SRIN ConstrEx VNT1 VNT2 VNT3 VNT4 DTLZ1 DTLZ2 DTLZ3 DTLZ4 DTLZ5 DTLZ6 DTLZ7
NSGA-II+SBS
NSGA-II+OBL
2.2263E+1 (5.6E–3) 3.0620E+0 (2.0E–4) 3.3358E+0 (2.8E–4) 3.7013E+1 (1.7E–2) 7.5278E+1 (6.9E–2) 3.6595E+0 (3.5E–4) 3.3255E+0 (5.3E–4) 4.8138E+0 (2.1E–4) 3.6579E+0 (2.1E–3) 3.0238E+0 (3.6E–3) 9.2293E+0 (5.1E–1) 1.1068E+1 (4.2E–1) 1.0927E+1 (3.9E–3) 8.6611E+0 (7.5E–3) 8.2788E+0 (6.8E–2) 8.6586E+0 (4.6E–3) 8.6659E+0 (2.6E–3) 7.1459E+0 (5.3E–1) 8.4380E+0 (9.6E–3) 7.0285E+1 (4.0E–2) 8.2380E+3 (2.0E+0) 1.2541E+4 (2.0E+2) 3.2231E+0 (2.7E–4) 2.5770E+4 (1.9E+1) 1.3399E+1 (1.5E–3) 6.1052E+1 (1.3E–1) 1.9062E+0 (2.0E–3) 2.8359E+1 (4.3E–3) 8.9139E+1 (2.1E–1) 9.6833E–1 (2.4E–3) 7.3621E+0 (1.3E–2) 1.3467E+0 (2.0E+0) 7.3853E+0 (5.1E–3) 6.0983E+0 (6.6E–4) 6.0904E+0 (2.1E–2) 1.3201E+1 (4.9E–2)
NSGA-II+MM
NSGA-II+JG †
2.2262E+1 (5.2E–3) 3.0617E+0 (3.5E–4)† 3.3342E+0 (3.8E–4)† 3.7003E+1 (1.3E–2)† 7.5279E+1 (7.2E–2) 3.6578E+0 (5.8E–4)† 3.3229E+0 (1.1E–3)† 4.8114E+0 (5.9E–4)† 3.6491E+0 (1.6E–2)† 3.0167E+0 (3.3E–3)† 7.9809E+0 (9.9E–1)† 1.1037E+1 (4.2E–1) 1.0919E+1 (6.7E–3)† 8.6629E+0 (5.6E–3) 8.1400E+0 (2.8E–2)† 8.6382E+0 (2.5E–2)† 8.6614E+0 (6.0E–3)† 7.0816E+0 (4.9E–1) 8.4220E+0 (1.2E–2)† 7.0320E+1 (2.5E–2)† 8.2260E+3 (5.3E+0)† 1.2518E+4 (1.7E+2) 3.2230E+0 (2.5E–4) 2.5749E+4 (2.8E+1)† 1.3397E+1 (1.8E–3)† 6.0858E+1 (1.4E–1)† 1.9098E+0 (1.5E–3)† 2.8352E+1 (4.8E–3)† 8.8298E+1 (4.5E–1)† 9.6762E–1 (2.0E–3) 7.3383E+0 (1.8E–2)† 1.158E+0 (2.2E+0) 7.3710E+0 (1.4E–2)† 6.0930E+0 (1.4E–3)† 1.2315E+0 (7.6E–1)† 1.3171E+1 (6.1E–2)†
2.2270E+1 (2.1E–3)† 3.0618E+0 (1.9E–4)† 3.3341E+0 (4.4E–4)† 3.7011E+1 (1.7E–2) 7.5247E+1 (5.3E–2)† 3.6569E+0 (5.3E–4)† 3.3219E+0 (9.4E–4)† 4.8098E+0 (1.0E–3)† 3.6484E+0 (1.3E–2)† 3.0134E+0 (3.9E–3)† 8.0297E+0 (1.0E+0)† 1.0896E+1 (3.9E–1)† 1.0935E+1 (7.7E–3)† 8.6608E+0 (6.2E–3) 8.1341E+0 (2.4E–2)† 8.5316E+0 (1.5E–1)† 8.6644E+0 (5.3E–3) 7.0738E+0 (5.2E–1) 8.4259E+0 (1.3E–2)† 7.0352E+1 (3.4E–2)† 8.2276E+3 (2.3E+0)† 1.2498E+4 (1.9E+2)† 3.2230E+0 (5.6E–4) 2.5767E+4 (1.2E+1) 1.3399E+1 (1.7E–3) 6.1246E+1 (8.6E–2)† 1.9077E+0 (2.6E–3)† 2.8356E+1 (3.8E–3)† 8.9183E+1 (1.9E–1) 8.9749E–1 (2.1E–1) 7.3608E+0 (2.1E–2)† 1.7521E+0 (5.3E–1) 7.1527E+0 (8.4E–1) 6.0998E+0 (5.5E–4)† 2.7840E+0 (3.1E–1)† 1.3149E+1 (7.0E–2)†
2.2269E+1 (2.7E–3) 3.0621E+0 (1.8E–4) 3.3346E+0 (3.6E–4)† 3.7011E+1 (1.3E–2) 7.5245E+1 (6.3E–2)† 3.6579E+0 (6.2E–4)† 3.3232E+0 (8.3E–4)† 4.8113E+0 (6.9E–4)† 3.6503E+0 (1.6E–2)† 3.0168E+0 (4.0E–3)† 9.0317E+0 (7.7E–1) 1.1120E+1 (4.1E–1) 1.0934E+1 (5.5E–3)† 8.6628E+0 (6.3E–3) 8.1517E+0 (3.1E–2)† 8.5704E+0 (1.1E–1)† 8.6694E+0 (2.7E–3)† 7.1330E+0 (4.3E–1) 8.4320E+0 (1.3E–2) 7.0339E+1 (2.9E–2)† 8.2309E+3 (2.9E+0)† 1.2386E+4 (7.7E+2)† 3.2232E+0 (3.9E–4) 2.5774E+4 (1.2E+1) 1.3400E+1 (1.9E–3) 6.1188E+1 (1.1E–1)† 1.9079E+0 (2.5E–3)† 2.8360E+1 (5.1E–3) 8.9180E+1 (1.4E–1) 9.2801E–1 (8.3E–2) 7.3782E+0 (4.8E–3)† 5.9490E–1 (1.4E+0) 7.3845E+0 (4.3E–3) 6.0991E+0 (5.0E–4)† 6.0490E+0 (5.2E–2)† 1.3182E+1 (7.3E–2)†
“†” indicates that the p-value of 58 degrees of freedom is significant at a 0.05 level of significance by a two-tailed t-test for NSGA-II+SBS against its competitor. 1.0
35
30
1.0
10 0.2 5
0.0
0 0
5000
10000
15000
20000
25000
Solution Number
Solution Number
0.4
0.6
20
15
0.4
10 0.2 5
0.0
0 0
5000
10000
15000
20000
25000
25
0.6
20
15
0.4
10 0.2 5
0.0
0 0
5000
10000
15000
20000
25000
0.0
0 0
5000
10000
15000
20000
Evaluations
Evaluations
Evaluations
Evaluations
(a) NSGA-II+SBS
(b) NSGA-II+OBL
(c) NSGA-II+MM
(d) NSGA-II+JG
25000
Fig. 14. Probability that a solution generated by SBS has been inserted into the population during the evolutionary process across the 30 runs of the considered variation operators (SBS, OBL, JG, and M¨uhlenbein’s mutation) on WFG1 (denoted by dashed line). Black square denotes the average number of solutions generated by SBS, and hollow circle denotes the average number of solutions inserted into the population.
the Breeder GA), and its improvement for solving MOPs with the Pareto set having a complex shape in the decision space, such as the UF and CF test problems.
ACKNOWLEDGEMENT The authors would like to thank Mr. R. Shen, Mr. K. Wang, and Mr. Z. Zhang for their help in the experimental study of this work.
R EFERENCES [1] S. F. Adra, T. J. Dodd, I. A. Griffin, and P. J. Fleming, “Convergence acceleration operator for multiobjective optimization,” IEEE Tran. Evol. Comput., vol. 13, no. 4, pp. 825–847, Aug. 2009. [2] N. Beume, B. Naujoks, and M. Emmerich, “SMS-EMOA: Multiobjective selection based on dominated hypervolume,” Eur. J. Oper. Res., vol. 181, no. 3, pp. 1653–1669, Sep. 2007. [3] P. Bosman, “On gradients and hybrid evolutionary algorithms for realvalued multiobjective optimization,” IEEE Tran. Evol. Comput., vol. 16, no. 1, pp. 51–69, Feb. 2012. [4] T. Chan, K. Man, K. Tang, and S. Kwong, “A jumping gene paradigm for evolutionary multiobjective optimization,” IEEE Trans. Evol. Comput., vol. 12, no. 2, pp. 143–159, Apr. 2008.
Probability
0.2 5
15
0.8
25
Probability
10
0.6
20
1.0
0.8
25
Probability
0.4
Probability
0.6
15
35
30
0.8
25
20
1.0
30
0.8
Solution Number
35
30
Solution Number
35
17
[5] X. Chen, Y. S. Ong, M. Lim, and K. C. Tan, “A multi-facet survey on memetic computation,” IEEE Tran. Evol. Comput., vol. 15, no. 5, pp. 591–607, Oct. 2011. [6] K. Deb, A. Pratap, S. Agarwal, and T. Meyarivan, “A fast and elitist multiobjective genetic algorithm: NSGA-II,” IEEE Tran. Evol. Comput., vol. 6, no. 2, pp. 182–197, Apr. 2002. [7] K. Deb, Multi-Objective Optimization Using Evolutionary Algorithms. New York: John Wiley, 2001. [8] J. J. Durillo, A. J. Nebro, F. Luna, and E. Alba, “On the effect of the steady-state selection scheme in multi-objective genetic algorithms,” In Proc. 5th Int. Conf. on Evol. Multi-Criterion Optimization, 2009, pp. 183–197. [9] K. Deb, L. Thiele, M. Laumanns, and E. Zitzler, “Scalable test problems for evolutionary multiobjective optimization,” in Evolutionary Multiobjective Optimization: Theoretical Advances and Applications, A. Abraham, L. Jain, and R. Goldberg, Eds., Springer, 2005, pp. 105– 145. [10] A. Elhossini, S. Areibi, and R. Dony, “Strength Pareto particle swarm optimization and hybrid EA-PSO for multi-objective optimization,” Evol. Comput., vol. 18, no. 1, pp. 127–156, Spring 2010. [11] M. Emmerich, A. Deutz, and N. Beume, “Gradient-based/evolutionary relay hybrid for computing Pareto front approximations maximizing the S-metric,” in Hybrid Metaheuristics, T. Bartz-Beielstein, M. J. Blesa, C. Blum, B. Naujoks, A. Roli, G. Rudolph, and M. Sampels, Eds. Springer, 2007, pp. 140–156. [12] H. Fan and J. Lampinen, “A trigonometric mutation operation to differential evolution,” J. of Global Optim., vol. 27, no. 1, pp. 105–129, Sep. 2003. [13] C.M. Fonseca and P.J. Fleming, “On the performance assessment and comparison of stochastic multiobjective optimizers”, in Proc. Parallel Problem Solving from Nature, 1996, pp. 584–593. [14] D. Garrett and D. Dasgupta, “An empirical comparison of memetic algorithm strategies on the multiobjective quadratic assignment problem,” in Proc. IEEE Symp. Comput. Intell. in Miulti-Criteria Decision-Making, 2009, pp. 80–87. [15] C. K. Goh, Y. S. Ong, and K. C. Tan, Multi-Objective Memetic Algorithms. Springer Verlag, 2009, vol. 171. [16] C. Grosan and A. Abraham, “Hybrid evolutionary algorithms: methodologies, architectures, and reviews,” Hybrid Evolutionary Algorithms, pp. 1–17, 2007. [17] C. Grosan, A. Abraham, and H. Ishibuchi, Hybrid Evolutionary Algorithms. Berlin, Germany: Springer-Verlag, 2007. [18] F. Herrera, M. Lozano, and J. Verdegay, “Tackling real-coded genetic algorithms: operators and tools for behavioural analysis,” Artif. Intell. Review, vol. 12, no. 4, pp. 265–319, Aug. 1998. [19] S. Huband, P. Hingston, L. Barone, and L. While, “A review of multiobjective test problems and a scalable test problem toolkit,” IEEE Tran. Evol. Comput., vol. 10, no. 5, pp. 477–506, Oct. 2006. [20] C. Igel, N. Hansen, and S. Roth, “Covariance matrix adaptation for multi-objective optimization,” Evol. Comput., vol. 15, no. 1, pp. 1–28, Spring 2007. [21] H. Ishibuchi and T. Murata, “Multi-objective genetic local search algorithm,” in Proc. IEEE Int. Conf. Evol. Comput., 1996, pp. 119–124. [22] A. Jaszkiewicz, “On the performance of multiple-objective genetic local search on the 0/1 knapsack problem - a comparative experiment,” IEEE Tran. Evol. Comput., vol. 6, no. 4, pp. 402–412, Aug. 2002. [23] M. Kleeman, G. Lamont, A. Cooney, and T. Nelson, “A multi-tiered memetic multiobjective evolutionary algorithm for the design of quantum cascade lasers,” in Proc. Evol. Multi-Criterion Optimization, 2007, pp. 186–200. [24] J. Knowles, “A summary-attainment-surface plotting method for visualizing the performance of stochastic multiobjective optimizers,” Proc. 5th Int. Conf. on Intell. Syst. Design and Appl. (ISDA V), 2005, pp. 552–557. [25] J. Knowles and D. Corne, “Memetic algorithms for multiobjective optimization: issues, methods and prospects,” Recent Advances in Memetic Algorithms, pp. 313–352, 2005. [26] ——, “M-PAES: A memetic algorithm for multiobjective optimization,” in Proc. Congr. Evol. Comput., vol. 1, 2000, pp. 325–332. [27] P. Koch, O. Kramer, G. Rudolph, and N. Beume, “On the hybridization of SMS-EMOA and local search for continuous multiobjective optimization,” in Proc. 11th Annual Conf. Genetic Evol. Comput., 2009, pp. 603–610. [28] N. Krasnogor and J. Smith, “A tutorial for competent memetic algorithms: model, taxonomy, and design issues,” IEEE Tran. Evol. Comput., vol. 9, no. 5, pp. 474–488, Oct. 2005.
[29] S. Kukkonen and K. Deb, “A fast and effective method for pruning of non-dominated solutions in many-objective problems.” in Proc. 9th Int. Conf. Parallel Problem Solving from Nature, 2006, pp. 553–562. [30] A. Lara, G. Sanchez, C. Coello Coello, and O. Sch¨utze, “HCS: A new local search strategy for memetic multiobjective evolutionary algorithms,” IEEE Tran. Evol. Comput., vol. 14, no. 1, pp. 112–132, Feb. 2010. [31] C. Lo and W. Chang, “A multiobjective hybrid genetic algorithm for the capacitated multipoint network design problem,” IEEE Trans. Syst., Man, and Cybern., Part B: Cybern., vol. 30, no. 3, pp. 461–470, Jun. 2000. [32] M. Lozano, F. Herrera, N. Krasnogor, and D. Molina, “Real-coded memetic algorithms with crossover hill-climbing,” Evol. Comput., vol. 12, no. 3, pp. 273–302, Fall 2004. [33] M. Li, S. Yang, and X. Liu, “Shift-Based Density Estimation for ParetoBased Algorithms in Many-Objective Optimization,” IEEE Tran. Evol. Comput., 2013. In press. [34] M. Li, S. Yang, X. Liu, and R. Shen, “A comparative study on evolutionary algorithms for many-objective optimization,” in Proc. Evolutionary Multi-Criterion Optimization, 2013, pp. 261–275. [35] M. Li, S. Yang, J. Zheng, and X. Liu, “ETEA: A Euclidean minimum spanning tree-based evolutionary algorithm for multiobjective optimization,” Evol. Comput., 2013. In press. [36] S. Martinez and C. A. C. Coello, “A direct local search mechanism for decomposition-based multi-objective evolutionary algorithms,” in Proc. 2012 IEEE Congr. Evol. Comput., 2012, pp. 1–8. [37] Y. Mei, K. Tang, and X. Yao, “A memetic algorithm for periodic capacitated arc routing problem,” IEEE Tran. Syst. Man, Cybern., Part B: Cybern., vol. 41, no. 6, pp. 1654–1667, Dec. 2011. [38] H. M¨uhlenbein and D. Schlierkamp-Voosen, “Predictive models for the breeder genetic algorithm i. continuous parameter optimization,” Evol. Comput., vol. 1, no. 1, pp. 25–49, Spring 1993. [39] K. Nawaz Ripon, S. Kwong, and K. Man, “A real-coding jumping gene genetic algorithm (RJGGA) for multiobjective optimization,” Inform. Sci., vol. 177, no. 2, pp. 632–654, Jan. 2007. [40] A. J. Nebro, F. Luna, E. Alba, B. Dorronsoro, J. J. Durillo, and A. Beham, “AbYSS: Adapting scatter search to multiobjective optimization,” IEEE Tran. Evol. Comput., vol. 12, no. 4, pp. 439–457, Aug. 2008. [41] Y. S. Ong, M. Lim, and X. Chen, “Memetic computation—past, present & future,” IEEE Comput. Intell. Magazine, vol. 5, no. 2, pp. 24–31, May 2010. [42] S. Rahnamayan, H. Tizhoosh, and M. Salama, “Opposition versus randomness in soft computing techniques,” Appl. Soft Comput., vol. 8, no. 2, pp. 906–918, 2008. [43] ——, “Opposition-based differential evolution,” IEEE Tran. Evol. Comput., vol. 12, no. 1, pp. 64–79, Feb. 2008. [44] J. D. Schaffer, “Multiple objective optimization with vector evaluated genetic algorithms,” in Proc. 1st Int. Conf. Genetic Algorithms, 1985, pp. 93–100. [45] O. Sch¨utze, C. A. C. Coello, S. Mostaghim, E. G. Talbi, and M. Dellnitz, “Hybridizing evolutionary strategies with continuation methods for solving multi-objective problems,” Eng. Optim., vol. 40, no. 5, pp. 383– 402, May 2008. [46] O. Sch¨utze, A. Lara, and C. A. C. Coello, “On the influence of the number of objectives on the hardness of a multiobjective optimization problem,” IEEE Tran. Evol. Comput., vol. 15, no. 4, pp. 444–455, Aug. 2011. [47] K. Sindhya, K. Deb, and K. Miettinen, “A local search based evolutionary multi-objective optimization approach for fast and accurate convergence,” in Proc. 10th Int. Conf. Parallel Problem Solving from Nature, 2008, pp. 815–824. [48] A. Sinha and D. Goldberg, “A survey of hybrid genetic and evolutionary algorithms,” IlliGAL Report, vol. 2003004, 2003. [49] J. Smith, “Coevolving memetic algorithms: a review and progress report,” IEEE Trans. Syst., Man, and Cybern., Part B: Cybern., vol. 37, no. 1, pp. 6–17, Feb. 2007. [50] O. Soliman, L. Bui, and H. Abbass, “A memetic coevolutionary multiobjective differential evolution algorithm,” in Multi-Objective Memetic Algorithms. Springer, 2009, pp. 369–388. [51] K. C. Tan, Y. J. Yang, C. K. Goh, and T. H. Lee, “Enhanced distribution and exploration for multiobjective evolutionary algorithms,” in Proc. Congr. Evol. Comput., vol. 4, 2003, pp. 2521–2528. [52] K. C. Tan, S. C. Chiam, A. A. Mamun, and C. K. Goh, “Balancing exploration and exploitation with adaptive variation for evolutionary multi-objective optimization,” Europ. J. of Oper. Res., vol. 197, no. 2, pp. 701–713, Sep. 2009.
18
[53] H. Tizhoosh, “Opposition-based learning: A new scheme for machine intelligence,” in Proc. Int. Conf. Comput. Intell. Modeling Control and Autom., vol. 1, 2005, pp. 695–701. [54] D. A. Van Veldhuizen, “Multiobjective evolutionary algorithms: Classifications, analyses, and new innovations,” Ph.D. dissertation, Department of Electrical and Computer Engineering, Air Force Institute of Technology, Wright-Patterson AFB, Ohio, 1999. [55] M. Vasile and M. Locatelli, “A hybrid multiagent approach for global trajectory optimization,” J. Global Optim., vol. 44, no. 4, pp. 461–479, Aug. 2009. [56] T. Voß, N. Hansen, and C. Igel, “Recombination for learning strategy parameters in the MO-CMA-ES,” in Proc. Evol. Multi-Criterion Optimization, 2009, pp. 155–168. [57] Y. Wang, Z. Cai, G. Guo, and Y. Zhou, “Multiobjective optimization and hybrid evolutionary algorithm to solve constrained optimization problems,” IEEE Trans. Syst., Man, and Cybern., Part B: Cybern., vol. 37, no. 3, pp. 560–575, Jun. 2007. [58] E. Wanner, F. Guimar˜aes, R. Takahashi, and P. Fleming, “Local search with quadratic approximations into memetic algorithms for optimization with multiple criteria,” Evol. Comput., vol. 16, no. 2, pp. 185–224, Summer 2008. [59] S. Yang and S. Jat, “Genetic algorithms with guided and local search strategies for university course timetabling,” IEEE Trans. Syst., Man, and Cybern., Part C: Appl. and Rev., vol. 41, no. 1, pp. 93–106, Feb. 2011. [60] S. Yang and C. Li, “A clustering particle swarm optimizer for locating and tracking multiple optima in dynamic environments,” IEEE Tran. Evol. Comput., vol. 14, no. 6, pp. 959–974, Dec. 2010. [61] S. Yang, M. Li, X. Liu, and J. Zheng, “A grid-based evolutionary algorithm for many-objective optimization,” IEEE Trans. Evol. Comput., vol. 17, no. 5, pp. 721–736, Oct. 2013. [62] Q. Zhang, A. Zhou, S. Zhao, P. N. Suganthan, W. Liu, and S. Tiwari, “Multiobjective optimization test instances for the CEC 2009 special session and competition,” School of CS & EE, University of Essex, Working Report CES-487, 2009. [63] Q. Zhang and H. Li, “MOEA/D: A multiobjective evolutionary algorithm based on decomposition,” IEEE Tran. Evol. Comput., vol. 11, no. 6, pp. 712–731, Dec. 2007. [64] E. Zitzler, M. Laumanns, and L. Thiele, “SPEA2: Improving the strength Pareto evolutionary algorithm for multiobjective optimization,” in Proc. Evolutionary Methods for Design, Optimisation and Control, 2002, pp. 95–100. [65] E. Zitzler, K. Deb, and L. Thiele, “Comparison of multiobjective evolutionary algorithms: Empirical results,” Evol. Comput., vol. 8, no. 2, pp. 173–195, Summer 2000.
Miqing Li received the B.Sc. degree in computer science from the School of Computer and Communication, Hunan University, Changsha, China, in 2004, and the M.Sc. degree in computer science from the College of Information Engineering, Xiangtan University, Xiangtan, China, in 2008, respectively. He is currently pursuing the Ph.D. degree at the Department of Information Systems and Computing, Brunel University, U.K. From 2008 to 2011, he was a Research Assistant in the College of Information Engineering, Xiangtan University, Xiangtan, China. He has published over ten research papers since 2008. His current research interests include evolutionary computation, multiobjective optimization, and dynamic optimization.
Shengxiang Yang (M’00) received the B.Sc. and M.Sc. degrees in automatic control and the Ph.D. degree in systems engineering from Northeastern University, Shenyang, China in 1993, 1996, and 1999, respectively. He is currently a Professor in Computational Intelligence and Director of the Centre for Computational Intelligence, School of Computer Science and Informatics, De Montfort University, Leicester, U.K. He has over 160 publications. His current research interests include evolutionary and genetic algorithms, swarm intelligence, computational intelligence in dynamic and uncertain environments, artificial neural networks for scheduling, and relevant real-world applications. Prof. Yang is the Chair of the Task Force on Evolutionary Computation in Dynamic and Uncertain Environments, Evolutionary Computation Technical Committee, IEEE Computational Intelligence Society, and the Founding Chair of the Task Force on Intelligent Network Systems, Intelligent Systems Applications Technical Committee, IEEE Computational Intelligence Society.
Ke Li (S’10) was born in Hunan, China, in 1985. He received the B.Sc. and M.Sc. degrees in computer science and technology from the Xiangtan University, Xiangtan, China, in 2007 and 2010, respectively. He is currently pursuing the Ph.D. degree at City University of Hong Kong.
Xiaohui Liu is Professor of Computing at Brunel University in the UK where he directs the Centre for Intelligent Data Analysis, conducting interdisciplinary research concerned with the effective analysis of data. He is a Charted Engineer, Life Member of the Association for the Advancement of Artificial Intelligence, Fellow of the Royal Statistical Society, and Fellow of the British Computer Society. Professor Liu has over 100 high quality journal publications in biomedical informatics, computational intelligence, data mining and dynamic systems where he has more than 40 IEEE Transaction papers and his H-index is over 40.