Exploiting Relational Structure to Understand Publication Patterns in High-Energy Physics Amy McGovern, Lisa Friedland, Michael Hay, Brian Gallagher, Andrew Fast, Jennifer Neville, David Jensen Knowledge Discovery Laboratory University of Massachusetts Amherst 140 Governors Drive, Amherst, MA 01003
amy,lfriedl,mhay,bgallag,afast,jneville,
[email protected] ABSTRACT
Journal (199)
We analyze publication patterns in theoretical high-energy physics using a relational learning approach. We focus our analyses on four related areas: understanding and identifying patterns of citations, examining publication patterns at the author level, predicting whether a paper will be accepted by specific journals, and identifying research communities from the citation patterns and paper text. Each of these analyses contributes to an overall understanding of theoretical high-energy physics that could not have been achieved without examining each area in detail.
1.
INTRODUCTION
We identify interesting patterns and relationships in the theoretical high-energy physics publishing community using a relational learning approach. We focus on several highlevel questions: • Can we predict why some papers receive more citations than others? What are the trends in citations and references?
Author (9200)
Co-Authored (87,794)
Citation (352,807)
Authored (58,515)
Affiliation (12,487) Domain (3116)
data and supports many interesting analysis and prediction tasks. In the following sections, we discuss our analyses and present our results, including: • Approximately 26% of the people in hep-th wrote papers that received 80% of the citations. • Edward Witten is the most influential author in theoretical high-energy physics.
• What factors contribute to journal publication? Can we predict whether a paper will appear in a particular journal?
• Papers with only a single author are less likely to be published in journals than multi-authored papers.
• Can we identify schools of thought or communities in theoretical high-energy physics? Who are the most authoritative authors for each community?
Permission to make digital or hard copies of all or part of this work for personal or classroom use is granted without fee provided that copies are not made or distributed for profit or commercial advantage and that copies bear this notice and the full citation on the first page. To copy otherwise, to republish, to post on servers or to redistribute to lists, requires prior specific permission and/or a fee. SIGKDD ’03, August 24-27, 2003, Washington, DC, USA Copyright 2003 ACM 1-58113-737-0/03/0008 ...$5.00.
Paper (29,555)
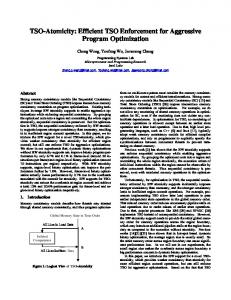
Figure 1: Schema extracted from the abstracts and citation data. Objects are represented by vertices and relations by edges; numbers in parentheses are object and relation counts.
• What factors contribute to an author’s influence? Can we identify measures of influence? Can we predict potential award winners?
We analyzed these questions using a relational approach. We constructed the relational schema shown in Figure 1. This schema provides a rich representation for the hep-th
Published In (20,826)
• Authors tend to prefer particular journals, that is, a journal’s name is autocorrelated through authors. • Authors tend to publish within topics (i.e., topics are also autocorrelated though authors). These findings and many others are explained in more detail in sections 3 through 6.
2.
DATA REPRESENTATION
We use a relational representation from the hep-th data. Our representation uses an attributed graph, G = (V, E). Objects, such as authors, journals, and papers, are represented as vertices in the graph. Relations between these objects, such as published-in(paper, journal), are represented by links between the objects. If there is a relation r(o1 , o2 ),
then o1 , o2 ∈ V and r ∈ E. Attributes are associated with objects, such as author.last-name, or edges, such as authored.rank. Figure 1 shows the objects and relations we use, along with their counts in the database. Details on the attributes and on how we extracted them from the hep-th data are given in Appendix A. The process of author consolidation, that is, determining if the John Smith who wrote paper 1 is the same person as the J. Smith who wrote paper 2, was greatly facilitated by the relational structure [1]. Details of our consolidation approach are in Appendix B.
3.
CITATION ANALYSIS
Our first analysis focuses on the papers and citation relations between them. We start by identifying patterns and correlations in this data. We use this to analyze why some papers are more popular than others and we build a relational model to predict popular papers.
3.1
Citation Graph Analysis
The citations graph is comprised of 1,928 separate connected components. The largest contains 27,400 papers, while all the others contains 10 or fewer papers. The growth in popularity of arXiv and hep-th (1397 papers in 1992 to 3312 in 2002) and the limited time frame of the data set cause edge effects on the early and late years; so we often concentrate on the more stable middle years. Figure 2a shows these effects. We break both references and citations into self and non-self categories. A self citation or reference means that there is a shared author between the two papers. 18% of the citations in hep-th are self citations. On a perpaper basis, an average of 28% of a paper’s references cite its authors past work and 34% of a paper’s citations are from its authors. Papers with low citation and reference counts generate a large proportion of the self citations thus the perpaper averages are higher than the overall percentage. The number of non-self citations peaks for papers submitted in 1996. Because papers are often submitted to hep-th before being published in a journal, we hypothesized that papers might receive citations in two peaks. In particular, a paper could be cited by other papers in hep-th as soon as they were submitted to arXiv and again after being published in a journal. Figure 2b shows the number of citations that each paper received in the years following its submission to arXiv . Starting with the overall mean (the thick line), we can see that papers generally receive the most citations in the year following submission to arXiv . Since the average time from a paper’s submission to arXiv until it appears in a journal is about one year, this peak likely coincides with journal publication. It is interesting to note that papers receive an average of two citations in the year prior to journal publication. This demonstrates the success of arXiv by allowing people to cite work before it has been published. The pattern of citations for papers submitted to arXiv in 1992 is also interesting. In this case, the peak is two years after submission to arXiv . This delay can be explained by arXiv ’s growing popularity as the use of the Internet grew; in 1992, their audience was limited. In later years (e.g., 1995, 1999), the number of citations increases more quickly due to the larger number of authors with Internet access. Figure 2c shows the average number of non-self citations for papers that have been published in a journal versus un-
Author authority papers Edward Witten Juan M. Maldacena Steven S. Gubser Igor R. Klebanov Leonard Susskind Joseph Polchinski Paul K. Townsend Stephen H. Shenker Michael R. Douglas Nathan Seiberg Cumrun Vafa Andrew Strominger Petr Horava Daniel Z. Freedman
Num. in top 10 4 2 2 1 1 1 1 1 0 0 0 0 0 0
Num. in top 50 14 6 4 4 4 4 3 2 5 3 3 3 2 2
Non-self citations 18716 8076 5067 5843 5526 5535 4991 2300 5787 9911 8594 6480 1936 1874
Table 1: Authors of the top 10 and top 50 most authoritative papers and the total number of nonself citations that these authors have received in hepth. Author of hub papers Igor R. Klebanov Arkady A. Tseytlin Steven S. Gubser Ofer Aharony Washington Taylor IV Alberto Zaffaroni Clifford V. Johnson
Num. in top 1% 15 10 9 8 6 6 6
Num. in top 5% 31 29 28 19 7 13 21
Non-self references 5843 5352 5067 2307 2115 1369 1615
Table 2: Authors of the top 1 and top 5 percent hub papers and the total number of non-self references that these authors have made. published papers. Papers that are published in a journal have a significantly higher average non-self citation rate than papers that are published only on arXiv . Although many people in the high energy physics community have access to arXiv , it is clear that either journal publication is still important in increasing a paper’s visibility, or that authors writing highly cited papers still seek journal publication. The hubs and authorities algorithm [6] can used on the citation graph to identify authoritative papers and potential review papers. A hub is an object that points to many authorities. This is likely to be a review paper. An authority is an object that is pointed to by many hubs. Once we identified the most authoritative papers, we examined the authorship for these papers. Table 1 shows the authors who have written at least two of the top 10 and top 50 most authoritative papers. As many of these names appear again when we study influential authors, we discuss their specifics in section 4. In general, the authors of these highly authoritative papers include a number of award winners including MacArthur Foundation fellows, Dirac winners, and Fields medalists. They hail from many prestigious institutions including the Institute for Advanced Studies at Princeton, Princeton University, Harvard, Rutgers, Stanford, UC Santa Barbara, Cambridge, UC Berkeley, and MIT. Table 2 shows some authors who have written top hub papers in the database. We were interested in the question of whether some authors write mostly review papers. In arXiv , no author has written more than one of the top 10 or top 50 hub papers. However, if we examine the top 1% and top 5%, several authors show up as frequently writing review papers. The top three authors on this list, Klebanov, Tseytlin, and
4
x 10
Number of citations in/out
5 4 3 2 1 0
1992
1994 1996 1998 2000 Year paper submitted to arxiv
2002
4
Overall mean 1992 1995 1999
3.5 3
Average number of non−self citations per paper
non−self citations non−self references self citations self references
6
Average number of non−self citations per paper
7
2.5 2 1.5 1 0.5 0 0
2 4 6 8 Number of years since paper submitted to arxiv
(a)
(b)
10
4
Published papers Unpublished papers Overall average
3.5 3 2.5 2 1.5 1 0.5 0 0
2 4 6 8 Number of years since paper submitted to arxiv
10
(c)
Figure 2: Temporal citation and reference patterns for papers submitted to arXiv . (a) Total number of non-self and self citations and references by year. (b) Citations patterns for all papers. (c) Citation patterns for published versus unpublished papers. Attribute arXiv area of paper Num. downloads first 60 days Journal name Clustered topic of paper Authority score on coauthor graph arXiv area of cited paper Num. of coauthors Num. downloads first 60 days
Through Author Author Author Author Paper Paper Paper Journal
Score 0.72 0.55 0.69 0.54 0.74
In addition to correlations among variables of a single object, we also measured autocorrelation throughout the data graph [3]. Autocorrelation is a statistical dependency between the values of the same variable on related objects, also known as homophily [7]. For example, the number of downloads of a paper is autocorrelated through authors. This means that if one of an author’s papers is frequently downloaded, other papers by the same author are likely to be downloaded as well.
0.70 0.45 0.42
Table 3: Selected autocorrelation scores. Attribute 1 Authority score Area (from arXiv ) Hub score Num. downloads first 60 days Is paper published Num. of publications Num. of distinct coauthors
Table 4: tributes.
Attribute 2 For paper Num. of citations References (binned) Num. of references Num. of citations Citations (binned) For author Num. of distinct coauthors Num. of non-self citations
Score 0.85 0.68 0.62 0.57 0.46 0.85 0.59
Selected correlation scores between at-
Gubser, are frequent co-authors. Table 2 contains no major award winners and represents a slightly different list of institutions than Table 1 including Princeton, Ohio State, Rutgers, MIT, CERN and the University of Durham, UK.
3.2
Citation Data Dependencies
To better understand what makes papers popular and identify trends and patterns in the citation data, we analyzed correlations in the citation data. For discrete attributes, we used chi-square corrected contingency coefficients; for continuous attributes we used correlation coefficient [13] Tables 3 and 4 list significant correlations in the data. All reported correlations are significant at the p < 0.0001 level. The number of times that a paper is downloaded is correlated with the number of non-self citations of that paper. This is not surprising as one expects more frequently downloaded papers to be cited more frequently.
3.3
Predicting Popular Papers
We used relational probability trees (RPTs) [11] for several modeling tasks. For each task, we sampled papers temporally, training the model on papers from one year and testing on the following year’s papers. To avoid edge effects, we considered only papers from 1995 to 2000. For classification, the models considered characteristics of papers, their referenced papers, authors, and other past papers written by the authors. Some example attributes include the number of pages of the paper, its file size in KB, keywords, the author’s number of past co-authors, the number of past publications for each author, and the number of citations received by a cited paper. Attributes were calculated for each temporal sample. For instance, to predict the class label on a paper submitted in 1997, the model considered the citation/publication history of related objects up to and including 1996. The first modeling task involved predicting the number of non-self citations that a paper will receive. We categorized the number of non-self citations into quartiles: {0-1, 2-5, 614, >14}. Default classification accuracy is approximately 25%. Over 5 training/test splits, RPT models achieved and average accuracy of 44%. Although 44% is not an extremely high accuracy, it is not likely that we would achieve a high accuracy solely based on the information available in hep-th. Such measures as the quality of the paper are not able to be captured based on the performance of an author’s past papers and this may not fully capture the situation. One reason we chose to use RPT models is their selectivity. We can examine the features chosen by the trees and identify the most relevant features for the classification task. The RPT models identified that a paper has a probability of 0.85 of receiving more than 14 non-self citations if 1) the
The second part of our analysis focuses on the authors in theoretical high-energy physics. We start by analyzing the overall structure of the author subgraph and extend this understanding to identifying influential authors. We define several measures of influence and build a relational model to identify and predict award-winning authors. Finally, we predict potential award winners in theoretical high-energy physics.
4.1
1.0 0.8 0.6 0.4 0
1000
2000
3000
4000
5000
6000
Author index
Figure 4: Cumulative percent of non-self citations received per author.
Co-Author Graph Analysis 0.8
0.6
0.25
Authors with many distinct co−authors Authors of authority papers Authors with many non−self citations Average 1% of authors
Edward Witten Average Single Author Percent of author graph covered
0.7 Percent of author graph covered
0.2
AUTHOR ANALYSIS
0.0
4.
Cumulative percentage of non−self citations
paper has more than 8 references 2) the authors have at least 2 past papers with more than 8 non-self citations 3) the authors have at least 25 past papers (that are at least 15 pages long) 4) at least 30% of cited work is unpublished.
0.5 0.4 0.3 0.2
0.2
0.15
0.1
0.05
0.1 0 0
1 2 Number of Links Away
(a)
3
0 0
1 2 Number of Links Away
3
(b)
Figure 3: (a) Percent of the author graph that is one, two, and three links away from several sets of the top 1% of authors as well as from a random sampling of 1% of authors. (b) Percent of the author graph that is 1, 2, and 3 links away from Edward Witten versus the average author. We found that the high energy physics community is tightly knit. In the graph of authors linked by co-authored relations, 7304 of the total 9200 authors belong to a single connected component. As with the paper graph, other components are all small (15 or fewer authors). When we narrowed this set of authors to authors who wrote the top 1%, 5% and 10% of the authoritative papers, we found that in each case the vast majority of the authors remained connected, with only a very small percentage in separate components. This provides evidence for the idea that influential scientists train the up-and-coming influential scientists in their labs, either as students or post-doctoral fellows [5], and co-author with them. We also found that authors who are highly cited or have many distinct co-authors are more central to the author graph than randomly selected authors. Figure 3 shows the percentage of authors who are 1, 2, and 3 links away from authors who wrote the top 1% of authority papers, authors who have received the top 1% of non-self citations and the top 1% of authors who have co-authored with different people. These numbers are compared to 10 random samplings of 1% of the authors. Each of these sets of influential authors reaches a higher percentage of authors by following even just one co-authored relation than random. This trend continues for paths of length two or three. We also show the average degree of separation from Edward Witten, who consistently shows up as the most influential author in hep-th.
Before building a quantitative measure of an author’s influence, we examined the data for general trends. From 1995 through 2000, a relatively stable window for the data set, 6405 authors submitted papers to arXiv . Of these authors, on average each wrote 5 papers; the median was 2. Sergei Odintsov (with 92 papers) and H. Lu and C.N. Pope (each with 84) topped the distribution. As seen in Table 6, the top authors produce high numbers of papers by coauthoring widely and frequently. The average number of distinct co-authors is 5.5. Of the papers submitted to arXiv in this period, each author published an average of 4 papers in journals. On their combined papers, authors recieved an average of 76 non-self citations, with a much lower median of 7. The top 10% of authors averaged 140 non-self citations. The 80/20 rule or Pareto’s Principle states that, in power law distributions, 80% of the mass is generally due to only 20% of the values (whether in science or other domains)[12, 8]. We investigated this rule in theoretical high-energy physics by examining the number of non-self citations received on a paper and author basis. In the hep-th data, 80% of the non-self-citations go to 17.8% of the papers and 26.3% of the authors wrote these papers. The full distribution for authors is shown graphically in Figure 4.
4.2
Author Data Dependencies
Trends and dependencies for authors are summarized in Tables 3 and 4. The number of an author’s publications is correlated with the number of citations that the author receives. This means that either authors who have more citations publish more frequently or that people who publish more papers receive more citations. Perhaps more surprising is that the number of publications that an author has is correlated with the number of distinct co-authors that the author has published with. This indicates that frequently published authors do not tend to work repeatedly with only the same set of co-authors but continue to expand their research to working with new people. We expected that authors who write authoritative papers are likely to write other authoritative papers but this was not the case. A paper’s authority score was not autocorrelated through author which means that most authors will write only a few authoritative papers in their lifetime. Information about the research styles of authors can be gained from autocorrelation scores. For instance, the number of distinct coauthors is autocorrelated through papers. That is, if you publish with other authors who publish with
Author Edward Witten Juan M. Maldacena Cumrun Vafa Nathan Seiberg Andrew Strominger Michael R. Douglas Igor R. Klebanov Joseph Polchinski Steven S. Gubser Ashoke Sen
(a) Overall co-authorships Author Count C.N. Pope 337 H. Lu 325 S.D. Odintsov 296 Sergio Ferrara 233 Mirjam Cvetic 231
(b) Distinct co-authorships Author Count Cumrun Vafa 63 Gary W. Gibbons 60 Jan de Boer 56 Sergio Ferrara 55 Antoine Van Proeyen 55
Table 6: (a) Authors who frequently co-author on papers (including repeatedly co-authoring with the same person). (b) Authors who frequently coauthor with different people on papers. We ranked the authors who submitted papers to arXiv from 1995 to 2000 according to each of these measures and evaluated each measure according to the number of award winning authors it ranked highly. We identified 55 winners of prestigious awards, including Nobel prize winners, MacArthur Foundation fellows, Dirac fellows, Guggenheim recipients, Fields medal winners, and Alfred P. Sloan Foundation winners. Based on the number of award winners listed in the top 100 of each ranking, we found that most of the above measures performed about equally, finding around 10 award winners. Measures 1 and 2 did best, with 14 winners. We therefore chose measure 1 to be our canonical influence measure, noting that the raw total of citations is also the one used by popular research tools1 . Figure 7 shows the top authors and their citation counts. Heading the list, Edward Witten is a MacArthur Foundation fellow, a Fields medalist, and a Dirac fellow. Juan Maldacena, also a MacArthur Foundation fellow, is a younger researcher and looks quite likely to become the most cited author as he continues his research. This table also includes a number of other award winners. Surprisingly, measures 10 and 11, which we constructed to indicate an author’s consistency of success, performed 1 Citeseer: http://citeseer.nj.nec.com/mostcited.html and ISI Essential Science Indicators: http://www.in-cites.com
●
0.0
● ● ● ● ● ● ● ● ● ● ● ● ● ●● ● ●● ● ● ● ●● ● ● ● ● ● ●●● ●
0.2
0.4
0.6
0.8
Percentage of papers with journal ref
(a)
1.0
0 1000 2000
● ● ● ● ● ● ● ● ● ● ● ● ● ● ● ● ● ● ● ● ● ● ● ● ● ● ● ● ● ● ● ● ● ● ● ● ● ● ● ● ● ● ● ● ● ● ● ● ● ● ● ● ● ● ● ● ● ● ● ● ● ● ● ● ● ● ● ● ● ●
3000
● ● ●
● ●●
4000
●
● ● ● ● ● ● ● ● ●
●
5000
●
●
Author rank by non−self citations (best = 1)
1000 2000 3000 4000 5000
●● ● ●● ●● ●● ● ● ● ● ● ● ● ●● ● ● ●● ● ● ● ●● ● ● ● ● ● ● ●● ● ● ●● ● ● ● ● ● ● ● ● ● ● ● ● ● ● ● ● ● ● ● ● ● ● ● ● ● ● ● ● ● ●● ● ● ● ● ● ● ● ● ● ● ● ● ● ● ●● ● ● ● ● ● ● ● ● ● ●● ● ●●●●● ●● ● ●● ● ● ● ● ● ● ● ●● ● ● ● ● ● ● ● ● ● ● ●● ● ●● ● ● ● ● ● ● ● ● ●● ● ● ● ● ● ● ● ● ● ● ●● ● ● ● ● ●●● ● ● ● ● ● ● ● ● ● ● ● ● ● ● ● ● ● ● ●●● ●● ● ● ●● ● ● ● ● ● ● ● ● ● ● ● ● ● ● ● ● ●● ●●● ● ● ● ●● ● ●● ●●● ●●● ●● ● ● ● ● ● ● ● ● ● ● ● ● ●● ● ● ● ● ● ● ●● ● ● ● ● ● ● ●● ● ● ● ● ● ● ● ● ● ● ●● ● ● ●● ● ●●● ● ● ● ● ● ● ● ●● ●● ● ● ● ● ●● ● ● ● ●● ● ● ● ● ● ● ● ● ● ●● ● ● ● ●● ● ● ● ● ● ● ● ● ● ● ● ● ● ●● ●● ● ● ● ● ● ● ● ● ●● ● ● ● ● ●● ●● ●●● ● ● ● ● ● ● ●● ●● ● ●● ●● ● ● ● ● ● ● ●●● ● ●● ● ● ● ● ● ● ● ● ● ● ● ●● ●● ● ● ● ● ● ● ● ● ●● ● ● ● ● ● ● ● ● ●● ● ●● ● ● ●●● ● ● ● ● ● ● ● ● ●● ●● ● ● ● ● ● ●● ● ● ●● ● ● ●● ● ● ● ● ● ● ● ●● ● ● ●● ●● ●●● ● ●●●●● ● ●● ● ●● ●● ● ●● ● ● ●● ●●● ● ● ●● ● ● ● ● ● ●● ● ● ● ● ●● ● ● ● ● ●●● ●●● ●●● ●● ● ● ● ● ● ● ●● ● ● ● ●● ● ● ● ● ●● ● ●● ● ● ●● ●● ● ● ● ● ● ●● ● ● ●● ● ● ● ● ● ● ● ● ● ● ● ● ● ● ● ● ● ● ● ●●● ● ●●●● ● ● ●● ● ●● ●● ●● ● ● ●●● ●● ● ●● ●● ● ● ● ● ● ● ●● ●● ● ●● ●●● ● ● ●● ●● ● ● ● ● ●● ●●● ●● ● ● ● ●● ●● ● ● ●● ● ● ● ● ● ● ● ● ● ● ● ● ● ● ● ● ● ● ● ● ● ● ● ● ●● ● ● ● ●● ● ●● ● ● ● ●●● ● ●●● ●● ● ● ● ● ● ●● ●●● ● ● ● ●● ● ● ● ●● ●● ●● ● ●●● ● ●● ● ● ● ● ● ●●● ●● ● ● ● ● ● ● ● ● ● ● ● ● ● ● ● ● ● ● ● ●● ● ● ● ● ● ● ●● ● ●● ● ● ●●●●●● ● ●● ● ● ● ●● ● ● ● ●● ● ● ●●● ●●●●● ● ● ●● ● ● ● ●● ● ● ● ●● ● ● ●● ● ● ● ● ●● ● ● ● ● ● ● ● ● ● ● ● ● ● ● ● ● ● ● ● ● ● ● ●●●● ● ● ●● ● ● ● ● ●● ● ●● ●● ● ● ●● ● ● ● ●● ●● ● ● ● ● ● ●● ● ●● ● ●● ● ● ● ● ● ●●● ● ● ● ● ● ● ● ● ● ● ● ●● ● ●● ●● ● ● ●● ● ● ●● ● ● ● ● ● ● ● ● ● ● ● ● ●● ●● ● ● ● ● ● ● ● ● ● ● ● ● ● ● ● ● ● ● ● ●● ● ● ● ● ●● ● ● ● ● ● ● ● ● ● ● ● ● ● ● ●● ● ●● ● ● ● ● ● ● ● ● ● ●● ● ●● ● ● ●● ●●●●● ● ● ● ● ● ● ● ● ● ● ● ● ● ● ● ● ● ● ● ● ● ● ● ● ● ● ● ● ● ● ● ● ● ● ●● ● ● ● ● ●●● ● ● ● ●● ● ● ● ● ● ● ● ● ● ●● ●● ● ● ● ● ● ● ● ●● ● ● ● ● ● ● ● ● ● ● ● ● ● ● ● ● ● ● ● ● ● ● ● ● ● ● ● ● ● ● ● ● ● ● ● ● ● ● ● ● ● ● ● ● ●● ● ● ● ● ● ● ● ● ● ● ● ● ● ● ● ● ● ● ● ● ● ● ● ● ● ● ● ● ● ● ● ● ● ● ● ● ● ●● ●
●
6000
Analyzing Author Influence
After gaining a general understanding of author publication patterns, we hypothesized that author influence, that is, overall reputation and impact, could be defined using the measures shown in Table 5.
Author rank by non−self citations (best = 1)
4.3
0
Table 5: Measures of author influence many distinct people you are also likely to publish with many distinct people. Within the arXiv data, an author who publishes a paper in a particular journal is likely to publish his other papers in that journal as well.
Non-self citations 13806 7334 6578 6258 5371 5089 5063 4815 4812 4201
# papers 59 39 55 45 44 24 51 25 31 51
Table 7: Top-cited authors, based on papers 19952000
6000
1. Number of non-self citations received 2. Total number of citations received 3. Number of papers written 4. Number of papers published in journals 5. Number of papers with over 12 citations 6. Number of co-authorships 7. Number of distinct co-authors 8. Average non-self citations per paper 9. Maximum non-self citations received on any paper 10. Percentage of papers published 11. Percentage of papers with over 12 citations 12. Weighted combination of 1, 4, 5, and 9.
● ●●●● ●● ●●●● ● ● ●● ●● ● ●●● ●●●● ●● ●●● ●● ●●● ●●● ●● ●●● ● ● ●● ●● ●●●●●● ●● ●● ●●●●●●● ● ● ● ●● ●● ●● ●● ●●● ● ●● ●● ●●● ● ●● ● ● ● ●● ●● ●● ●● ●● ●● ●● ● ●● ●●● ●● ● ●●●● ●● ●● ●● ●● ●● ● ● ●● ●● ● ●●●● ●● ● ● ● ● ● ● ● ● ● ● ● ●● ●● ● ●● ●● ●● ●●● ● ● ●● ● ●● ● ●● ● ●● ● ●● ●● ● ●● ● ● ● ●● ● ●● ●● ●● ●● ●● ●● ●● ●● ● ● ● ● ●● ●● ●● ●● ●● ●●● ●●● ●● ● ●● ●● ● ● ● ● ● ●● ● ● ● ● ● ● ●● ● ● ● ● ● ● ● ● ● ● ● ● ● ●●● ● ● ● ● ● ● ● ● ●● ● ●● ● ●● ● ● ●● ● ●● ●● ●● ● ●● ●● ●● ●● ●● ●● ●● ●● ●● ● ●● ●● ● ●●● ● ●●● ●● ●● ● ● ●● ● ● ● ● ● ●●● ● ● ● ● ●● ● ● ●● ● ● ● ● ● ●● ● ● ● ● ● ● ● ● ●● ●● ●● ● ● ●● ● ● ●● ● ● ● ● ● ● ●● ● ●● ●● ●● ●● ●● ●● ●●● ●● ●● ●●● ●● ●● ●● ●● ● ●● ●● ● ●● ● ● ● ● ●● ● ● ● ● ● ● ● ● ● ● ● ● ● ● ● ● ● ●● ● ● ● ● ● ● ●●●● ● ● ●● ●● ●● ● ● ● ● ● ● ● ● ● ●● ● ●● ● ● ● ● ● ● ● ● ● ● ● ● ● ● ● ● ● ● ● ● ●● ● ● ● ● ● ● ● ● ● ● ● ● ●● ●● ●●● ●●● ●● ●● ●●●●● ●● ●● ●● ●● ●● ● ● ● ● ●● ● ●● ● ● ● ●● ●● ●● ● ●● ●● ●● ●● ● ●● ● ●● ● ● ●● ● ● ● ● ● ● ● ● ●●● ●● ●●● ●● ● ● ● ● ●● ●● ●● ●● ●● ●● ● ●● ● ● ●●● ●● ●● ●● ● ●● ●● ●●● ●● ● ● ● ● ● ● ● ● ● ● ● ● ● ● ● ● ● ●● ● ● ● ● ● ●●●●● ●● ●● ● ● ● ● ● ● ● ● ● ● ● ● ● ● ● ● ● ● ● ● ● ●●●●● ●● ●● ●● ●● ●● ●● ●● ●● ● ●● ●● ●● ●● ●● ● ● ● ● ● ● ● ● ●●●●●● ● ● ● ● ● ● ● ● ● ● ● ● ● ● ● ● ● ● ● ● ●● ● ● ● ● ●● ● ● ● ● ●● ● ● ● ● ● ● ● ● ● ●● ●● ●● ●● ●● ●● ●●● ● ● ●● ●● ●● ●●● ● ● ● ●● ● ● ● ● ● ● ● ● ● ● ● ● ● ● ● ●●● ● ● ● ● ● ● ● ●● ● ● ● ● ● ● ● ● ● ● ● ● ● ● ● ● ● ● ● ● ● ● ● ● ● ● ● ● ● ● ● ● ● ● ● ● ●● ●● ●● ● ●● ●● ●● ●● ●● ● ●● ● ● ●● ● ● ● ● ● ●● ●● ●● ● ●● ● ●● ● ● ● ● ●●● ● ●● ● ● ● ● ● ● ● ● ● ● ●● ● ●● ● ● ● ● ● ● ● ● ● ● ● ● ● ● ● ● ●● ●● ●● ●● ●● ●● ● ● ●●● ●● ● ●● ● ● ●● ● ●●●● ● ● ● ● ● ● ● ● ●● ● ● ●● ● ●● ● ● ● ● ● ● ● ● ● ● ● ● ● ● ● ● ● ●● ● ●● ●●● ● ● ●● ● ●● ●● ●● ●● ●● ● ● ● ●●●● ● ● ● ● ● ● ● ● ● ● ● ● ● ● ● ● ● ● ● ● ●● ● ● ●●● ● ● ● ● ●● ● ● ● ● ● ● ● ●● ●● ●● ●● ●● ●●●● ● ● ●● ● ●● ● ●● ●● ● ● ● ● ● ● ●● ● ● ● ● ● ●● ● ● ● ●● ● ● ● ● ● ●● ● ● ● ● ● ● ● ● ● ● ● ● ● ● ● ● ●● ● ●● ●● ●● ●● ●● ●●● ●● ●● ● ● ● ● ●● ● ● ● ● ● ● ● ● ● ● ● ● ●● ● ● ● ● ● ● ● ● ● ● ● ● ● ● ● ● ● ● ● ● ● ● ● ● ● ● ● ● ● ● ●●● ●● ●● ● ●●● ●● ● ● ● ●● ● ● ●● ● ●● ● ● ● ● ● ● ● ● ● ● ● ● ● ● ● ●● ● ● ● ● ● ● ● ●● ● ●● ●● ●● ● ●● ●● ●● ●● ● ●● ● ● ● ● ● ● ● ●● ● ● ● ● ● ● ● ● ● ● ●● ● ● ● ● ● ● ● ● ● ● ●● ●● ● ● ● ● ● ●● ● ●● ●● ●● ● ●● ●●●●● ●● ● ● ● ● ● ● ● ● ● ● ● ● ● ● ●● ● ● ● ● ● ● ● ● ● ●● ● ● ● ● ● ● ● ● ● ● ● ● ● ● ●● ●● ●● ●● ●● ● ●● ●● ● ● ● ● ● ● ● ● ● ● ● ● ● ● ● ●●● ● ● ● ● ● ● ● ● ● ● ● ● ● ● ● ● ● ● ● ● ● ● ● ● ●● ●● ●●●● ●● ●● ●● ●● ● ● ● ● ● ● ● ●● ● ● ● ● ● ● ● ● ● ● ● ● ● ● ● ● ● ● ● ● ● ● ● ● ● ● ● ● ●● ●● ●● ●●● ●● ●● ●● ●● ● ● ● ● ● ● ●●● ● ●● ● ● ● ● ● ● ● ● ● ● ● ● ● ● ● ● ● ●● ●● ●● ●● ●● ●● ●● ●● ● ● ● ● ● ●
0
10
20
30
40
50
● ●
60
Number of distinct coauthors
(b)
Figure 5: (a) Author influence vs. percent of papers published. (b) Author influence vs. distinct co-authors poorly on our validation task, identifying 2 or fewer winners. Closer inspection shows that perfectionism is not the key to success. The percentage of papers published in journals varied widely among award-winners, from 100% to 0%, although the top 50% of influential authors did have a higher rate (88%) of acceptance than the bottom half (67%). This is shown graphically in Figure 5a. Percentage of papers highly cited was better correlated with non-self citations (see Figure 5b), but the measure performed poorly because it placed authors with one of one paper highly cited above those with 19 of 20 papers highly cited. Figure 5b examines the correlation between citation count and number of coauthors. As pointed to earlier, authors with high citation counts write both frequently and widely. Even in the middle of the scale, collaborating with 10-15 other people is typical. However, anyone with over 30 coauthors is almost certain to be in the top 10%; presumably one must be extremely well-regarded to be in that kind of demand by collaborators. It is possible to have few co-authors and still receive very high citation counts. In the top 10% by non-self citation count, no one writes alone, and of the top 100 authors, only one (Donam Youm) has fewer than 10 distinct coauthors. Table 6 displays the authors with the highest co-author counts. We wondered if a different combination of features could identify a better measure of what differentiates award-winners from other authors. To do this, we built an RPT using the set of 55 award winners and a random sample of 55 nonaward winners. We performed 10-fold cross validation and achieved an average accuracy of 78% with an area under the ROC curve of 0.75. The tree chosen most frequently is shown in Figure 6. The first split in the tree, the author’s authority score, is
papers, if published at all, are published within one year of submission to arXiv . A small number are published up to 4 years later.
Author authority score > 5.3E-7 Y
N
Author has 0 non-self citations between 1995 - 2000
P(+) = 0.28
0.08
Density
0.04 0.00
0.0 1
2
3
4
5
6
7
8
9
10
0
Number of References
(a)
(b) Number of Pages Per Paper
0.06
0.08
Published Unpublished
0.04
0.02
Density
0.03
Published Unpublished
0.02
0.01
Density
0.04
0.10
0.05
0.12
Number of Pages Per Paper
0.00 0
10 20 30 40 50 60 70 80 90
0
Number of Pages
5.
(c)
PUBLICATION ANALYSIS
Influential authors are more likely to have their papers accepted by a journal. It is also clear from Figure 2 that published papers receive more citations. With this in mind, the third part of our analysis studied what other factors affected journal acceptance and used the RPT to predict journal acceptance as well as publication venue. Number of Papers Per Year
Publication Delay
10 20 30 40 50 60 70 80 90
Number of Authors
0.00
based on the authority score received when running the hubs and authorities algorithm over the undirected co-author graph.2 This roughly correlates with authors who co-author frequently and whose co-authors also co-authored frequently. Informed by the features in the tree as well as by our other analyses, we conjecture that some of the following highly cited authors, from the tops of the lists but relatively lacking in major awards, may soon be due for recognition: Andrew Strominger, Igor R. Klebanov, Ashoke Sen, Arkady A. Tseytlin, Paul K. Townsend, Gregory Moore, and Hirosi Ooguri.
Published Unpublished
0.02
0.5
Figure 6: RPT built to predict award-winning authors.
1.0
Density
Published Unpublished
0.06
P(+) = 0.81
0.10
0.12
References Per Paper
1.5
P(+) = 0.27
Authors Per Paper
2.0
N
Y
10
20
30
40
50
Number of Pages
(d)
Figure 8: Characteristics that differentiate published and unpublished papers. Figures a, b, and c are from all published and unpublished papers from 1995 to 2000 inclusive. Figure d is from a sample of 3000 papers (1500 published in Physics Letters B and 1500 unpublished).
●
●
●
●
●
●
●
1.5
● ●
●
2.0
Total Published
● ●
●
●
●
●
●
1.0
Density
● ● ●
●
●
0.5
Number of Papers
●
0
●
1992
1994
1996
1998 Year
(a)
2000
2002
0.0
500
1000 1500 2000 2500 3000
● ●
0
1
2
3
4
5
Years Between Submission and Publication
(b)
Figure 7: (a) Number of published and unpublished papers submitted to arXiv each year. (b) Number of years between a paper’s submission to arXiv and it appearing in a journal. Approximately 70% of the papers in arXiv have been published in a journal. Figure 7a shows the total number of papers submitted to arXiv each year for both published and unpublished papers. Although the total number of papers increases each year, the proportion of published and unpublished papers remains relatively constant. Figure 7b shows the distribution of the number of years between a paper’s submission to arXiv and it appearing in a journal. Most 2 This analysis applied the hubs and authorities algorithm to the undirected co-author graph. Hub and authority scores are equivalent on undirected graphs, and we choose to refer to the resulting scores as ”authority scores”.
We analyzed the differences between the published and unpublished papers in several ways and discovered significant effects. Several of these effects are shown in Figure 8. The most surprising difference is that published papers usually have more than one author while unpublished papers are much more frequently written by a single author. This is an example of degree disparity [4] , where the number of relations differs significantly between objects with different class labels. A second finding is that unpublished papers have fewer references on average than published papers. Last, is that published papers have more pages than unpublished ones. This correlates with the finding that published papers are revised more frequently. Likely, as a paper is revised, additional text is added and the number of pages grows. It is also possible that the unpublished papers are fleshed out to longer reports to send to a journal and then are more likely to be accepted.
5.1
Predicting Publication
For this task, we trained two types of relational models, RPTs and relational multiple-instance learning [9] (RMIL), to predict whether a paper will be published in a journal. As explained in section 3.3, our analysis is limited to papers submitted to arXiv from 1995 to 2000. To classify a paper, the models used only information available at the time that the paper was submitted. As a preliminary analysis, we attempted to differentiate between unpublished papers and papers published in Physics Letters B, the most common publication venue for
arXiv papers. We sampled a set of 500 papers per year (3000 total), with equal proportion of published and unpublished papers. Given the difficulty of this task, the RPT performed well, with an average of 68% accuracy and 0.75 area under the ROC curve. The model selected four attributes that discriminate between unpublished and published papers: the number of authors, the number of references, the paper’s length and the paper’s filesize. Figure 9a shows an example of a probability estimation tree learned by the algorithm. According to the model, published papers tend to have more authors and more references than unpublished papers, illustrated in Figure 8a and b. The algorithm also distinguished between published and unpublished papers by size, measured in both kilobytes (KB) and number of pages. Figure 8d shows the distribution of paper length for published and unpublished papers in our sample of 3000 papers. The graph clearly shows that most Physics Letters B papers are between 5 and 15 pages in length, whereas the unpublished papers have widely varying lengths. The tree (shown in Figure 9b) predicts that papers over 16 pages in length and at least 13K in size were unlikely to be published (P(+)=0.03). After browsing a small subset of these papers on arXiv , it appears that the unpublished papers in the sample are either workshop papers (short papers, few references) or theses (long papers, a single author). We also trained an RPT on the entire set of published and unpublished papers, and had moderately successful results (0.70 area under the ROC curve). The sample for each year had between 2300 and 3100 papers, and approximately 75% of the papers each year are published. The algorithm learned similar trees as the one learned for the previous task. As shown in Figure 8c, paper length is not as discriminative in this larger sample, which perhaps explain the lower performance on this larger set. For RMIL, we created random samples of 200 papers (100 published and 100 unpublished papers) per year. RMIL achieved an accuracy of 61% with an average AUC of 0.61. RMIL identified that papers with 2 authors, papers that cited papers published in Nuclear Physics B, and papers that were cross-posted to areas other than hep-th were all more likely to be published.
5.2
Predicting Publication Venue Past papers prop(Phys D) > 0.5
Paper num pages > 16 Paper KB > 13 Y
Y
Y
P(+) = .73
Y
P(+) = .14
N
P(+) = .59
N
N
P(+) = .37
Paper num pages > 14
P(+) = .14 Y
Paper num pages > 14
P(+) = .84
(a)
Y
P(+) = 0.44 N
Y
N
P(+) = .00
Cited paper prop(Phys B) > 0.5 Y
N
Paper num authors > 1
N
Cited paper prop(Phys B) > 0.6
Paper num refs > 6
N
Paper num refs > 6
P(+) = .03
Y
N
Y
N
Count(cited paper) > 0 with non-empty area field Y
P(+) = 1
P(+) = .28
N
P(+) = .81
Count(past paper) > 4 with num refs > 3 Y
P(+) = .63
N
P(+) = .1
(b)
Figure 9: (a) RPT to predict whether a paper will be published in Physics Letters B. (b) RPT to predict between two popular journals. We also trained an RPT for a related task, to differentiate between papers published in one of two popular journals (Nuclear Physics B. Particle Physics, Field Theory and Statistical Systems, Physical Mathematics and Physical Review
D. Particles, Fields, Gravitation, and Cosmology). These are two of the most prevalent journals in the arXiv database. We expected this task to be challenging because approximately 55% of the papers were written by authors who have publications in both journals. For each year, we sampled a set of 480 published papers, half of which were published in Nuclear Physics B and half in Physical Review D. For this task, RPTs achieved an average accuracy of 73% and an average AUC of 0.81 (see Table 8 for complete results). An example tree is shown in Figure 9b. The authors’ publication history, the cited papers, and paper length are useful features to differentiate between papers published in these two journals. For example, if over 50% of an author’s past papers were published in Physics Letters D, and less than 60% of cited papers were published in Nuclear Physics B, then the paper is unlikely to be published in Nuclear Physics B (P(+)=0.14).
6.
COMMUNITY ANALYSIS
The final part of our analysis focused on identifying research communities by identifying groups of topics and the authors who publish in those topics. Our first approach to community detection was to use a conventional data clustering algorithm that considered only the paper’s textual information for grouping papers into topics. However, research papers contain multiple sources of information for identifying topics; both textual content and citation structure can be used for clustering the documents. Our second approach used a clustering algorithm that combined citation structure and data information. Our third approach to clustering examined the topics formed naturally by considering the papers associated with each journal as distinct topics. For the text-only clustering, we clustered according to a TFIDF based measure of document similarity. The clustering algorithm is based on an extension to the Lemur Toolkit3 . We created six clusterings using both the full paper text and the abstracts and varying the similarity threshold. The resulting topics have higher intra-cluster citations than expected by chance (i.e. papers cite papers within the same topic more often than papers in other topics). However, the topic labels are not autocorrelated through journals or authors. Since we expect authors and journals to publish papers from a relatively small set of topics, we view this lack of autocorrelation as evidence of poor topic detection and focused on using the relational citation information to produce better clusters. Research topics should be identifiable through groups of papers with similar terms and many intra-group citations. The web retrieval community has proposed a number of clustering algorithms that attempt to exploit both document contents and link structure to automatically group web documents into topics. One approach is to define a new similarity metric between documents that incorporates link structure and then use standard data-clustering algorithms (e.g. [16], [10]). Another approach is to weight the web graph with term similarities and use conventional graph clustering algorithms (e.g. [2]). We use the latter approach to cluster hep-th research papers. We based our second approach on previous work by [15] on spectral partitioning algorithms using a normalized cut objective function. We use the citation graph to cluster papers, 3
For more information, see http://ciir.cs.umass.edu
but modulate the strength of citation relationships by the semantic relationship indicated through content similarity. Our algorithm is quite similar to the approach used by [2] to identify topics in sets of retrieved web pages. However, they incorporate additional non-local link information into their similarity metric through summary co-citation information. We expect our algorithm to identify communities: groups of papers that have similar content and are also highly interconnected. We clustered a sample of 833 papers from the hep-th database containing all papers in the years 1995-2000 with more than 50 non-self citations. Our intention was to sample a small set of authoritative papers that are likely to define topics. The algorithm used the portion of the citation graph that involved the 833 papers, weighted by the cosine similarity between paper abstracts. Journals may be useful for detecting topics because it is common for journals to specialize and focus on research in specific sub-fields. To investigate this, we examined the 20,826 papers in hep-th that have journal information available and clustered those papers into distinct topics as determined by journal of publication. We eliminated clusters that were too small to represent meaningful topics by requiring that clusters contained at least 0.05% of the papers in the collection.
Table 8: Example paper titles grouped together by spectral clustering. The authors shown are those with the highest number of non-self citations to papers in the cluster (with this number in parentheses). are listed along with authors in Table 8.
200 50
50
100
150
Authors
150 100
Size
200
250
250
Community detection
0
The spectral clustering technique, which examines both content and citation information, produced 14 clusters varying in size from 2 to 285 papers. The number of papers in each cluster is shown in Figure 10A. Table 8 includes randomly selected titles from four examples clusters for subjective evaluation. Our goal in this task was to identify communities of research. Authors write multiple papers on the same topic and are more likely to collaborate with other authors from the same community. Journals generally focus on a small number of topics and often specialize in particular topics. Because of this, we expect research communities should be identifiable through authors and journals, in addition to papers. As a preliminary assessment of topics detection, we evaluated the correlation of clusters labels through authors and journals. Paper topic is correlated with journal (corr=0.58). Paper topics are autocorrelated through journals (corr=0.56) and through authors (corr=0.54). These correlations indicate that topics are associated with particular journals, that journals are associated with particular topics and that authors are associated with particular topics. This is evidence that the topics successfully identify communities of research. Figure 10b illustrates the autocorrelation of topic through authors graphically, plotting the number of distinct topics per author. These data are measured over all 478 authors associated with the sample of 833 papers. Because topics are autocorrelated through authors, we can use the clusters to naturally partition the authors into communities as well. To cluster the authors in relation to the paper clusters, we assigned each author to the their most prevalent cluster based on authorship. Ties were broken randomly. Each cluster in Table 8 is labeled with the most authoritative author associated with the cluster. We associated journals with topics in the same way, assigning each topic to its most prevalent journal. The associated journals
0
6.1
Cluster 2 : Sumit R.Das (251), Physical Review D Absorption of Fixed scalars and the D-brane Approach to Black Holes; Universal Low-Energy Dynamics for Rotating Black Holes; Interactions involving D-branes; Black Hole Greybody Factors and D-Brane Spectroscopy Cluster 7 : Gary T.Horowitz (588), Physics Letters B On D-Branes and Black Holes in Four Dimensions; The Black Branes of M-theory; Counting States of NearExtremal Black Holes; Internal Structure of Black Holes Cluster 10 : Juan M. Maldacena (1924), Journal of High Energy Physics Field theory models for tachyon and gauge field string dynamics; Super-Poincare Invariant Superstring Field Theory; Level Four Approximation to the Tachyon Potential in Superstring Field Theory; SO(32) Spinors of Type I and Other Solitons on Brane-Antibrane Pair Cluster 13 : Ashoke Sen (4683), Nuclear Physics B Dynamics of Anti-de Sitter Domain Walls; Gravitational Stability and Renormalization-Group Flow; String Theory on AdS3 ; The Holographic Bound in Anti-de Sitter Space
2
4
6
8
10
12
Cluster
(a)
14
1
2
3
4
5
6
7
8
Number Distinct Topics
(b)
Figure 10: (a) number of papers per cluster, (b) Association of authors to paper clusters.
6.2
Topic analysis
We analyzed the topic clusters in several ways. We expect authors to cite papers within their own topic more than papers outside of the topic. For each of our topic clusterings, we calculated the actual and expected proportion of intra-cluster citations for each cluster. We define the actual proportion of intra-cluster citations for a cluster, C, as: #of citations from C to C . the total number of citations from cluster C We define the expected proportion of intra-cluster citations for a cluster, C, as: the total number of papers in cluster C . the total number of papers in the collection The expected proportion represents the proportion of intracluster citations we would expect given a uniform clustering across all topics. Figure 11a shows the expected and actual intra-cluster citation proportions for the spectral clustering. For all but
2
4
0.3 0.2
Actual 0.0
Expected
0.1
Proportion of Intra−Journal Citations
0.6 0.4 0.2
Actual
0.0
Prop. Intra−Cluster Citations
0.4
the smallest cluster, the proportion of intra-cluster citations is significantly higher than the expected values. This is not surprising, since the spectral algorithm is designed to minimize the normalized weighted-cut across clusters. We also calculated intra-journal citations in a similar manner. Figure 11b shows the expected and actual intra-journal citation proportions for each journal. As with the topic clusters, the actual intra-citation values deviate significantly from the expected values.The difference between the actual and the expected intra-clustering values demonstrates that the topics are cohesive with respect to citation patterns.
6
8
10
12
14
Expected 0
10
20
Cluster
30
40
50
Journal
(a)
(b)
0
4
0.6 0.4
Expected
0.0
All papers
2
Actual
0.2
Prop. Intra−Cluster Coauthor Links
60 40
Intra cluster
20
Average Cosine Similarity
80
0.8
Figure 11: (a) Expected and actual intra-clustering citation ratios for spectral clustering (b) Expected and actual intra-journal citation ratios.
6
8 Cluster
(a)
10
12
14
2
4
6
8
10
12
Collaboration is significantly higher with these clusters than would be expected by chance. This result further validates the claim that the spectral clustering has successfully identified research communities.
7.
CONCLUSIONS
Based on our analysis, theoretical high-energy physics appears to be a healthy scientific community. Both the citation and authorship graphs reflect a pattern of tightly knit communication via the formal and informal scholarly literature. The community publishes a large numbers of papers, and the temporal pattern of citations indicates the rapid uptake and use of relevant new work. Despite the existence of “stars” such as Edward Witten, the papers of individual authors can vary greatly in their authority scores, indicating that papers are cited more for their innovative content than the pre-existing prominence of their author. This analysis raises the possibility, already explored by the field of scientiometrics [14], of assessing and comparing the health of different scientific communities and subcommunities. The statistical techniques under development within relational learning offer an improved toolbox for the study of scientific networks, particularly as reflected in patterns of publication, citation, and downloading. Central to our analysis in this paper were: 1) techniques for calculating measures that use a combination of the attributes and structural of a relational data set; and 2) algorithms for learning statistical models that search a vast space of possible structures and parameter values to select those features most predictive of an attribute of interest. Both of these classes of methods allowed simultaneous consideration of multiple object and relation types, rather than only a single object and relation type, as is common in much prior work in citation analysis. Finally, consolidation of authors was important to the analysis above, and the relational structure was a strong contributor to how authors were consolidated.
14
Cluster
(b)
Figure 12: (a) Intra-cluster document similarity (b) Intra-cluster coauthor frequency. To evaluate intra-textual similarity we averaged the cosine similarity across all pairs of documents within each cluster. As a baseline measure we averaged the cosine similarity between papers in a given cluster and all papers in the sample. Figure 12a plots the intra-cluster averages compared to the averages considering papers outside the cluster. For all but the largest cluster, the intra-cluster cosine similarity is much higher than expected, demonstrating that the topics are cohesive with respect to content. Average similarity may not the best measure to evaluate large clusters. Even when drawn from the same topic, it will be unlikely that all pairs of papers have similar content. To evaluate whether the authors are more likely to collaborate within the clusters, we analyzed the coauthor links within clusters to see if the proportion of coauthor links within clusters was higher than expected. Figure 12b shows the expected vs. actual proportion of intra-cluster coauthor links. The zero value for cluster 4 is due to the fact that no authors were assigned to cluster 4 as their primary area.
Acknowledgments We thank Hannah Blau for her comments and Daniel Larson for domain knowledge contributions. This effort is supported by DARPA, AFRL, and NSF under contract numbers F30602-00-2-0597, F30602-01-2-0566,and EIA9983215. The U.S. Government is authorized to reproduce and distribute reprints for governmental purposes notwithstanding any copyright notation hereon. The views and conclusions contained herein are those of the authors and should not be interpreted as necessarily representing the official policies or endorsements either expressed or implied, of DARPA, AFRL, NSF or the U.S. Government.
8.
REFERENCES
[1] H. Goldberg and T. Senator. Restructuring databases for knowledge discovery by consolidation and link formation. In Proceedings of the First International Conference on Knowledge Discovery and Data Mining. AAAI Press, 1995. [2] X. He, C. H. Q. Ding, H. Zha, and H. D. Simon. Automatic topic identification using webpage clustering. In ICDM, pages 195–202, 2001. [3] D. Jensen and J. Neville. Linkage and autocorrelation cause feature selection bias in relational learning. In
[4]
[5]
[6]
[7]
[8]
[9]
[10]
[11]
[12] [13] [14]
[15]
[16]
Proc. of the 19th Intl Conference on Machine Learning, pages 259–266. Morgan Kaufmann, 2002. D. Jensen, J. Neville, and M. Hay. Avoiding bias when aggregating relational data with degree disparity. In Proc. of the 20th Intl Joint Conf. on Machine Learning, 2003. R. Kanigel. Apprentice to Genius: The Making of a Scientific Dynasty. Johns Hopkins University Press, 1993. J. M. Kleinberg. Authoritative sources in a hyperlinked environment. Journal of the ACM, 46(5):604–632, 1999. P. Lazarsfeld and R. Merton. Friendship as social process: A substantive and methodological analysis. In M. Berger et al. (eds.), Freedom and Control in Modern Society. Octagon, New York”, 1964. A. Lotka. The frequency distribution of scientific productivity. Journal of the Washington Academy of Sciences, 16:317–323, 1926. A. McGovern and D. Jensen. Identifying predictive structures in relational data using multiple instance learning. In Proceedings of the Twentieth International Conference on Machine Learning, 2003. D. S. Modha and W. S. Spangler. Clustering hypertext with applications to web searching. In ACM Conference on Hypertext, pages 143–152, 2000. J. Neville, D. Jensen, L. Friedland, and M. Hay. Learning relational probability trees. In Ninth ACM SIGKDD International Conference on Knowledge Discovery and Data Mining, 2003. V. Pareto. Le Cours d’Economie Politique. Macmillan, London, 1897. L. Sachs. Applied Statistics. Springer-Verlag, 1982. Scientometrics: An international journal for all quantitative aspects of the science of science, communication in science and science policy. Kluwer Academic Publishers, Dordrecht, The Netherlands. J. Shi and J. Malik. Normalized cuts and image segmentation. IEEE Transactions on Pattern Analysis and Machine Intelligence, 22(8):888–905, 2000. R. Weiss, B. Velez, M. Sheldon, C. Namprempre, P. Szilagyi, A. Duda, and D. Gifford. Hypursuit: A hierarchical network search engine that exploits content-link hypertext clustering. In ACM Conference on Hypertext, Washington USA, 1996.
APPENDIX A.
CREATING THE SCHEMA
The data available for task 4 was in the form of LATEX files, text abstract files, and the paper citations. From the abstract files, we extracted paper properties such as title, file size, journal reference, and submission dates. We used the earliest of the revision dates and the SLAC date as the best estimate of authorship date. Author names and institutions were parsed out of the Authors field, and the email address of the submitter was associated with the best-matching author name. Since institutions were not in a standardized format, we used the domain name of the submitter email address as a surrogate. Since the same authors, journals, and domains appear many times, we pulled them out into separate objects. Journals were consolidated by hand; that is, we looked up their full names from the abbreviations, and coalesced differentlyspelled references into the same object. The domains were given
Author 3
Co-Authored
Paper 1
Co-Authored
Cites
Paper 2
Authored
Authored
Author 1
Author 2
similar_email_domain Email Domain 1
Email Domain 2
Email_affiliation Author 1
Author 2 similar_name
(a)
similar_name
Email_affiliation
same_username Author 1
(b)
Author 2
(c)
Figure 13: Relational evidence of duplicate authors. (a) Authors with a similar name who have co-authored with the same third-party. (b) Authors who have cited a paper written by an author with a similar name. (c) Authors with similar email domains and the same username. similarity links based on matching suffixes to facilitate identifying distinct institutions, and for use during author consolidation. We performed a nominal amount of hand data cleaning to correct for spelling errors or problems in formatting from the original submission form.
B.
AUTHOR CONSOLIDATION
Before analyzing the authors, we needed to identify duplicate author entries. Many hep-th authors publish under variants of the same name, e.g., “E.M.C. Abreu” and “Everton M.C. Abreu”; with other pairs like “J. Adams” and “J.A. Adams”, the number of distinct identities was unclear. We began with the assumption that no two people had submitted papers under the same name (although this is rare, we did find a small number of instances in hand-checking the most frequent last names). We labelled pairs as similar if, after correcting for inconsistencies in punctuation and accents, the last names and the first initial of the first names matched. Of the initial 13,185 distinct author names, over 7500 had candidate matches to others. Possible evidence for duplicate authors came from several sources. First, authors had to have similar names, and co-authors could never be consolidated. Another piece of evidence arose from author email addresses: using the same email address for multiple papers meant the authors were likely to be the same person. This was not conclusive evidence, because we found instances of people sharing email addresses. If a candidate pair’s last name was rare (i.e. of the whole database, was only found on these two people), this boosted the evidence. For example, a number of people matched on the last name “Lee”, but the only two authors with the last name “Znojil”. We also identified evidence for duplicate authors based on the relational neighborhood of the authors, as depicted in Figure 13. If two authors with similar names had each coauthored with the same third person, the two were likely to be the same person. Similarly, since people frequently cite their own work, we reasoned that if an author cites someone with a similar name, the two may well be the same person. Last, if two authors had the same username at similar email domains, this was considered to be comparable to using the same email address. Using these guidelines, we iteratively identified and consolidated duplicate authors until quiescence. Because evidence involving third party authors was often not available until the third parties had themselves been merged correctly, this took five rounds of consolidation. At completion, we had 9200 distinct authors. Due to the noisy nature of the data, the final author set is not likely to be perfectly accurate, but as an example, it correctly merged all eight variations of the name “Ian Kogan,” and of the top ten authors from Table 7, they were spread across 11 author objects (i.e. one mistake) instead of an initial 28. In addition, while the initial author graph contained 2206 connected components, after consolidation that number decreased to 1269.