tools to complex graphical programs and web-services. Fur- thermore, data analysis often requires to link the primary microarray data with information stemming ...
Exploiting Scientific Workflows for Large-scale Gene Expression Data Analysis Alessandro De Stasio1,2 , Marcus Ertelt3 , Wolfgang Kemmner4 , Ulf Leser3 , Michele Ceccarelli2,5 1 Unlimited Software S.r.l., Naples, Italy 2 Research Center on Software Technologies-RCOST, University of Sannio, Benevento, Italy 3 Humboldt-Universit¨at zu Berlin, Germany 4 Max-Delbr¨uck-Centrum Berlin, Germany 5 Biogem, Ariano Irpino (Avellino), Italy
Abstract Microarrays are state technologies of the art for the measurement of expression of thousands of genes in a single experiment. The treatment of these data are typically performed with a wide range of tools, but the understanding of complex biological system by means of gene expression usually requires integrating different types of data from multiple sources and different services and tools. Many efforts are being developed on the new area of scientific workflows in order to create a technology that links both data and tools to create workflows that can easily be used by researchers. Currently technologies in this area aren’t mature yet, making arduous the use of these technologies by the researcher. In this paper we present an architecture that helps the researchers to make large-scale gene expression data analysis with cutting edge technologies. The main underlying idea is to automate and rearrange the activities involved in gene expression data analysis, in order to freeing the user of superfluous technological details and tedious and errorprone tasks.
1. Introduction The study of gene expression is a very active research area in Genomics and Bioinformatics. Gene expression is the process by which inheritable information from a gene (the DNA sequence) is turned into a functional gene product (protein or RNA). Microarrays are the state -of -the art technology for the measurement of the expression of thousands of genes in a single experiment. The analysis of microarray experimental data is typically performed with a wide range of tools, ranging from simple command-line tools to complex graphical programs and web-services. Furthermore, data analysis often requires to link the primary microarray data with information stemming from other experiments or from databases. The integration of different
types of data from multiple sources using into a data set that has to be analyzed with heterogeneous tools is a well known, yet unsolved, issue [9]. The “cut and paste” approach, which still is the predominant mode of working for the average biological researcher, is error-prone and tedious, especially for large amounts of data. Moreover, it requires some programming skills which most researchers do not have, e.g. the statistical programming environment Bioconductor [6] (based on R) offers an extensive and flexible set of tools, but also has a high startup/learning cost. There is a clear need for technologies linking both data and tools through workflows that can be used easily by welab researchers. Such technologies are generally called Scientific Workflow Management Systems (sWFMS). Many efforts are currently on the way to develop such systems, such as Triana [17], Kepler [10] or Taverna[18]. However, in those systems a researcher still has to deal with technological details, e.g., the workflow concepts and web services with their binding and their limitations. Another problem is the platform on which the WFMS runs. Thus, a researcher that wants to perform an analysis on microarray data typically must: (1) Select and retrieve an appropriate workflow from a remote repository, (2) access/start the WFMS and interact directly with him, (3) retrieve the data to be analyzed from a microarray database or a file system, (4) launch the workflow and (5) analyze the results. However, we argue that for most scenarios the phases of workflow selection and data retrieval could be automatized, and that it is possible to provide an easy to use interface that completely hides the underlying details. These issues are expanded and analyzed in this paper. We present an architecture that helps a researcher to perform large-scale gene expression data analysis with cutting edge technologies using a simple graphical interface. The objective is to facilitate the use of analysis workflows for microarray experiments by wrapping all its components, such as a workflow repository, a set of data sources and
Figure 2. The state of the art for Bioinformatics tools.
Figure 1. Microarray Data Analysis steps.
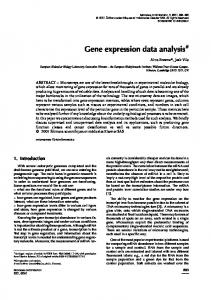
analysis tools. Particular attention was given to the models of implementing data transfers between the various components.
2. Microarray Data Analysis A Microarray contains up to several thousands of fragments of DNA [13]. Each fragment is a probe for capturing the expression of a gene. Each probe will hybridize with a specific sequence of complementary RNA. The genes extracted from the tissues to be studied are first labeled with fluorescent dyes and then hybridized to the array. The genes which are more activated will be evident on the array as they will light up. Biological studies are aimed at explaining how the genes are differentially expressed under different conditions, e.g., by comparing healthy and sick tissues, or treated and not treated tissues.
Figure 3. The adopted architecture.
represented with its spatial coordinates and its expression value. File size changes according to gene numbers and array design (e.g., for a chip with 40.000 probe set/genes, the intensity file has about 450.000 probe expression values). Then a gene (probe set) level summarization is performed resulting in a binary file which contains probe set expression values and quality control data [15]. Thereafter, further analysis steps are performed and according to them, many different file formats may be created. Usually the output is an annotated gene file where genes are associated with statistical significance score and further information on the gene. This typically contains 1.000 genes with 10 attributes.
2.1. Microarray Data Analysis Workflow The primary result of a microarray experiment is a digital image, which is only a rough and indirect picture of how the genes in a given tissue or culture are expressed. After a series of analysis steps a clear result relating the observation to the phenomenon to be studied is produced. An exemplary (and very generic) such workflow is depicted in Figure 1. The Preprocessing step involves the generation of gene expression values from the raw image [11]. The step consists of three phases which are background correction, normalization and summarization. The filtering step filters out uninteresting or very low expression values [2]. The successive step is Significance, where differences in expression are tested for statistical significance [7]. Thereafter, a number of further steps are possible, such as supervised (classification) or unsupervised learning (clustering). Finally, the list of significantly expressed genes needs to be combined with information from other biological databases.
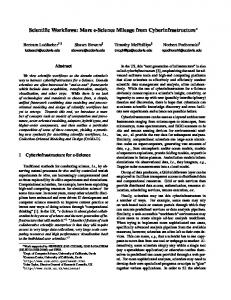
3. Bioinformatic Tools All of the steps described above may be performed with different tools: command-line tools, web services, packaged applications, spreadsheets etc. However, today most methods are also available in BioConductor [6], a suite of programs for the R system. R is a language and environment for statistical computing and graphics. BioConductor is an open-source software project for the analysis and comprehension of biomedical and genomic data. Figure 2 gives an overall picture of the current usage of WFMS for gene expression analysis. Raw and preprocessed data is often stored in microarray databases. These may be public repositories, like ArrayExpress [16], GEO [1] or systems that are installed locally, like BASE2 [8]. Analysis programs are available as web services, for instance through the BioMoby suite. Tools that are available only at the command-line, such as R/BioConductor, may be
2.2. Microarray Data: Type and Size The output of low level analysis performed on the image file is an intensity file (e.g., CEL file) where every probe is 2
wrapped by SoapLab [14], which puts a web service interface to them. All these services are managed and coordinated by a sWFMS. Various WFMS have been described in the literature, such as Kepler, Taverna, Triana. In this work, we only consider Taverna; for a detailed survey on the strengths and weaknesses of the other systems, see [3].
was chosen for a prototype implementation. Services Provider This component is revised version of the system described in [5]. We use SoapLab to access R scripts as web services. Another service is used that handles data transferring from data sources (e.g. a microarray database) to data consumer (e.g. a Services Provider). Data transfer is modelled as a proper workflow task (see below). Microarray Database It could be any database with a programmatically interface. In our prototype implementation, we use BASE2. Client We developed a proper client. This decision was partly based on the experience that, despite the powerful GUI Taverna is offering, the average user does not want to be confronted with workflow models. Instead, it is much faster to have a simpler, lab-tailored small application which displays only few pre-selected workflows from the repository to the user and encapsulates all further interactions into a proper GUI. Furthermore, data selection is also performed through this interface, which means that it offers a single point of access to the researcher.
3.1. A Typical Use Case In a setting as sketched in Figure 2, a researcher that wants to perform an analysis on microarray data must: 1. Retrieve the needed workflow. Find the appropriate workflow in a, public or private, workflow repository. This task may also involve small changes to or configuration of an existing workflow. 2. Access/start the WFMS. Access to the host on which the WFMS runs (researcher’s laptop, a specific computer in its research center or, in few cases, a remote computer accessed via web). 3. Retrieve microarray data. Find all needed raw data files (e.g. CEL files for a Quality Control experiment in a microarray analysis). Usually they are downloaded from a database.
4.1. Walk through A researcher goes on web and downloads the client application. The application starts and Client retrieves the preselected workflows from the WFMS Service Provider (WFMS-SP) (see Figure 4 (a)). User selects a workflow from the retrieved list; then, the Client connects again to the WFMS-SP and retrieves the list of parameters of the workflow (b). Often this task involves the connection to a database instance for select one or more raw data files on which analysis should be performed. So the Client connects to a BASE2 instance by the user and retrieves the list of available data sets. Only identifiers and connection parameters are transferred from Client to WFMS-SP and from WFMS-SP to Services Provider (c). Researcher specifies the appropriate parameters and launches the workflow. The WFMS performs the setup phase that involves the download of files from BASE2 according to the connection parameters and the identifiers given (d). All analysis steps of the workflow are performed and finally the results are sent to WFMS. They are rearranged, compressed, and finally sent to the Client and displayed (see Figure 4 (e) and (f)).
4. Launch the workflow and analyze the results. The researcher launches the workflow and analyzes the results; possibly re-performs the analysis modifying parameters and/or data. In this typical use case some critical issues can be identified. First, the researcher need to perform all tasks manually using different tools, which requires great effort and is error-prone and tedious. Second, the phases of choosing a workflow and retrieving data could be substantially reduced in complexity if the lab environment of the researcher is taken into account. Third, the researches has to use different interfaces, while it would be more comfortable if all functions would be available through a single and homogeneous interface which should completely hide the underlying technological details. Finally, it would be advantageous if such an interface could be accessed remotely through a programmatic interface.
4. The Proposed Architecture
4.2. Modeling Data Transfer (DT)
We developed a new architecture to microarray analysis using a sWFMS. It is depicted in Figure 3. It consists of the following components: WFMS Service Provider It is composed by a WFMS, a workflows repository, and a wrapper offering a programmatic access to the services offered by the WFMS. For reasons described in [12], Taverna
Microarray studies generate and analyze large amount of data. Experiment often consist of several hundreds of megabytes of measurements. Indeed, the data transport problem still is one of the main questions to be addressed in developing an architecture for large scale scientific data 3
(a)
(b)
(c)
(d)
(e)
(f)
Figure 4. Microarray analysis using our system (a). User selects a workflow from a pre-selected list. (b) Client retrieves the list of parameters of the chosen workflow and lets the user chose proper values through a GUI. (c) Client connects to a BASE2 instance and retrieves list of available data sets. (d) Researcher launches the workflow. This triggers a setup phase where the Service Provider retrieves the chosen data from the database. (e) The WFMS orchestrates data analysis. (f) Final results are retrieved and returned to the Client for display.
through the WFMS, but also it needs a service wrapper on each “analysis” machine. Explicitly modeling DT A fourth method is the explicit modeling of data transfers as a workflow task in its own. This approach was chosen in the system described here. A special task (“setup”) is modeled at the start of the analysis workflow and implemented through a script which runs on the machine performing the analysis. This script obtains the data sets to be analyzed from its input parameter, and stores them in a workflow instance-specific working directory. All tasks later in the workflow pass their data as files in this directory. A final step in the workflow cleans the working directory and transfers the final result back to the client. This approach offers good performance with low development cost. But there are also some drawbacks: data transport has become a side effect of task invocation, so it cannot be monitored, optimized etc. by the WFMS; furthermore, the workflows become cluttered with administrative tasks. Finally, the approach only works if all analysis is performed on the same machine, which impedes parallelization and load distribution at the workflow level.
analysis. There are various possible approaches; we discuss them in detail in [12] and only give a short survey here. DT through service invocation Data are passed as parameters to the programs that perform the analysis steps. This is the most straight-forward and simple model. However, it implies that a large amount of data must be exchanged between the various analysis procedures. Furthermore, all data must be passed through the WFMS, which often causes memory problems. DT through handle passing Using data handles removes the problem of memory overflow. However, it does not help with the problem of sending large amounts of data back and force between a tasks implementation and a server as many analysis steps transform the data. These transformed data sets must again be transfered to the next step. DT through stateful sessions Another possibility would be to use stateful sessions. This would require the development of a suitable wrapper around each integrated service which is able to recognize the session encoded in a call and to provide the data attached to the session. This mechanism avoids both the multiple passing of data across the network and the necessity to pipe data
4
5. Microarray Workflow Design An analysis of the actual analysis workflows performed in our labs identified the following fundamental steps [4], [5]: (1) Setup, which including identifying the data sets to be analyzed and preparation of R, (2) quality control, which includes certain tests to ensure that data is comparable and not badly influenced by technical or biological problems, (3) preprocessing, which comprises background correction, normalization, and summarization and produces gene-specific signals, and (4) data analysis, which performs one of the three tasks described in Section 2.
Figure 5. The workflow affy Expressions LIMMA.
5.1. Exemplary Workflow An exemplary workflow, affy Expressions LIMMA, is shown in Figure 5. This workflow moves the CEL files from a microarray database to the server, loads them into R, normalizes them according to a method selected by the user, and then runs a moderated t-test with multiple testing correction to find genes of interest . The Setup, Affy Preprocessing and Classification boxes are nested workflows: they are expanded in Figures 6, 7, 8 and will be described below. The last one, cleanup, is responsible for deleting all files in the working directory. Setup During the Setup (see Figure 6) all necessary actions are taken to prepare for the later analysis. This includes initializing R by starting it, loading the data, transforming it into a R workspace and storing it for the subsequent steps. Each of these steps calls R, loads the workspace, performs its calculations and saves the results together with a new version of the workspace. The output is a string that indicates the working directory for the following steps. Affy Preprocessing This sub-workflow (see Figure 7) performs preprocessing for Affymetrix data. Three preprocessing methods are implemented, i.e. RMA, GCRMA, MAS5. Each of them is encapsulated into a single R function, each comprising a different method for normalization, background correction, summarization, and PM-correction. It is possible to manually decide which method should be used at every step, e.g. use the RMA method for normalization, but the MAS5 method for background correction. Finding differentially expressed genes with LIMMA The processor limma ebayes performs a statistical test between known groups of genes, see Figure 8. With the parameters it is possible to adjust the parameters of the test. For instance, “mode” specifies whether an all-pair-wise or a simple comparison should be conducted. The follow-up processors produce and return different representations of the result of the test (Venn-Diagrams, heat maps, tables).
Figure 6. The Setup sub-workflow.
Figure 7. Preprocessing for Affymetrix chips (image trimmed).
Figure 8. Finding differentially expressed genes with LIMMA.
6. Performance Evaluation We describe here an installation of our system in Biogem’s Bioinformatics laboratory. The system runs on a Hewlett Packard Compaq ProLiant 8500R Server with 8 processors Pentium III Xeon 550 MHz with 4GB of main memory. The servers run a BASE2 database and two virtual machines for the WFMS SP and the Service Provider. The launch is the most expensive functionality in terms of execution time. Therefore is interesting to analyze it in more detail. We examine three steps in more detail: (1) The 5
setup sub-workflow. This time includes the time needed to connect and download the files from the database; (2) The analysis steps. This is the time needed for executing the analysis (e.i. the other sub-workflows); (3) The passing back of the results. Total launch time is defined as the instant when the incoming request is received and the instant when the outcoming response is sent. A small benchmark was performed, using a representative workflow, affy Expressions LIMMA. We used two datasets. The simple set consists of 6 CEL files (∼70 MB), and the medium set consists of 12 CEL files (∼140MB to execute the analysis and to perform the setup step. Simple Medium
Total ∼110sec ∼150sec
Setup 10% 15%
Analysis 89% 84%
[2] Calza S, R.W., Ploner A, Sahel J et al. Filtering genes to improve sensitivity in oligonucleotide microarray data analysis. Nucleic Acids Res., 35(16), 2007. [3] Deelman E., et al. Workflows and e-Science: An overview of workflow system features and capabilities. Future Generation Computer Systems, 2008. [4] A DeStasio. Architectures and tools for large-scale gene expression data analysis. Master’s thesis, University of Sannio, Italy, 2008. [5] M Ertelt. Design of a scientific workflow for the analysis of microarray experiments with taverna and r. Master’s thesis, Humboldt-Universit¨at zu Berlin, Faculty of Natural Science - Department of Computer Science, 2007. [6] Gentleman R.C. et al. Bioconductor: open software development for computational biology and bioinformatics. Genome Biol., 5(10):R80, 2004.
Decoding 1% 1%
[7] GW Hatfield, P Baldi. Differential analysis of DNA microarray gene expression data. Mol Microbiol, 47(4), 2003.
7. Conclusion And Future Works
[8] L H Saal, C Troein, J Vallon-Christersson et al. BioArray Software Environment (BASE): a platform for comprehensive management and analysis of microarray data. Genome Biology, 2002.
The treatment of gene expression data resulting from a microarray experiment are typically performed with a multitude of heterogeneous tools. Some of them offer extensive functionalities, but these usually require a high startup/learning time. Others only implement a single small function, and connecting them requires programming skills or tedious manual work. The need for a technology that links both data and tools has triggered the Bioinformatics community to investigate Scientific Workflow intensively. We presented that focuses on automizing and simplifying tasks involved in large-scale gene expression experiment. Using our approach, researchers may perform such analysis using only an user-friendly and light-weight client application. All technological details are hidden. The performance evaluation shows that execution times are favorable despite the underlying complexity of the infrastructure. The actual workflows use a static binding to the Services Provider, while it would be preferable a dynamic binding based on availability, load balancing and/or others criteria. Another challenge is the development of ex-novo workflows for large-scale gene expression analysis: several issues are involved, e.g. limitations correlated with cutting edge technologies and with the lack of standards, but also the need of tools for service discovery and data adapting. Availability and Requirements Project details are available on our Bioinformatics Team web site http://bioinformatics.biogem.it. It is also possible to freely try the architecture, using the Client component provided as a Java Web Start application.
[9] Li P., et al. Performing statistical analyses on quantitative data in Taverna workflows: an example using R and maxdBrowse to identify differentially-expressed genes from microarray data. BMC Bioinformatics, 9:334, 2008. [10] Ludascher B, Altintas I, Berkley C et al. Scientific workflow management and the kepler system. Concurrency and Computation: Practice and Experience, 18(10):1039–65, 2006. [11] M. Ceccarelli, G. Antoniol. A deformable Grid-Matching Approach for Microarray Images. IEEE Transactions on Image Processing, 15, 2006. [12] M. Ertelt, A. De Stasio, M. Ceccarelli, W. Kemmner, U. Leser. Microarray Analysis using a Scientific Workflow Engine: Experiences and Pitfalls. submitted, 2009. [13] M Schena, D.S., RW Davis, PO Brown. Quantitative monitoring of gene-expression patterns with a complementaryDNA microarray. Science, 270(5235):467–470, 1995. [14] M Senger, P Rice, T Oinn. Soaplab - a unified Sesame door to analysis tools. Proceedings of the UK e-Science All Hands Meeting, 2003. [15] Millenaar FF, O.J., May ST et al. How to decide? Different methods of calculating gene expression from short oligonucleotide array data will give different results. BMC Bioinformatics, 7:137, 2006. [16] Parkinson H., Sarkans U. et al. ArrayExpress - a public database of microarray experiments and gene expression profiles. Nucleic Acids Research, 35:D747–D750, 2006. [17] S. Majithia, M. S. Shields, I. J. Taylor, and I. Wang. Triana: A graphical web service composition and execution toolkit. In Proceedings of the ICWS, pages 514–524, 2004.
References
[18] T. Oinn, M. Addis, J. Ferris et al. Taverna: a tool for the composition and enactment of bioinformatics workflows. Bioinformatics, 20(17):3045–3054, 2004.
[1] Barrett T, Troup D et al. NCBI GEO: mining tens of millions of expression profiles-database and tools update. Nucleic Acids Research, 35:D760–D765, 2007.
6