IEEE TRANSACTIONS ON INTELLIGENT TRANSPORTATION SYSTEMS, VOL. 13, NO. 1, MARCH 2012
25
Extended Floating Car Data System: Experimental Results and Application for a Hybrid Route Level of Service Juan José Vinagre Díaz, David Fernández Llorca, Member, IEEE, Ana Belén Rodríguez González, Raúl Quintero Mínguez, Ángel Llamazares Llamazares, and Miguel Ángel Sotelo, Member, IEEE
Abstract—This paper presents the results of a set of extensive experiments carried out under both daytime and nighttime real traffic conditions. The data were captured using an enhanced or extended Floating Car Data system (xFCD) that includes a stereo vision sensor for detecting the local traffic ahead. The collected information is then used to propose a novel approach to the level-of-service (LOS) calculation. This calculation uses information from both the xFCD and the magnetic loops deployed in the infrastructure to construct a speed/occupancy hybrid plane that characterizes the traffic state of a continuous route. In the xFCD system, the detection component implies the use of previously developed monocular approaches in combination with new stereo vision algorithms that add robustness to the detection and increase the accuracy of the measurements corresponding to relative distance and speed. In addition to the stereo pair of cameras, the vehicle is equipped with a low-cost Global Positioning System (GPS) and an electronic device for controller-area-network bus interfacing. The xFCD system has been tested in a 198-min sequence recorded in real traffic scenarios under different weather and illumination conditions. The results are promising and demonstrate that the xFCD system is ready for being used as a source of traffic status information. As an indicative example of the developed xFCD system, we construct a novel route LOS calculation that combines hybrid information about speed and occupancy from both the xFCD system and the magnetic loops in the infrastructure. Index Terms—Controller are network (CAN) bus, extended floating car data (FCD), Global Positioning System (GPS), level of service, stereo vision.
I. I NTRODUCTION
O
VER the past few decades, the European economic growth has steadily increased the demand for energy and mobility, where transport accounts for 30% of the total energy consumption in the European Union. This increasing
Manuscript received February 24, 2011; revised May 26, 2011 and July 13, 2011; accepted July 20, 2011. Date of publication January 20, 2012; date of current version March 5, 2012. This work was supported by the Spanish Ministry of Development under Research Grant GUIADE P9/08. The Associate Editor for this paper was U. Nunes. J. J. Vinagre Díaz and A. B. Rodríguez González are with the Department of Signal Processing and Communications, Rey Juan Carlos University, 28943 Fuenlabrada, Spain (e-mail:
[email protected]; anabelen.
[email protected]). D. Fernández Llorca, R. Quintero Mínguez, A. Llamazares Llamazares, and M. A. Sotelo are with the Department of Automation, Polytechnic School, University of Alcalá, 28871 Alcalá de Henares, Spain (e-mail:
[email protected];
[email protected];
[email protected];
[email protected]). Color versions of one or more of the figures in this paper are available online at http://ieeexplore.ieee.org. Digital Object Identifier 10.1109/TITS.2011.2178834
demand for mobility across Europe requires urgent innovations in technology and policy that allow sustainable (green, safe, and efficient) transport [1]. The promotion of intelligent transportation systems is one of the key instruments to achieve this goal. In particular, accurate traffic monitoring plays a significant role in the construction of novel solutions for traffic management to reduce the levels of congestion and, consequently, consumption and emissions. The so-called floating car data (FCD) refer to technology that collects traffic state information from a set of individual vehicles that float in the current traffic. Each vehicle can be seen as a moving sensor operating in a distributed network. It is equipped with global positioning and communication systems, transmitting its global location, speed, and direction to a central control unit that integrates the information provided by each one of the vehicles. FCD systems are being increasingly used in a variety of important applications since they overcome the limitations of fixed traffic monitoring technologies [2]. If this system achieves a sufficient penetration rate (1.5% as described in [3]), the service quality in urban traffic would be sufficient. The most representative FCD projects in Japan, Europe, and the U.S. before 2005 are described in [4]. The basic data provided by FCD systems can be extended (xFCD) using new specific devices and sensors endowed in modern vehicles [5], [6]. Such data can be exploited to extend the information horizon including traffic, weather, road management, and safety applications [4]. A second generation of xFCD has been recently proposed by including vision-based sensors to estimate the local traffic conditions. For example, in [7], a stereo vision-based detection module is used as a vehicleahead checker (excluding lateral road lanes) to confirm or cancel the traffic alarms generated by the traffic level analyzer. In addition, they detect temporary danger warning signs. There are many cases where the use of vision may provide more accurate speed measurements, compared with standard FCD systems. Consider the case of congested traffic, where the host vehicle is stopped, whereas the vehicles located on the left or right lanes are moving at speeds greater than 0 km/h (i.e., the traffic jam only affects to the host lane). In addition, if FCD systems are installed onboard a fleet of public transport vehicles such as buses, they can provide misleading speed measurements due to the use of dedicated bus lanes. (Adjacent lanes may be jammed, whereas the bus lane is free.) Based on our previous works related with vision-based vehicle detection in the context of intelligent vehicles applications
1524-9050/$31.00 © 2012 IEEE
26
IEEE TRANSACTIONS ON INTELLIGENT TRANSPORTATION SYSTEMS, VOL. 13, NO. 1, MARCH 2012
[10]–[12], we have proposed to use the information provided by the cameras to supply xFCD systems with a more representative measurement of the traffic conditions [13], [14]. A set of monocular vision-based modules (forward-rear and sidelooking) was used, obtaining a nearly 360◦ field of view. Instead of excluding lateral lanes [7], the relative distance and speeds of the vehicles detected in adjacent lanes were incorporated to the xFDC structure, providing variables such as the local traffic load (number of vehicles, road capacity, etc.) and the average road speed (not only the floating vehicle speed) of the specific local area. Thus, a more detailed description (less discretized) of the traffic status can be obtained. These xFCD systems allow for extended capabilities in traffic management that can solve some current problems. Among others, we will use the xFCD to improve the determination of levels of service (LOSs). LOS qualitatively describes the operating conditions of a roadway based on a set of factors that consider physical variables such as speed or travel time, together with others such as maneuverability or safety [8]. Up to six LOSs (A to F) are defined, where the higher LOS (A to C) describe different levels of free flow, LOS D describes a situation that is approaching unstable flow, LOS E describes unstable flow, and LOS F describes forced or breakdown flow. There is no common or standardized method for calculating the LOS in a specific road. Some can be found in [8] or [9], where the calculations are mainly based on a combination of speed and occupancy (defined as the number of vehicles per kilometer and lane in the road). The actual implementation of these calculations relies on collected data from fixed magnetic loops. Consequently, the calculations can only be performed in a discrete number of points in the road, with no information in between. In addition, magnetic loop performance significantly drops in congested scenarios, where it is difficult to discriminate between consecutive vehicles. In this paper, we describe an improved approach of the vision-based vehicle detection systems described in [13] and [14] by means of the use of stereo vision. Stereo information improves both the detection performance and the accuracy of the measurements (host-to-vehicle (H2V) relative distance and speed). Previous results [14] were obtained in sequences of a few seconds (800 frames). Here, we provide extensive results in sequences of a total duration of 198 min (428 400 frames, with 36 frame/s) recorded in real traffic scenarios under different weather (rainy/cloudy) and lighting conditions (nighttime/daytime) and different levels of congestion. These improved data are then used to propose a novel method for calculating LOS based on information from both the vehicle and the magnetic loops. This LOS calculation is more precise and can be applied to a whole route, instead of discrete points in the road. The remainder of this paper is organized as follows: Section II describes a global overview of the system. The description of the stereo vision-based vehicle detection system is provided in Section III. Section IV describes the experimental results, including sensor accuracy analysis. These results are applied to the calculation of route LOS in Section V. Finally, conclusions and future works are discussed in Section VI.
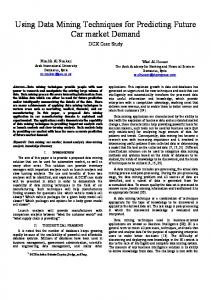
Fig. 1. (Top left) Low-cost stereo vision sensor. (Top right) RTK-DGPS. (Bottom) Experimental vehicle (modified Citröen C4).
II. S YSTEM OVERVIEW The experimental vehicle used in this work is a carlike robot (a modified Citröen C4), which can be seen in Fig. 1. It has an onboard computer housing the image processing system, i.e., an RTK-DGPS, which is connected via an RS232 serial port; a pair of synchronized (hardware triggering) low-cost digital cameras connected via FireWire ports; a specific electronic device for controller area network (CAN) bus interfacing; and a cellular communication system. The differential Global Positioning System (DGPS) is a 5-Hz RTK Maxor-GGDT system of Javad Navigation Systems. Based on our previous work [18], this system provides accurate global positioning with maximum deviations in x- and y-axes of 5 and 5.6 mm, respectively. (The standard deviations in the x- and y-axes were 0.0036 and 0.0041 mm, respectively.) The stereo vision sensor uses 320 × 240 pixel gray-scale images with a baseline of approximately 300 mm and a focal length of 8 mm. The global architecture of the system can be seen in Fig. 2. The results obtained by the stereo vision module are combined with the DGPS measurements and the data provided by the CAN bus to have globally referenced traffic status information. The measurements provided by the DGPS are linearly interpolated due to its low sample frequency (5 Hz).
III. V ISION -BASED V EHICLE D ETECTION A. System Description The global scheme of the proposed vision-based vehicle detection system is shown in Fig. 3. The first step consists of reducing the searching space in the image plane by detecting the road lane markings. The detected lanes are used as the guidelines that drive the vehicle-searching process. Lane markings are detected using gradient information in combination with a local thresholding method, which is adapted to the width of the projected lane markings. Then, clothoid curves are fitted to the detected markings [14]. In case no lane markings are detected, the system automatically defines a fixed region, which corresponds to a straight road. Then, several region of interest (ROI) generation modules are triggered in parallel.
VINAGRE DÍAZ et al.: XFCD SYSTEM: EXPERIMENTAL RESULT AND APPLICATION FOR HYBRID ROUTE LOS
27
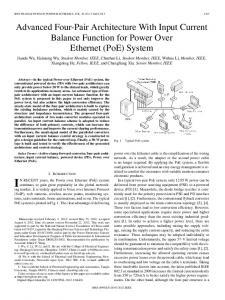
Fig. 4. (Left to right) Original image, dense disparity map, and filtered map (without ground-plane points or points that are very high).
Fig. 2.
Global architecture of the xFCD system.
Fig. 3.
Global overview of the vision-based vehicle detection algorithm.
Monocular ROIs are selected by combining white top-hat and canny features with different types of symmetries (gray-level, vertical-edge, and horizontal-edge symmetries), as described in [14]. Stereo processing results in a dense disparity map, which allows the 3-D position and the relative speed of the vehicles ahead to be accurately estimated. The camera pitch angle is dynamically estimated by means of the so-called virtual disparity map, from which regions corresponding to the ground plane can easily be removed [15]. One thus obtains a more precise specification of the areas of the ground where vehicles are to be expected (see Fig. 4). Stereo ROIs are then computed by counting the number of depth features corresponding to the filtered dense disparity map of locations selected by means of perspective constraints (flat-world assumption) and prior knowledge of target objects (with tolerances). In particular, the locations where the number of depth features exceeds a certain fraction of the window area are passed on to subsequent
Fig. 5. (Left to right) Original image, individual clusters after adaptive thresholding, and selected ROIs.
Fig. 6. (Upper rows) Daytime positive and negative samples. (Lower rows) Nighttime positive and negative samples. Note that the intensity of nighttime images has been synthetically increased.
modules, thus ensuring that each candidate region corresponds to a real 3-D object. Nighttime ROI selection mechanism is first based on adaptive thresholding. Candidates are then obtained by searching pair of clusters (which are usually rear lights) with similar vertical location, using again the flat-world assumption, perspective constraints, and prior knowledge of target objects. Although this is a simple method, it is very effective in practice. It provides a low number of false positives since the adaptive thresholding mostly highlights the rear lights of the vehicles (see Fig. 5). The three ROI selection modules provide different candidates, some of which overlapped, as they can refer to the same vehicle. All these candidates are classified by means of linear
28
IEEE TRANSACTIONS ON INTELLIGENT TRANSPORTATION SYSTEMS, VOL. 13, NO. 1, MARCH 2012
Fig. 7. Scheme of the manual driving experiment.
Fig. 8. Stereo and DGPS H2V relative distance including absolute and depth estimation errors in the experiment in which the car is overtaken.
support vector machine (SVM) classifiers [16] in combination with histogram of oriented gradients (HOG) features [17]. Two specialized classifiers have been trained, depending on the lighting conditions. Candidates selected by monocular and stereo modules are classified using a daytime SVM classifier. On the other hand, a nighttime SVM classifier is used for nighttime ROIs (see Fig. 3). Fig. 6 shows some of the positive and negative samples used for training. The number of samples used for developing the training test differs depending on the classifier. Daytime classifier was trained with 19 031 negative and 9248 positive samples. Nighttime classifier was obtained using 2486 negative and 1847 positive samples. The number of samples used in nighttime scenarios is lower because intraclass variability is much lower than that under daytime conditions. The use of three different ROI selection methods triggered at the same time (one of them specifically designed for nighttime conditions) avoids the need for different parameter settings, depending on the lighting/weather conditions. However, the three detection modules may generate candidates related with the same vehicle. Accordingly, a kind of nonmaximum suppression technique is used to group multiple overlapped candidates, trying to generate only one candidate per vehicle. In practice, we have observed that good candidates (candidates that are well fitted to the actual vehicle contour) usually provide SVM results farther to the hyperplane that separates the vehicle and nonvehicle classes, i.e., their classification result has higher confidence. Thus, we use the distance to the hyperplane as the main variable to select the best candidate of a set of overlapped candidates. (Overlapping has to be larger than 70% of the area of the smaller candidate.) Finally, the vehicles detected in this single-frame way are passed to the multiframe validation and tracking module (see Fig. 3). A predefined number (empirically set to 3) of consec-
utive identifications of an object classified as a vehicle triggers the data association and tracking stages. The data association problem is addressed by using feature-matching techniques. Harris features are detected and matched between two consecutive frames, as in [14]. Tracking is implemented using a Kalman filter with a constant velocity model [14]. B. System Validation In a first experiment, we evaluated the different parameters provided by the vision sensor, i.e., H2V relative distance and speed, together with their corresponding errors. A set of sequences was recorded, in which a driver was requested to perform an overtaking maneuver in a two-lane road at approximately 25 km/h. A vehicle was parked in the righthand (nonovertaking) lane, so that the host vehicle overtakes these vehicles at a relative speed of about 25 km/h. In addition to the stereo vision sensor, two DGPSs are used, with one placed at the lead vehicle’s position and the other on board the host vehicle (see Fig. 7). The measurements supplied by these DGPSs (after linear interpolation due to their low sampling frequency, i.e., 5 Hz) are taken to be the ground truth. Fig. 8 plots the stereo and the DGPS distance estimates, including the absolute error and the stereo depth estimation uncertainties [18], of the experiment in which the car is the vehicle overtaken. The DGPS H2V, which is taken to be the ground truth, lies mostly within the limits of the stereo depth estimate including their corresponding uncertainties. As can be observed, the greater the depth, the greater the absolute error. Depth estimates may not be reliable at long distances (absolute errors). However, the absolute error decreases as the H2V distance decreases.
VINAGRE DÍAZ et al.: XFCD SYSTEM: EXPERIMENTAL RESULT AND APPLICATION FOR HYBRID ROUTE LOS
29
Fig. 10. ROC curves for both daytime and nighttime linear SVM classifiers. Fig. 9. H2V relative speed (in kilometers per hour) taken from the CAN bus (the leading vehicle is parked) and from the DGPS depth values and the discrete stereo measurements, estimated by averaging the discrete stereo values at each second, in the experiment where the car is overtaken.
Although the depth estimation errors are sufficiently small for the precision required in the present application, those of the discrete estimate of the relative speed from the Kalman state variable are not. As demonstrated in [19], discrete difference between two noisy depth estimation values introduces a considerable error in the relative speed computation for noninfinitesimal Δt, and this clearly limits the vision system’s precision. Those authors propose an optimal value for Δt, which is directly proportional to depth. In the present case, we define a practical value of Δt = 1 s and compute the average speed of the last 36 frames. This approach is very effective in practice. Fig. 9 shows the relative speed obtained from the CAN bus (recall that the leading vehicle is parked in this experiment), which was computed by means of DGPS H2V distance values, the discrete relative speed provided by the Kalman filter, and the relative speed computed at each second. One observes that the discrete values of the stereo relative speed are not at all useful. However, the proposed approach previously described provides relative speed estimates that are accurate enough for the application’s requirements—the root-mean-squared error is around 3 km/h.
C. Single-Frame SVM Classifier Results As described in Section III-A, the generic candidates are classified by means of two different linear SVM classifiers (daytime and nighttime). To define the SVM decision thresholds, we use the ROC curves defining the work points in terms of the relationship between the detection rate (DR) and the false positive rate (FPR). In these experiments, two thirds of the samples were used for training, and one third was used for test. The ROC curves are shown in Fig. 10. On the one hand, the decision threshold for the daytime classifier is fixed to 0.03 with a DR of 96.1% and an FPR of 6.4%. On the other hand, the decision threshold for the nighttime classifier is fixed to 0.07 with a DR of 91.4% and an FPR of 7.8%. We have to consider that these results are single-frame results, so they will be improved in multiframe validation and tracking stages. The final classifier is trained with all the available samples.
Fig. 11. Route through the Madrid (Spain) M-30 highway used in the experiments (image taken from Google Maps).
IV. E XTENDED F LOATING C AR DATA E XPERIMENTAL R ESULTS A. Description of the Experiment The proposed system was tested on data from real traffic conditions. A set of video sequences was recorded on a route through the Madrid (Spain) M-30 highway (see Fig. 11). The route distance is approximately 15 km and was driven up to eight times: four times going South (from A to B), where we found free traffic, and four times going North (from B to A), where we found a congestion that started to decrease during the last minutes of the experiment. The video sequences were recorded from 7:20 A . M . to 10:38 A . M ., including different lighting (nighttime/daytime) and weather (rainy/cloudy) conditions, as well as different levels of congestion. Consequently, we produced a video database including 195 min. (Although the experiment had a total duration of 198 min, 3 min was lost due to a problem in the recording system.)
30
IEEE TRANSACTIONS ON INTELLIGENT TRANSPORTATION SYSTEMS, VOL. 13, NO. 1, MARCH 2012
TABLE I GLOBAL xFCD RESULTS
Fig. 12. Vision-based vehicle detection results under daytime, cloudy, and rainy conditions with different levels of traffic congestion, corresponding to 13 min of a sequence.
B. Measured Variables The main variables provided by the xFCD system are given here. 1) Average road speed: This is computed by means of the host speed (via CAN bus) and the relative speed of the vehicles ahead (vision based). 2) Number of vehicles: This variable provides the number of vehicles detected ahead (left, middle, and right lanes). 3) Relative H2V distance: This is the relative distance between the host vehicle and the vehicle ahead (located on the same lane). Many other variables are obtained by the xFCD system. Some of them are directly available via CAN bus, and other variables are indirectly available after some processing. Among all of them, we remark the following: speed, acceleration, revolutions per minute, number of stop-and-go (based on the speed), outside temperature and humidity, windshield wiper status, different light status (fog, emergency, high beams, indicators, etc.), number of gear changes, number of lane changes (based on the indicator lights), fuel consumption, etc. C. Vision-Based Vehicle Detection Results Global results are presented in Table I. We have labeled the total amount of vehicles in range in all the sequences (ground truth). Note that we distinguish between true positives and vehicles that are detected from a previously detected vehicle (identifier exchanged). In both cases, we consider the vehicle as detected, assuming that some errors will appear in the relative distance computation when a new vehicle is associated with
a previously tracked vehicle. Accordingly, we obtain DRs of 88.44% and 90.99% under nighttime and daytime conditions, respectively. 0.84 false-positive/min are obtained under nighttime conditions, whereas 0.69 false-positive/min are detected under daytime conditions. In addition, 6.67% and 5.82% of the vehicles are counted more than one time under nighttime and daytime conditions, respectively (i.e., a new identifier is generated). Nighttime detection performance is lower than daytime performance due to two main reasons: First, the nighttime ROI selection scheme is not stereo based, which is prone to generate more false positives. Second, in the sequences used in the experiments, most of the rain fell under nighttime conditions. Although rain does not seem to have any effect on detection performance under daytime conditions (due to the stereo-based approach), some false positives and false negatives under nighttime conditions are generated due to the effect of rear light reflections through the water drops. Figs. 12 and 13 show some of the variables provided by the system in two of the sequences (daytime and nighttime, respectively) with different levels of traffic congestion. The following variables are drawn: host speed (via CAN bus interface), the average road speed, the distance between the host vehicle and the vehicle ahead, and the number of vehicles detected per frame. The maximum number of vehicles detected per frame is 6. (Note that the minimum number is 1 since we always count the host vehicle.) The number of detected vehicles does not seem to affect average road speed computation, which implies that the relative distances of the vehicles detected in adjacent lanes and the proposed method for computing the relative speed are coherent up to a point. (Extensive ground truth data will be
VINAGRE DÍAZ et al.: XFCD SYSTEM: EXPERIMENTAL RESULT AND APPLICATION FOR HYBRID ROUTE LOS
31
Fig. 13. Vision-based vehicle detection results under nighttime, cloudy, and rainy conditions with different levels of traffic congestion, corresponding to 7 min of a sequence.
needed to assure the actual goodness of the relative distance and speed measures.) The average difference between the host speed and the average road speed is 0.4 km/h. This can be explained by the fact that the host vehicle is driving on the central lane of a three-lane highway most of the time, and therefore, the higher speed of the vehicles located on the left lane is somehow compensated with the lower speed of vehicles located on the right lane. V. ROUTE L INE O F S IGHT T HROUGH H YBRID F IXED AND E XTENDED F LOATING DATA As we described in Section I, LOS qualitatively describes the conditions of the road. LOSs are often calculated using a combination of speed and occupancy. These two variables are collected by the fixed magnetic loops deployed underneath the road. At each point of measurement, two magnetic loops are installed. Speed is directly calculated from the travel time between the pair of loops (knowing their fixed separation). On the other hand, occupancy is obtained through the total time that a loop is active, i.e., the percentage of time in a minute that the loop detects a vehicle above it; thus, the occupancy indicates some kind of density of vehicles in a segment of the road. This monitoring method implies two important issues: First, in congested scenarios, speed detection is unreliable, because the magnetic loops are unable to discriminate between two consecutive vehicles that travel through the pair of loops at each point of measurement. Second, even in free-flow traffic scenarios, data are only collected at discrete points in the road; thus, no continuous route information can be supplied. The xFCD system proposed and described can be used to mitigate these issues, providing both better speed description and a hybrid route LOS. We define the route LOS as the set of sequential LOS calculations that are performed from the speed and occupancy data collected by the xFCD system at an increased spatial resolution. We will now proceed to show the collected data from the magnetic loops and the host vehicle during the same day and
time of the experiment. We will show the comparison between two significant variables for the LOS calculation, i.e., speed and occupancy, and we will propose a new method for determining the LOS using hybrid data from both the magnetic loops and the xFCD. A. Comparison Between Fixed Loops and xFCD The xFCD system collects the value of the whole set of parameters described in Section IV-B and its GPS position every minute. To implement a fair comparison with the measurements produced by the fixed loops, we select the one that is closest to the position of the floating vehicle in each measure point and time. This is an approach used for interpolating the values collected by fixed loops along the space between them [20]. 1) Speed: Fig. 14 shows that, in general, the fixed loops record higher speed values. These differences are reduced in higher speed values. It is also remarkable that fixed loops do not register almost any speed value below 10 km/h, which is not consistent with the observation of heavy congested traffic in the South-to-North routes. Table II shows the mean speed values recorded by both the vehicle Vv and the fixed loops Vl in the North-to-South and South-to-North routes (averages over 39 and 124 measurements, respectively). Observe that the highest difference between the speed recorded by the vehicle and the fixed loops happens in the South-to-North route, where there is a much higher congestion. 2) Occupancy: The second variable that is used in the LOS determination is the occupancy. The xFCD do not include direct calculation of this variable. Instead, we can approach it through the number of vehicles that the host vehicle has counted through the following equation: ˆ = O(t)
Nv (t) d(t)·3
Omax
× 100
(1)
32
IEEE TRANSACTIONS ON INTELLIGENT TRANSPORTATION SYSTEMS, VOL. 13, NO. 1, MARCH 2012
Fig. 14. Speed collected by the (red) vehicle and (blue) fixed loops. TABLE II MEAN SPEEDS IN NORTH-TO-SOUTH AND SOUTH-TO-NORTH ROUTES
where Nv (t) is the number of counted vehicles in any of the three lanes of the roadway, d(t) is the host vehicle traveled distance (depending on its speed), and Omax = 1000/6 is the maximum capacity of the roadway, i.e., the maximum number of vehicles per kilometer. (We have considered a mean value of 6 m for the length of the vehicle plus the distance between vehicles in a heavily congested scenario.) Fig. 15 shows the occupancy values obtained from both (1) and the fixed loops. To implement a fair comparison between those pairs of values, we take the occupancy measurement of the magnetic loop that is closer to the point and time of measure of the host vehicle. From Fig. 15, we can observe that 1) in general, the estimated occupancy values calculated through (1) ˆ are significantly lower and 2) nevertheless, this estimation O(t) is capable of reproducing the tendency of the actual occupancy measured by the magnetic loops, except in the presence of low ˆ overestimates the actual occupancy. speed, where O(t) Consequently, the proposed estimation of the roadway occupancy is a feasible approach to the actual occupancy, but the values of this variable that are provided by the magnetic loops are more reliable. B. Route Hybrid LOS LOS determines the effectiveness of sections in a road infrastructure. In consequence, LOS is extensively used in the analysis of traffic conditions, describing the road’s safety and driving comfort based on speed and occupancy. To consider speed and occupancy in the calculation of LOS, a speed/occupancy (S/O) plane is used. In this type of graph, the top-left corner (high speed, low occupancy) determines freeflow traffic states, whereas the lower-right corner (low speed, high occupancy) represents congestion. The LOS will then decay from A to F, following the diagonal between these two corners. Fig. 16 show the S/O planes generated by the values of speed and occupancy obtained from the magnetic loops and the xFCD.
From the observations of Figs. 14–16, we conclude that the magnetic loops and the xFCD provide better measurements of occupancy and speed, respectively. In consequence, the calculation of LOS could be improved by considering hybrid values of these two variables obtained from the host vehicle and the fixed loops. Following this approach, we can build an S/O plane considering the speed values recorded by the host vehicle and the occupancy measurements performed by the magnetic loops. The resultant S/O plane can be observed in Fig. 17. Note that this S/O hybrid plane is a route S/O plane because it takes the xFCD of a vehicle traveling through a route and the measurements of the corresponding magnetic loops in space and time. This is a novel approach to LOS calculation based on mobile and fixed sensor fusion. It provides continuous information regarding the state of the roadway instead of the discrete values of LOS that are obtained from the fixed loops. Using this route S/O hybrid plane, the final determination of the LOS would be implemented through the definition of specific thresholds of speed and occupancy that would delimit different regions in the plane. In addition to using more accurate measurements of speed and occupancy and extending the LOS determination to a continuous route, this approach provides significant information to both the traffic control center and the driver. In fact, this route hybrid LOS could become a means to promote the interchange of data between the users and the infrastructure as both benefit from it. The traffic control center would be provided with more detailed data coming from different host vehicles to improve the determination of the traffic state and the consequent decisions to be taken. The driver would receive information regarding the state of the roadway in future points of his route with which he could estimate travel times or modify his path to avoid congestions.
VI. C ONCLUSION AND F UTURE W ORKS This paper has proposed a novel xFCD system and the experimental results generated in an actual scenario with real traffic data and under different light and weather conditions. The huge amount of collected information provided by this xFCD system can be used in a great variety of applications. Among them, we have proposed a novel way of calculating the LOS of a roadway through hybrid information regarding speed and occupancy collected from both fixed magnetic loops and a host vehicle providing xFCD.
VINAGRE DÍAZ et al.: XFCD SYSTEM: EXPERIMENTAL RESULT AND APPLICATION FOR HYBRID ROUTE LOS
33
Fig. 15. Occupancy calculated from the number of vehicles (red) counted by the host vehicle and (blue) measured by the magnetic loops.
Fig. 16. S/O plane. (Red) xFCD pairs and (blue) magnetic loop pairs.
Fig. 17. Route S/O hybrid plane considering the speed values from the xFCD and the occupancy measurements from the magnetic loops.
We have first presented the results of an xFCD system equipped with a stereo vision-based local traffic detector in a set of extensive experiments carried out under real traffic conditions with different lighting and weather conditions, as well as different levels of traffic congestion. The visionbased vehicle detection system combines different approaches (monocular, stereo, and nighttime) to supply generic obstacles that are classified by means of two linear SVM classifiers (daytime/nighttime) and HOG features. The detected vehicles are then validated in a multiframe fashion and tracked using a
Kalman filter. The proposed approach provides data from not only the host vehicle but from the vehicles located in the field of view of the host as well, including the vehicle ahead and the vehicles located in adjacent lanes (when available). Thus, standard variables such as the host vehicle speed (via CAN bus) can be enriched and supported with new variables such as the distance to the vehicle ahead, the average road speed, and the number of vehicles in range. Although the use of stereo vision implies managing some errors when estimating the relative distance (errors that are squared proportional to the depth), it allows us to have an accurate estimation of the relative speed by integrating relative distance values during 1 s. The global results show that the proposed approach produces good results under different traffic conditions, succeeding when detecting traffic congestion. The collected variables were then used to improve the calculation of LOS in the roadway, together with the measurements provided by the magnetic loops deployed in the infrastructure. We built S/O planes based on pairs formed by speed values collected in the host vehicle and occupancy measurements recorded by the magnetic loops, with each one supplying the most accurate information of each separate variable. In addition, this novel calculation of LOS provides not only discrete values of LOS in space but a route LOS as well, where the state of the traffic is monitored in a continuous way. Although the results are promising and practicably applicable now, future work is still needed in both the detection system and the LOS calculation. On the one hand, new advances have to be developed to improve the DR and reduce the number of false positives in the xFCD system. A more sophisticated ensemble classifier will be introduced using different classifiers, depending on the lane, and including a new class for trucks since they are the main source of error in vehicle counting. The DR and the accuracy of the H2V relative distance measurements can be improved by combining the proposed visionbased approach with range-based sensors, such as radar or laser, or series-production sensors of modern vehicles endowed with ADASs. On the other hand, novel approaches to the estimation of occupancy are needed to better exploit the information generated by the xFCD. In addition, we need to define the set of thresholds to determine LOS through the route S/O hybrid plane. With all this available hybrid information from both the xFCD and the magnetic loops in the infrastructure, we will be able to build novel algorithms to estimate traffic variables such as travel time between two points in a route and
34
IEEE TRANSACTIONS ON INTELLIGENT TRANSPORTATION SYSTEMS, VOL. 13, NO. 1, MARCH 2012
assess applications in the context of traffic management and control. ACKNOWLEDGMENT The authors would like to thank the contributions and support of Sociedad Ibérica de Construcciones Eléctricas and, specifically, J. J. Mínguez. R EFERENCES [1] Eur. Comm., Office for official publications of the European Communities Doing more with less: Green Paper on energy efficiency, 2005. [2] J. E. Naranjo, F. Jiménez, F. J. Serradilla, and J. G. Zato, “Comparison between floating car data and infrastructure sensors for traffic speed estimation,” in Proc. IEEE Intell. Transp. Syst. Conf., Madeira, Portugal, 2010. [3] C. Demir, B. S. Kerner, R. G. Herrtwich, S. L. Klenov, H. Rehborn, M. Aleksic, T. Reigber, M. Schwab, and A. Haug, “FCD for urban areas: Method and analysis of practical realizations,” in Proc. 10th Intell. Transp. Syst. World Congr., Madrid, Spain, 2003. [4] R. Bishop, Intelligent Vehicle Technologies and Trends. Boston, MA: Artech House, 2005. [5] W. Huber, M. Lädke, and R. Ogger, “Extended floating-car data for the acquisition of traffic information,” in Proc. 6th World Congr. Intell. Transp. Syst., 1999, pp. 1–9. [6] A. Escher, “Enhanced floating car data approaches enabled by GST,” in Proc. 12th World Congr. Intell. Transp. Syst., 2005, 16 p. [7] S. Messelodi, C. M. Modena, M. Zanin, F. G. B. De Natale, F. Granelli, E. Betterle, and A. Guarise, “Intelligent extended floating car data collection,” Expert Syst. Appl., vol. 36, pt. 1, no. 3, pp. 4213–4227, Apr. 2009. [8] Highway Capacity Manual 2000, Transp. Res. Board, Washington, DC, 2000. [9] Forschungsgesellschaft für Strassen und Verkehrswesen, Handbuch für die Bemessung von Strassenverkehrsanlagen (German Highway Capacity Manual) (HBS 2001), 2002. [10] S. Álvarez, M. A. Sotelo, M. Ocaña, D. F. Llorca, I. Parra, and L. M. Bergasa, “Perception advances in outdoor vehicle detection for automatic cruise control,” Robotica, vol. 28, no. 5, pp. 765–779, Sep. 2010. [11] M. A. Sotelo and J. Barriga, “Blind spot detection using vision for automotive applications,” J. Zhejiang Univ. Sci. A, vol. 9, no. 10, pp. 1369– 1372, 2008. [12] D. Balcones, D. F. Llorca, M. A. Sotelo, M. Gavilán, S. Álvarez, I. Parra, and M. Ocaña, “Realtime vision-based vehicle detection for rearend collision mitigation systems,” in Proc. 12th Int. Conf. EUROCAST, vol. 5717, LNCS, 2009, pp. 320–325. [13] D. F. Llorca, S. Sánchez, M. Ocaña, and M. A. Sotelo, “Vision-based traffic data collection sensor for automotive applications,” Sensors, vol. 10, no. 1, pp. 860–875, Jan. 2010. [14] D. F. Llorca, M. A. Sotelo, S. Sánchez, M. Ocaña, J. M. RodríguezAscariz, and M. A. García-Garrido, “Traffic data collection for floating car data enhancement in V2I networks,” EURASIP J. Adv. Signal Process., vol. 2010, Mar. 2010, doi:10.1155/2010/719294, 13 p. [15] D. F. Llorca, M. A. Sotelo, I. Parra, J. E. Naranjo, M. Gavilán, and S. Álvarez, “An experimental study on pitch compensation in pedestrianprotection systems for collision avoidance and mitigation,” IEEE Trans. Intell. Transp. Syst., vol. 10, no. 3, pp. 469–474, Sep. 2009. [16] C. J. C. Burges, “A tutorial on support vector machines for pattern recognition,” Data Mining Knowl. Discov., vol. 2, no. 2, pp. 121–167, Jun. 1998. [17] N. Dalal and B. Triggs, “Histograms of oriented gradients for human detection,” in Proc. IEEE Comput. Soc. Conf. CVPR, Jun. 2005, pp. 886–893. [18] D. F. Llorca, M. A. Sotelo, I. Parra, M. Ocaña, and L. M. Bergasa, “Error analysis in a stereo vision-based pedestrian detection sensor for collision avoidance applications,” Sensors, vol. 10, no. 4, pp. 3741–3758, Apr. 2010. [19] G. P. Stein, O. Mano, and A. Shashua, “Vision-based ACC with a single camera: Bounds on range and range rate accuracy,” in Proc. IEEE Intell. Veh. Symp., 2003, pp. 120–125. [20] F. Soriguera and F. Robusté, “Requiem for freeway travel time estimation methods based on blind speed interpolations between point measurements,” IEEE Trans. Intell. Transp. Syst., vol. 12, no. 1, pp. 291–297, Mar. 2011.
Juan José Vinagre Díaz received the B.S. degree in telecommunications engineering from the Universidad Politécnica de Madrid, Madrid, Spain, in 1998 and the Ph.D. degree in telecommunications engineering from the Universidad Carlos III de Madrid, in 2007. He is currently with the Department of Signal Processing and Communications, Rey Juan Carlos University, Fuenlabrada, Spain. He has considerable commercial experience in the development of largescale communication networks for airports, buildings, and other large companies. He has also managed large engineering teams. He has participated in more than 30 research and development projects. His research lines include wireless ad hoc and sensor networks, routing analysis, and vehicular communications, with applications to energy efficiency, traffic optimization, and indoor location.
David Fernández Llorca (M’08) received the M.Sc. and Ph.D. degrees in telecommunications engineering from the University of Alcalá (UAH), Alcalá de Henares, Spain, in 2003 and 2008, respectively. He is currently an Associate Professor with the Department of Automation, Polytechnic School, UAH. He is the author of more than 50 refereed publications in international journals, book chapters, and conference proceedings. His research interests are computer vision and intelligent transportation systems. Dr. Llorca was the recipient of the Best Ph.D. Award by the UAH, the Best Research Award in the domain of Automotive and Vehicle applications in Spain in 2008, the 3M Foundation Awards under the category of eSafety in 2009, the Master Thesis Award in eSafety from the ADA Lectureship at the Technical University of Madrid in 2004, and the Best Telecommunication Engineering Student Award in 2004.
Ana Belén Rodríguez González was born in Plasencia, Spain. She received the B.S. degree in telecommunication engineering from the Universidad de Valladolid, Valladolid, Spain, in 2000, the B.A. degree in economics from the Universidad Nacional de Educación a Distancia, Madrid, Spain, in 2002, and the Ph.D. degree in telecommunication engineering from the Universidad Carlos III de Madrid, in 2008. In 2007, she joined the Department of Signal Processing and Communications, Rey Juan Carlos University, Fuenlabrada, Spain, where she is engaged in research and teaching activities as an Assistant Professor. Her current research interests include green communications in wireless sensor networks, vehicular ad hoc networks, and energy efficiency.
Raúl Quintero Mínguez received the M.S. degree in computer science engineering from the University of Alcalá (UAH), Alcalá de Henares, Spain, in 2009. He is currently a Member of the Robesafe Research Group, Department of Automation, Polytechnic School, UAH. He has worked under the supervision of Dr. M. Á. Sotelo since 2009. His research interests include intelligent transportation systems, intelligent vehicles, and artificial vision.
VINAGRE DÍAZ et al.: XFCD SYSTEM: EXPERIMENTAL RESULT AND APPLICATION FOR HYBRID ROUTE LOS
Ángel Llamazares Llamazares received the technical degree in industrial electronics and the M.S. degree in computer science engineering from the University of Alcalá (UAH), Alcalá de Henares, Spain, in 2007 and 2009, respectively. He is currently working toward the Ph.D. degree in robotics with the Department of Automation, Polytechnic School, UAH. His research interests include robotics and intelligent transportation systems.
35
Miguel Ángel Sotelo (M’02) received the Dr. Ing. degree in electrical engineering from the Technical University of Madrid, Madrid, Spain, in 1996 and the Ph.D. degree in electrical engineering from the University of Alcalá, Alcalá de Henares, in 2001. He is currently a Full Professor with the Department of Automation, Polytechnic School, University of Alcalá. He has been serving as an Auditor and Expert for the FITSA Foundation, working on R&D projects on automotive applications, since September 2004. He is the author of more than 150 refereed publications in international journals, book chapters, and conference proceedings. His research interests include real-time computer vision and control systems for autonomous and assisted intelligent road vehicles. Dr. Sotelo is a member of the IEEE Intelligent Transportation Systems (ITS) Society and the ITS-Spain Committee. He is currently an Associate Editor for the IEEE T RANSACTIONS ON I NTELLIGENT T RANSPORTATION S YSTEMS. He was the recipient of the Best Research Award in the domain of Automotive and Vehicle Applications in Spain in 2002 and 2009, the 3M Foundation Awards under the category of eSafety in 2003 and 2004, and the Best Young Researcher Award from the University of Alcalá in 2004.