PNNL-20452. Prepared for the U.S. Department of Energy under Contract DE-
AC05-76RL01830. Final Project Report: Self-Correcting. Controls for VAV
System ...
PNNL-20452 Prepared for the U.S. Department of Energy under Contract DE-AC05-76RL01830
Final Project Report: Self-Correcting Controls for VAV System Faults Filter/Fan/Coil and VAV Box Sections
MR Brambley N Fernandez W Wang
May 2011
KA Cort H Cho H Ngo
JK Goddard
DISCLAIMER United States Government. Neither the United States Government nor any agency thereof, nor Battelle Memorial Institute, nor any of their employees, makes any warranty, express or implied, or assumes any legal liability or responsibility for the accuracy, completeness, or usefulness of any information, apparatus, product, or process disclosed, or represents that its use would not infringe privately owned rights. Reference herein to any specific commercial product, process, or service by trade name, trademark, manufacturer, or otherwise does not necessarily constitute or imply its endorsement, recommendation, or favoring by the United States Government or any agency thereof, or Battelle Memorial Institute. The views and opinions of authors expressed herein do not necessarily state or reflect those of the United States Government or any agency thereof. PACIFIC NORTHWEST NATIONAL LABORATORY operated by BATTELLE for the UNITED STATES DEPARTMENT OF ENERGY under Contract DE-AC05-76RL01830 Printed in the United States of America Available to DOE and DOE contractors from the Office of Scientific and Technical Information, P.O. Box 62, Oak Ridge, TN 37831-0062; ph: (865) 576-8401, fax: (865) 576-5728 email:
[email protected] Available to the public from the National Technical Information Service, U.S. Department of Commerce, 5285 Port Royal Rd., Springfield, VA 22161 ph: (800) 553-6847, fax: (703) 605-6900 email:
[email protected] online ordering: http://www.ntis.gov/ordering.htm
This document was printed on recycled paper. (8/00)
FINAL PROJECT REPORT SELF-CORRECTING CONTROLS FOR VAV SYSTEM FAULTS Filter/Fan/Coil and VAV Box Sectons Prepared for CIEE By: Pacific Northwest National Laboratory
Project Manager: Michael R. Brambley Authors: Michael R. Brambley, Nick Fernandez, Weimin Wang, Katherine A. Cort, Heejin Cho, Hung Ngo, James Goddard Date: May, 2011
A CIEE Report
PREFACE This report documents work performed by Pacific Northwest National Laboratory for the California Institute for Energy Efficiency under subcontract PODR01-X08 between The Regents of the University of California and Battelle, Acting on behalf of Pacific Northwest National Laboratory.
DISCLAIMER
This report was prepared as the result of work sponsored by the California Energy Commission. It does not necessarily represent the views of the Energy Commission, its employees or the State of California. The Energy Commission, the State of California, its employees, contractors and subcontractors make no warrant, express or implied, and assume no legal liability for the information in this report; nor does any party represent that the uses of this information will not infringe upon privately owned rights. This report has not been approved or disapproved by the California Energy Commission nor has the California Energy Commission passed upon the accuracy or adequacy of the information in this report.
i
ABSTRACT This report documents original research by the Pacific Northwest National Laboratory (PNNL) for the California Institute for Energy and Environment on self-correcting controls for variableair-volume (VAV) heating, ventilating and air-conditioning (HVAC) systems and focuses specifically on air handling and VAV box components of the air side of the system. A complete set of faults for these components was compiled and a fault mode analysis was performed to understand the detectable symptoms of the faults and the chain of causation. A set of 26 algorithms was developed to facilitate the automatic correction of these faults in typical commercial VAV systems. These algorithms include training tests that are used during commissioning to develop models of normal system operation, passive diagnostics used to detect the symptoms of faults, proactive diagnostics used to diagnose the cause of a fault, and fault correction algorithms. Of the 26 algorithms, 10 were implemented in a prototype software package that interfaces with a test bed facility at PNNL’s Richland, WA, laboratory. Measurement bias faults were instigated in the supply-air temperature sensor and the supplyair flow meter to test the algorithms developed. The algorithms, as implemented in the laboratory software, correctly detected, diagnosed and corrected faults in most cases tested. An economic and impact assessment was performed for deployment of self-correcting controls in California. Assuming 15% HVAC energy savings and a modeled deployment profile, 3.1 TBtu to 5.8 TBtu of energy savings are possible by year 15 of deployment.
Keywords: California Energy Commission, PNNL, self-correcting controls, VAV, faults, fault detection and diagnosis
Please use the following citation for this report: Brambley, Michael R., Nick Fernandez, Weimin Wang, Heejin Cho, Hung Ngo and James Goddard. (Pacific Northwest National Laboratory) 2011. Self-Correcting Controls for VAV System Faults – Filter/Fan/Coil and VAV Box Sections.
ii
TABLE OF CONTENTS PREFACE ..................................................................................................................................................... i ABSTRACT ............................................................................................................................................... ii TABLE OF CONTENTS......................................................................................................................... iii EXECUTIVE SUMMARY ........................................................................................................................ 1 Identify Faults......................................................................................................................................... 1 Development of Self-correction Methods and Algorithms .............................................................. 1 Implementation of Algorithms in Software Code and Integration with the Control System..... 2 Laboratory Testing of the Self-Correcting Software ......................................................................... 2 Economic and Impact Assessment of Deployment ........................................................................... 3 The Path Forward .................................................................................................................................. 3 CHAPTER 1: Fault Identification and Analysis.................................................................................. 4 System Description ................................................................................................................................ 4 Air-handling Unit (AHU) ................................................................................................................. 4 Variable-air-volume (VAV) Terminal Boxes .................................................................................. 6 Identification of potential faults........................................................................................................... 8 Fault mode analysis ............................................................................................................................. 16 CHAPTER 2: Algorithm Development ............................................................................................... 24 Training ................................................................................................................................................. 28 Passive Diagnostics .............................................................................................................................. 28 Proactive Diagnostics .......................................................................................................................... 31 Fault Correction.................................................................................................................................... 34 CHAPTER 3: Implementation and Testing........................................................................................ 37 Description of the Test Facility........................................................................................................... 37 Implementation of Algorithms .......................................................................................................... 37 Results.................................................................................................................................................... 39 Analysis of Training Data ............................................................................................................... 39 Test Results ....................................................................................................................................... 41 CHAPTER 4: Economic and Impact Assessment .............................................................................. 50 Technical and Market Potential ......................................................................................................... 50 iii
Methodology..................................................................................................................................... 51 Built-up System Savings ................................................................................................................. 52 Packaged System Savings ............................................................................................................... 55 Total Impacts on California Market .................................................................................................. 58 Economic Impact .............................................................................................................................. 59 Environmental Impacts ................................................................................................................... 60 CHAPTER 5: Future Work..................................................................................................................... 62 Improved Training Models and Procedures .................................................................................... 62 Completion of Full Suite of Laboratory Tests .................................................................................. 63 Integrating with Additional BASs and Field Testing ..................................................................... 65 Path Forward ........................................................................................................................................ 65 REFERENCES .......................................................................................................................................... 67
iv
EXECUTIVE SUMMARY The Pacific Northwest National Laboratory (PNNL) performed research for the California Institute for Energy and Environment (CIEE) in self-correcting controls for commercial building VAV systems. The work included identification and analysis of fault modes and their symptoms, developing algorithms for the four steps of the process leading to automated correction of faults not requiring human intervention to physically repair or replace a system component, coding a selected subset of the algorithms in prototype laboratory-grade software, and laboratory testing. These steps in the process include training to capture relationships among key variables, fault detection, fault diagnosis (which is also known as fault isolation), and fault correction. The remainder of this executive summary briefly describes the work performed and key results and is organized in parallel to the chapter structure of the report.
Identify Faults A comprehensive list of faults that affect VAV systems was developed and mapped to their potential causes to facilitate the development of algorithms. The list of faults was developed in a brainstorming session that brought together several experts with experience in diagnosing faults in HVAC systems and developing automated HVAC control and fault detection and diagnostic (FDD) systems. The faults were categorized as hard (physical) or soft (software) component faults. The components for which faults were identified include temperature, pressure, and air-flow rate sensors, valves, dampers, fans, filters, coils, economizers, VAV boxes, and supply-fan controls. Through a process called fault mode analysis, these faults were mapped to observable symptoms, which are indicators of deviations from expected system behavior. Some of these symptoms are easily observable (for example, if the measured supplyair temperature is colder than the mixed-air temperature when the coiling-cool valve in an airhandler has been commanded closed.) Other faults require the development of more complex models to empirically define normal operating conditions. A total of 28 faults were identified that can be diagnosed in the air-handler (filter/fan/coil) and VAV-box sections of the air side of VAV systems in this set of algorithms. Of these, 18 are automatically correctable soft faults, and 10 are hard faults that require physical repair or replacement.
Development of Self-correction Methods and Algorithms Based on physical principles, equipment design, and the insights gained from the fault-mode analysis, a set of rule-based algorithms was developed to facilitate automatic correction of the identified faults. The structure for these algorithms is the same structure used previously by PNNL in development of self-correcting controls for the mixing-box section of air handlers. This structure is a four-step process to fault correction. The first step, training, establishes the normal range for a set of variables and quantitative empirical relationships among some for later use in fault detection and diagnosis. The next step, passive fault detection (or passive diagnostics) uses observation of fault symptoms during ordinary operation to detect when a fault has occurred. After a fault is detected, proactive diagnostics (tests) are used to isolate 1
which of potentially several possible faults was responsible for the observed symptom. This typically requires more information than is available from normal operation of the system, so specific diagnostic tests are run to create situations that provide additional data and information. After the fault has been isolated, the fault correction process characterizes the fault (e.g., the magnitude of a constant bias in a sensor output rather than erratic, constantly changing, sensor output), formulates a mathematical description of the fault, and then subtracts the fault to compensate the behavior of the faulty device. The correction is implemented via a virtual point (e.g., sensor output, control signal, etc.). The algorithms are documented in detail in a companion report identified in the reference list of this report as Fernandez et al. 2011.
Implementation of Algorithms in Software Code and Integration with the Control System The algorithms were successfully coded in prototype software using the Jython programming language (a hybrid of Java and Python). A subset of the full suite of algorithms was coded. Priority was given to the development of all four steps of the fault-correction process for two key soft faults: biased supply-air flow-rate sensors and biased supply-air temperature sensors. The software was integrated with a Johnson Metasys Building Automation System, using Factory Plant Management Interface (FPMI) software. The software uses two sets of virtual points for sensors. The first enables simulation of sensor faults through virtual sensor points that the control system reads in lieu of the direct sensor measurements. These virtual sensor points enable instigation of faults without damaging equipment and the outputs of these virtual sensors exhibit the characteristics of the fault of interest. The other virtual sensor points enable application of corrections developed by the self-correcting algorithms to the faulty sensor signals to create corrected sensor signals that replace erroneous values to the control algorithms.
Laboratory Testing of the Self-Correcting Software Six laboratory tests were performed. Three tests of supply-air flow-rate sensor bias and three tests of biased supply-air temperature sensors were performed. The three tests for each fault were used to investigate differences in the outcome of the test as functions of fault severity and the values of key selectable thresholds for fault detection. The tests were each initiated with a 5minute period of fault-free operation, during which no faults were detected. In all tests, the passive diagnostic tests successfully detected a fault soon after its instigation. In four tests, the fault was correctly diagnosed, and automatically corrected approximately to the level of the instigated bias. Faults with low severity and higher detection thresholds presented problems, which led to an inconclusive result for one test of the biased supply-air temperature sensor and an incorrect fault determination for one test for the biased supply-air flow-rate sensor. Modest changes in the algorithms are proposed to account for these issues. All methods for fault detection and diagnosis impose a tradeoff between sensitivity and false positive fault detection. Generally, as sensitivity is increased, the probability of false positives increases. Therefore, achieving the right balance between these behaviors is critical to successful deployment of the technology. Further laboratory testing will be used to “tune” the associated variables (e.g., detection thresholds and sensor tolerances).
2
Economic and Impact Assessment of Deployment The targeted market for self-correcting controls in the short-term is built-up air systems, with a longer-term target of packaged HVAC systems. The benefits for self-correcting controls are estimated with PNNL’s Building Energy Analysis Modeling System (BEAMS) using data for California. The market penetration over time is developed based on market diffusion curves, which are based on the Bass diffusion model. The analysis estimates 1.2 to 2.4 TBtu in annual energy savings for the State of California from built-up systems by the end of year 15 after commercial introduction to the market and 1.9 to 3.8 TBtu by the end of 15 years for packaged systems (but with a lower initial impact than built-up systems). Combining the two targeted markets, potential annual savings equal up to $160 million by year 15 with corresponding reductions in CO 2 emissions of 130,000 metric tons.
The Path Forward The final chapter of the report identifies specific proposed improvements to the algorithms to improve their performance, including: •
Piecewise empirical models to capture relationship between variables better when distinctly different behavior exist (e.g., a range of control commands for which no measurable response occurs compared to a range where the response monotonically increases with increasing control command).
•
Use of cooling-coil effectiveness as the basis for relating the temperature change or air as it passes across the cooling coil to supply-fan speed and control signal to the chilledwater valve.
Additional laboratory testing of the full suite of algorithms to better understand preferred values for selectable parameters (e.g., detection thresholds), to ensure that the algorithms minimize false fault detection, and prepare the full suite of self-correcting algorithms for VAV systems for field application. The collective findings of the PNNL team in this project and prior work support development of a software module for self-correcting air-handler sensors, which would be suitable for use in field tests and early commercialization. Although the caabilities of this module would be limited in scope, they would address the important problems of out-of-calibration sensors in air-handling systems.
3
CHAPTER 1: Fault Identification and Analysis This chapter includes three sections. In the first section, the typical single-duct variable-airvolume (VAV) air-handling unit (AHU) and the VAV terminal boxes are briefly described, along with operating modes and sequences of control. Potential faults are presented in the second section for each component of the VAV system, and in the third section, a number of cause-effect diagrams are used to associate fault symptoms to the faults themselves, which are identified in the second section.
System Description The single-duct, VAV air-handling and distribution system is described in this section with the AHU and VAV terminal boxes described separately. The AHU receives return air from the building zones, recirculates a fraction of it and exhausts the rest to the outdoors. The recirculated air mixes with outdoor air in the mixing box. The mixed air is then filtered, cooled (or heated), and then distributed to the terminal boxes, which further control the air-flow to each zone and reheat the supply-air, if necessary.
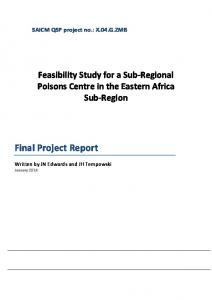
Air-handling Unit (AHU) Figure 1 is a schematic diagram of a generic single-duct AHU for VAV systems. Typical sensors are identified by labeled, colored circles (see the key in the lower-right in the figure).
Figure 1: Diagram of a Typical VAV Air-handling Unit Hot water THW
TCW
Chilled water
PS
Outdoor air (OA) Mixing Box
T/ RHOa
CC
HC
Filter
TMA
To VAV boxes
Variable Speed Supply Fan
THC
TSA
VS
dPF
Exhaust air
Return Fan T/ RHRA
Return air (RA)
T/ RH
Temperature or combined temperature and humidity sensor
P
Pressure sensor
dP
Differential pressure sensor
V
Air flow rate station
Outdoor air (OA) enters the AHU, passing through the outdoor-air damper, and is mixed with the air returned from the space via a return fan. The mixed air sequentially passes through the 4
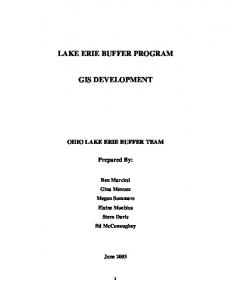
filter, the heating coil (HC), if present, and the cooling coil (CC), which are used to maintain the supply-air at a predefined temperature set point in the supply duct downstream of the supply fan. In practice, the supply fan may be located either upstream of the coils (blow through) or downstream of the coils (draw through, as shown in Figure 1). In many systems, only a cooling coil is present. The supply-fan speed is modulated to maintain the supply-air static pressure at a set point. The return-fan speed is set according to the building’s pressurization requirement and the speed of the supply fan. When the AHU is in operation during occupied periods, it may work in one of four operating modes: heating with minimum outdoor OA, economizing (with OA used for cooling), mechanical cooling with full economizing (100% OA), and mechanical cooling with minimum OA. The specific mode used depends on the outdoor-air conditions. The modes are shown graphically in Figure 2 and are described below.
Figure 2: Air Handler Operating Modes
Heating mode
Economizing mode
Mechanical cooling with 100% OA
Mechanical cooling with minimum OA
Control Signal (%)
100
Cooling coil valve Heating coil valve OA damper
0 Outdoor Air Temperature
Heating mode In this mode, the OA temperature is low enough that the mixed-air (MA) temperature is lower than the supply-air temperature set point, even if the OA damper is at the minimum position required to meet ventilation requirements. Thus, the heating coil valve is controlled to an open position to heat the supply air to its set point, while the cooling coil valve is fully closed, and the OA damper is kept at its minimum position.
5
Economizing (OA cooling) mode At higher OA temperatures, the AHU changes from the heating mode to cooling with OA (i.e., economizing with no mechanical cooling). In this mode, both the heating-coil and the coolingcoil valves are closed and the supply-air temperature is maintained at its set point by modulating the mixing-box dampers (opening the outdoor-air damper and closing the returnair damper as the need for cooling increases). 1 Mechanical cooling with full economizing (100% OA mode) As the cooling load continues to increase, the OA damper opens until it reaches its maximum open position, provided the OA temperature (or enthalpy) remains sufficiently low to provide cooling. If economizing with 100% OA cannot lower the MA temperature to the supply-air set point, mechanical cooling is initiated by modulating the cooling-coil valve open sufficiently to lower the supply-air temperature to its set point to meet the load that economizing cannot meet. This mode of economizing is frequently referred to as integrated. The heating coil valve is kept completely closed in this operating mode. Some economizer controls, known as non-integrated, do not simultaneously use economizing and mechanical cooling. These systems do not enter the mechanical cooling with full economizing mode. Mechanical cooling with minimum OA mode When the OA temperature (or enthalpy) increases above the return-air temperature (or enthalpy) or other pre-specified limit, the OA damper modulates back to its minimum position for ventilation, and mechanical cooling is used to meet the entire cooling load. The cooling coil valve is modulated to provide the required mechanical cooling, while the heating coil valve is kept completely closed.
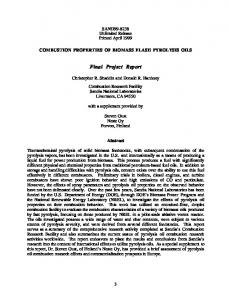
Variable-air-volume (VAV) Terminal Boxes VAV boxes are an integrated part of the VAV system. In contrast to the air-handling unit, VAV terminal units have more varied types such as fan-powered terminal units, induction terminal units, and throttling VAV terminal units with or without reheating. In the current stage of this project, the fault analysis focuses on the single-duct, pressure-independent throttling VAV box with hydronic reheat as shown in Figure 3. This box captures many of the features of simpler terminal boxes, which can be modeled by deleting features of this box (e.g., terminal reheat). For the VAV box shown in Figure 3, the controller modulates the damper to meet thermal load requirements. A minimum air flow rate is preset to satisfy space ventilation. The valve can modulate the hot-water flow rate to the reheat coil to raise the temperature of the supply air to moderate cooling or to provide heat to the space. These VAV terminal boxes work in one of three operating modes: cooling with more than the minimum air flow rate, deadband mode, and reheating. The specific mode of operation
1
Economizing may be controlled on dry-bulb temperature or enthalpy.
6
Figure 3: Schematic diagram of a pressure-independent VAV box with hydronic reheat. Solids lines represent flows of air and water; dashed lines represent control connections. Valve position signal
VAV box controller
Hot water return damperposition signal
Supply-air from AHU HC
damper F
T
air-flow sensor
zone temperature sensor
Air to zone
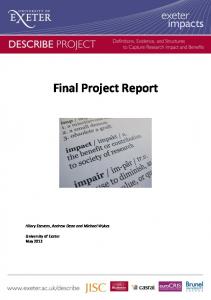
Figure 4: Operating modes for a single-duct, pressure-independent throttling VAV box with hydronic reheat Cooling with more Reheating Deadband than minimum air mode mode flow rate
Control signal (%)
100 Reheating coil valve VAV terminal damper
0 Cooling setpoint
Heating setpoint
7
depends on the zone-air temperature. The operating modes are shown graphically in Figure 4 and are described below. Cooling with more than the minimum air flow rate The VAV box operates in this mode when the zone-air temperature increases above the space cooling set point. In this case, the air flow rate is increased by increasing the damper opening. The reheat coil valve is kept closed. Deadband mode The VAV box operates in this mode when the zone-air temperature lies between the space cooling and heating set points. The air flow rate is maintained at the minimum value to meet the ventilation requirement, and the reheat coil valve is kept closed. Reheating The VAV box enters this mode when the zone-air temperature decreases below the space heating set point. In this case, the valve for the reheat coil modulates to meet the space heating load. The air flow rate may be kept constant at its minimum value or the VAV damper may open further to meet additional space heating load after the reheat valve has opened 100%.
Identification of potential faults Potential faults in air-handling units and the associated VAV terminal boxes can be identified in two steps. First, a preliminary list of potential faults was prepared based on review of the literature on fault detection and diagnostics (FDD) for AHUs and VAV boxes (see, e.g., Fernandez et al. 2009a; Fernandez et al. 2009b; Dexter and Pakanen 2001; Hyvarinen and Karki 1996; Smith and Bushby 2003). The literature has generally focused on detection and diagnosis for a number of common faults (e.g., sensor biases and control logic errors). Little attention has been given to developing a comprehensive list of potential faults and the causes of those faults. Therefore, a second step was used to address this limitation and identify a more complete set of faults and their potential causes. A group of eight researchers identified and discussed additional faults and underlying causes observed in the field to develop a complete set of symptoms, faults and underlying causes. The field experience of each participant in HVAC system implementation, maintenance and troubleshooting varied from approximately 2 years to over 30 years. HVAC faults can be classified into different categories according to criteria such as complete component failure versus performance degradation, hardware faults versus software faults, and self-correctable faults versus faults requiring human corrective action. Because this work is performed in the context of self-correcting HVAC control, each fault is categorized as selfcorrectable (SC), possibly self-correctable (PSC), and not self-correctable (NSC). A SC fault is one that can be corrected through changes in the values of parameters or to software code in the control system. These faults include, for example, incorrect schedules, poorly chosen set points, continually oscillating (or hunting) controls, incorrectly implemented controls, and failed or out-of-calibration sensors. A PSC fault is one for which self correction may be feasible under certain circumstances, one for which the team is presently uncertain that self correction can be implemented, or a fault that may be correctable if additional sensors were installed beyond 8
those ordinarily present on the HVAC system. An NSC fault is one for which restoration to normal system performance from the faulty situation is not possible without physical repair of the system, which requires human intervention. 2 The potential faults for the VAV air-handling system described earlier in this chapter are identified in Table 1 through Table 4. Each table presents the faults for one of the major parts comprising the VAV system: air-mixing section, filter-coil section, fan section, and VAV boxes. The categorization of each fault is given in the right-most column of each table, using the abbreviations SC, PSC and NSC.
NSC faults generally result from physical failure of components, but all physical faults are not NSC faults. In fact, as stated in the text, some physical faults, such as complete failure of some sensors, can be automatically corrected. Furthermore, compensation for some physical faults that improves performance of the system above the performance that would occur by default when a physical fault or failure occurs may be possible. Such fault compensation will be considered in future research.
2
9
Table 1: Air-Mixing Section Faults
Components
Type of Fault/Failure
Temperature or humidity sensors (return air—RA, outdoor air—OA, mixed-air—MA)
Complete failure—no signal Constant bias in signal
Time varying bias in signal
Intermittent signal
Randomly varying signal
Damper and actuator
Stuck damper (fully open, completely closed, intermediate position)
Air leakage when damper is fully closed
Specific Fault
Fault Category (SC, PSC or NSC)* SC
Sensor out of calibration
SC
Sensor installation location fault
PSC
Wiring fault
SC
Long lead wires
SC
Sensor installation of location fault
PSC
Drifting signal
SC
Communication problems such as a wiring fault
PSC
Sensor internal fault
PSC
Wiring fault (e.g., bad solder joint)
PSC
Communication problems such as a wiring fault
PSC
Sensor internal fault
PSC
Induced electrical noise
PSC
Damper motor failure
NSC
Damper linkage broken or disconnected
NSC
Damper or linkage stuck from rust or other corrosion
NSC
Wire to actuator disconnected or no power
NSC
Controller in manual mode
PSC
Damper blade damaged
NSC
Poor damper seals
NSC
Damper not closing completely
PSC
10
Damper modulating but too open or too closed
Mixed-air controller (economizer and outdoor-air ventilation control)
No control signal
Damper obstructed
NSC
Damper linkage bent or loose
NSC
Incorrect actuator output range
PSC
Damper behavior not properly calibrated
SC
Wire disconnected
NSC
Sensor failure
PSC
Control card failure
PSC
Controller in manual mode
PSC
Incorrect minimum outdoor-air damper position setting in control code
SC
Dampers hunting
Improperly tuned control parameters
SC
Actuator output range not set correctly
SC
Error in control code (logic)
SC
Incorrect or poor economizer control
Poorly chosen values for control parameters
SC
Error in coding of economizer control sequence
SC
Fault in CO 2 sensor for demand control ventilation (see “Temperature or humidity sensor faults” for possible causes)
PSC
* SC = self correctable; PSC = possibly self correctable; NSC = not self correctable.
11
Table 2: Filter-coil Section Faults
Components
Type of Fault/Failure
Temperature or humidity sensors (return air—RA, outdoor air—OA, mixed-air—MA)
Complete failure—no signal Constant bias in signal
Time varying bias in signal
Intermittent signal
Randomly varying signal
Damper and actuator
Stuck damper (fully open, completely closed, intermediate position)
Air leakage when damper is fully closed
Specific Fault
Fault Category (SC, PSC or NSC)* SC
Sensor out of calibration
SC
Sensor installation location fault
PSC
Wiring fault
SC
Long lead wires
SC
Sensor installation location fault
PSC
Drifting signal
SC
Communication problems such as a wiring fault
PSC
Sensor internal fault
PSC
Wiring fault (e.g., bad solder joint)
PSC
Communication problems such as a wiring fault
PSC
Sensor internal fault
PSC
Induced electric noise
PSC
Damper motor failure
NSC
Damper linkage broken or disconnected
NSC
Damper or linkage stuck from rust or other corrosion
NSC
Wire to actuator disconnected or no power
NSC
Controller in manual mode
PSC
Damper blade damaged
NSC
Poor damper seals
NSC
Damper not closing completely
PSC
12
Damper modulating but too open or too closed
Mixed-air controller (economizer and outdoor-air ventilation control)
No control signal
Damper obstructed
NSC
Damper linkage bent or loose
NSC
Incorrect actuator output range
PSC
Damper behavior not properly calibrated
SC
Wire disconnected
NSC
Sensor failure
PSC
Control card failure
PSC
Controller in manual mode
PSC
Incorrect minimum outdoor-air damper position setting in control code
SC
Dampers hunting
Improperly tuned control parameters
SC
Actuator output range incorrectly set
SC
Error in control code (logic)
SC
Incorrect or poor economizer control
Poorly chosen values for control parameters
SC
Error in coding of economizer control sequence
SC
Fault in CO 2 sensor for demand control ventilation (see “Temperature or humidity sensor faults” for possible causes)
PSC
* SC = self correctable; PSC = possibly self correctable; NSC = not self correctable.
13
Table 3: Fan Section Faults
Components
Fan (supply fan-SF, return fan-RF)
Type of Fault/Failure Complete failure Off for protection (design safety measures) Decrease in fan efficiency
Pressure sensor (supply-air duct; see “Temperature or humidity sensor faults” in Table 1 for detailed fault or causes) Supply and return fan controller
Specific Fault
Power disconnected Blown fuse
Fault Category (SC, PSC or NSC)* NSC NSC NSC
Dirt accumulation Loose fan blade Other efficiency degradation
Complete failure Biased signal Drifting signal Intermittent signal Randomly varying signal No control signal
NSC NSC NSC PSC PSC PSC PSC PSC
Wire disconnected Sensor failure Controller card failure
Improperly tuned control parameters Improper set point for supply-air duct pressure Controller software Improper value for supplyand parameter value air temperature set point faults Error in control code (logic) Actuator output range not set correctly Inappropriate override of automatic operation (e.g., variable flow rate bypass mode on) * SC = self correctable; PSC = possibly self correctable; NSC = not self correctable.
14
NSC PSC NSC SC SC
SC SC SC
SC
Table 4: VAV Terminal Section Faults
Components
Damper and actuator
Type of Fault/Failure Stuck damper (fully open, completely closed, or intermediate position)
Incorrect minimum or maximum flow rate set point Damper not fully open at maximum position
Air-flow sensor (see “Temperature or humidity sensor fault” in Table 1 for detailed specific causes or faults) Reheat coil
Valve and actuator (for reheat coil)
Complete failure Biased signal Drifting signal Intermittent signal Randomly varying signal Poor heat transfer from fouling (air or water side) Wrong coil capacity (oversized or undersized)
Specific Fault
Damper motor not working Damper linkage broken Damper or linkage frozen from rust or other corrosion Wire to actuator disconnected or no electrical power
Fault Category (SC, PSC or NSC)* NSC NSC NSC NSC
SC
Damper physically obstructed Damper linkage bent or loose Incorrect actuator output range
NSC NSC SC PSC PSC PSC PSC PSC NSC
Design fault Change in space function or usage pattern
Water leakage from coil Reduced water flow rate caused by water-side balance problems Valve stuck (fully open, completely closed, or intermediate position) Water leakage when valve in closed Flow blocked Valve sized improperly
NSC NSC
NSC NSC
NSC
NSC NSC NSC
15
Zone-temperature sensor (see “Temperature or humidity sensor fault” in Table 1 for detailed specific causes or faults) VAV box controller
Valve modulating but not fully opening or closing (not modulating over full range) Complete failure Biased signal Drifting signal Intermittent signal Randomly varying signal No control signal
Controller in manual mode Improperly tuned control parameters Controller software fault
PSC
PSC PSC PSC PSC PSC Wire disconnected Sensor failure Controller-card failure
NSC PSC NSC PSC SC
Improper value for zone-air temperature set point Error in control code
Actuator output range not set correctly *SC = self correctable; PSC = possibly self correctable; NSC = not self correctable.
SC SC SC
Fault mode analysis Different faults may lead to the same symptom, such as an unmet supply-air temperature set point or increased heating energy use. A clear structured relationship between the HVAC faults presented in the last section and their manifested symptoms will assist in developing the strategies for fault detection, isolation and self-correction presented later in this report. We use cause and effect diagrams (also known as fishbone or Ishikawa diagrams) as the tool to explore and document all potential causes (or faults) that result in a single effect (or symptom). Faults (and/or causes of faults) are arranged according to their level of detail or position in the chain of causality. Thus, a significant advantage of this diagram is its ability to clearly illustrate the hierarchical relationship between a specific outcome and the factors that influence or can lead to that outcome. A generic version of the cause and effect diagram is shown in Figure 5. Consider Figure 6 as an example. The symptom (i.e., effect) is an incorrect value from a sensor, which may be caused by a biased signal, a drifting signal, a randomly varying signal, an intermittent signal, or no signal. Each of these causes can be further analyzed to explore underlying causes.
16
Figure 5: Generic Cause and Effect Diagram Adapted for Application to Equipment Faults Fault 2
Fault 1 secondary cause 1
Reference diagram
Primary cause 1
secondary cause 1 secondary cause 2
Primary cause 2
Effect
Fault 4
Fault 3
Figure 6: Cause-effect Diagram for an Incorrect Sensor Measurement Biased signal
No signal
Sensor out of calibration Sensor internal fault
Sensor installation fault range
Sensor location fault
Wiring disconnected Inappropriate sensor type Long wiring
Incorrect power supply
time constant
Wiring fault
Sensor measurement is not correct
Wiring fault Wiring fault
Sensor internal fault Inappropriate sensor type Sensor internal fault Sensor out of calibration Induced electric noise
Drifting signal
Randomly varying signal
Intermittent signal
Because an HVAC symptom is an observed deviation from normal (or expected) operation, it is convenient to select the directly measured variables, control signals and easily derived variables as indicators of symptoms. Cause-effect diagrams are presented for a total of 11 symptoms (effects) in Figure 6 through Figure 16. The symptoms for which cause-effect diagrams are shown are: •
Sensor measurement is not correct
•
MA temperature differs from normal values under similar operating conditions 17
•
Supply-air temperature differs from its set point
•
Supply-air pressure differs from its set point
•
AHU operation mode changes more frequently than normal
•
Supply-air flow rate differs from normal values under similar operating conditions
•
Supply-fan energy use differs from normal values under similar operating conditions
•
AHU heating energy use differs from normal values under similar operating conditions
•
AHU cooling energy use differs from normal values under similar operating conditions
•
Zone-air temperature differs from its set point
•
VAV box flow rate differs from normal values under similar operating conditions.
Cross references to fault analyses for different symptoms are used in Figure 6 through Figure 16 to make the cause-effect diagrams clearer and more legible. For example, Figure 7 refers to Figure 6 regarding the possible faults for temperature sensors, humidity sensors and CO 2 sensors. The cause-effect diagrams are tools used for formulating algorithms for self correction of amenable faults in air handlers and VAV terminal boxes in Chapter 2.
Figure 7: Cause-effect Diagram for the Mixed-air Temperature Differing from Values Normally Occurring Under Similar Operating Conditions CO2 sensor (for AHUs with demand controlled ventilation)
OA or RA humidity sensor (for enthalpy-based economizer)
MA, OA or RA temperature sensor
See Figure 6: Sensor fault mode analysis
See Figure 6: Sensor fault mode analysis
See Figure 6: Sensor fault mode analysis
MA temperature differs from that at normal similar operating conditions
wiring disconnected
damper motor incorrect actuator output range damper obstructed
sequence logic
No control signal
Controller software
control card failure
wrong value for min. position in control code
Poor control parameters tuning
Damper modulating but too open or too closed at a given position
Stuck damper damper linkage (broken, rusty)
wire to actuator disconnected
bent or loose damper blade damaged linkage
Damper leakage at closed position
Inappropriate operation override
poor damper seals
Damper and actuator
Mixed air controller
18
Figure 8: Cause-effect Diagram for the Supply-air Temperature Deviating from its Set Point OA damper
Supply air temperature sensor
Supply air temperature controller wiring disconnected sequence logic
Controller software
See Figure 7: MA temperature different fault analysis
No control signal See Figure 6: Sensor fault mode analysis
control card failure MA sensor location
improper temperature setpoint
Higher OA flow rate when it should be at the minimum
design problem
Wrong MA temperature sensor signal to shutoff AHU
Poor control parameters tuning Inappropriate operation override
air stratification
Supply air temperature differs from its setpoint
Fouling
Valve stuck Valve leakage
Undersized coil capacity space functionality or usage pattern change
Water leakage in the coil
Valve blocked Valve not sized properly
Less water flow rate due to water-side balance problems
Coils
Valve and actuator
Figure 9: Cause-effect Diagram for the Supply-air Pressure Differing from its Set Point
Pressure sensor
Filter
See Figure 6: Sensor fault mode analysis
clogged
Supply air pressure differs from its setpoint wiring disconnected
disconnected blown fuse
No control signal
Complete failure belt off
sequence logic
Controller software
control card failure
motor failure
inappropriate pressure setpoint
Fan stuck at certain speed
Poor control parameters tuning
Supply fan
Inappropriate operation override
Supply fan controller
19
Figure 10: Cause-effect Diagram for the AHU Operation Mode Changing More Frequently than Normal Supply air temperature controller
Improperly tuned control parameters
AHU operating mode changes more frequently than normal sensor internal fault sensor internal fault
Intermittent signal Randomly varying signal
wiring fault
wiring fault induced electric noise
Supply air temperature sensor
Figure 11: Cause-effect Diagram for the Supply-air Flow Rate Differing from its Value Under Similar Normal Operating Conditions Supply air pressure
See Figure 9: Supply air pressure difference fault analysis
improper setpoint value Pressure setpoint inappropriate operation override
disconnected
Supply air flow rate differs from that at normal similar operating conditions
blown fuse
Complete failure See Figure 16: Zone air flow rate difference fault analysis
Fan stuck at certain speed motor failure
belt off
Fan blade loss Fan belt slipped
Zone air flow rate
Supply fan
20
Figure 12: Cause-effect Diagram for the Supply-air Fan Energy Use Differing from Normal Values Under Similar Operating Conditions Supply air pressure
See Figure 9: Supply air pressure difference fault analysis
improper setpoint value Pressure setpoint inappropriate operation override
Supply fan energy differs from that at normal similar operating conditions
Fan belt slipped dirt accumulation See Figure 11: Supply air flow rate difference fault analysis
Decreased fan efficiency blade loss
Supply fan efficiency
Supply air flow rate
Figure 13: Cause-effect Diagram for the AHU Heating Energy Consumption Differing from Normal Values Under Similar Operating Conditions Coils
AHU air mixing See Figure 7: MA temperature difference fault analysis
Water leakage in the cooling coil valve
Water leakage in the heating coil
See Figure 8: Supply air temperature difference fault analysis
See Figure 11: Supply air flow rate difference fault analysis
Supply air flow rate
AHU heating energy differs from that at normal similar operating conditions
Supply air temperature
21
Figure 14: Cause-effect Diagram for the AHU Cooling Energy Use Differing from Normal Values Under Similar Operating Conditions Coils
AHU air mixing
Water leakage in the heating coil valve
See Figure 7: MA temperature difference fault analysis
Water leakage in the cooling coil
See Figure 8: Supply air temperature difference fault analysis
See Figure 11: Supply air flow rate difference fault analysis
Supply air flow rate
AHU cooling energy differs from that at normal similar operating conditions
Supply air temperature
Figure 15: Cause-effect Diagram for Zone-air Temperature Differing from its Set Point VAV box air flow sensor (pressure independent VAV)
VAV box controller
Zone temperature sensor
sequence logic
Controller software
wiring disconnected
improper temperature setpoint
Poor control parameters tuning
Valve leakage (zone in cooling mode)
Valve not sized properly (zone in heating mode)
Valve and actuator
See Figure 6: Sensor fault mode analysis
No control signal
See Figure 6: Sensor fault mode analysis
control card failure
Inappropriate operation override
Valve stuck (zone in heating mode)
Zone temperature differs from its set point Fouling
design problem
damper motor
Undersized capacity Valve blocked Water leakage in coil (zone in heating mode)
Stuck damper wire to actuator disconnected damper linkage (broken, rusty, loose)
space usage changes
Less water flow rate due to water-side balance problems
Incorrect min. or max. air flow rate set point Damper not full open at max position
VAV box damper and actuator
Reheat coil (zone in heating mode)
Assumption: AHU supply air temperature meets its setpoint and the setpoint take a proper value
22
Figure 16: Cause-effect Diagram for the VAV-box Flow Rate Differing from Normal Values Under Similar Operating Conditions VAV box air flow sensor (pressure independent VAV)
Zone temperature sensor
See Figure 6: Sensor fault mode analysis
See Figure 6: Sensor fault mode analysis
VAV-box supply-air flow rate differs from that at normal similar operating conditions damper motor
wiring disconnected sequence logic
Controller software improper temperature setpoint
Poor control parameters tuning
VAV box controller
Stuck damper
No control signal
wire to actuator disconnected damper linkage (broken, rusty, loose)
control card failure
Incorrect min. or max. air flow rate set point
Inappropriate operation override
Damper not full open at max position
VAV box damper and actuator
Assumption: AHU supply air temperature meets its setpoint and the setpoint take a proper value
23
CHAPTER 2: Algorithm Development A set of algorithms was developed to facilitate the detection, diagnosis and correction of faults in the air-handling section of VAV systems, based upon the faults identified in Chapter 1 and an understanding of the chain of causation for those faults, developed in the fault mode analysis. A holistic approach was found important to algorithm development. Analyzing a subsystem in isolation for purposes of fault detection, isolation, and correction is often insufficient. Faults originating outside of a subsystem can manifest as symptoms within the subsystem, and faults originating inside the subsystem can sometimes only be detected as a symptom elsewhere. A holistic approach to SCC, which expands the boundary for analysis beyond the subsystem of interest to all relevant upstream and downstream components, addresses this. For example, the air side of an air-handling system cannot be analyzed independently of the water side of the system. An unexpected temperature measurement on the air side could be caused by a number of factors, one of which is a leaking hot- or cold-water coil. Another often important consideration is comparison of the measurements by a sensor inside a subsystem with measurements by other sensors outside of that subsystem. For example, to check and correct faulty supply-air flow-rate sensor measurements in an air handler, we use airflow measurements in the VAV boxes served by the air handler. To be able to use the VAV measurements for this purpose, the model used for fault diagnosis must be extended beyond the air handler (i.e., the subsystem) itself to the VAV boxes it servers. So, while we originally planned to develop algorithms for the air-handler filter, fan, and coil section alone, the analysis performed by the algorithms was extended to include VAV boxes as well. As another example, consider a supply-air fan that is inducing a lower air flow rate than expected. This could have at its root a problem with the fan itself, such as a slipping belt. The problem could, however, be stuck dampers either upstream or downstream of the filter/fan/coil section (i.e., outside air dampers or VAV dampers) that cause increased air-flow resistance. In development of the algorithms, all components that affect the air side of the VAV system are considered. Fernandez et al. (2009a) developed algorithms for the mixing-box section of an air handler. In this report, algorithms for fault detection, isolation and selfcorrection in all components downstream of the mixing box are considered. These algorithms are presented in detail in Fernandez et al. 2011, which provides more detailed descriptions of the algorithms than presented here and the full set of flow charts. Table 5 provides a full list of the faults that may lead to detection of a fault within those algorithms. For each fault, Table 5 also specifies whether it can be diagnosed through automatic or proactive diagnostic processes, and whether it can be automatically corrected. The algorithms are developed in such a way that they can be easily implemented in a software package that interfaces with an actual system in a laboratory for testing. Figure 17 provides an overview of the process developed at the system level. A red, dotted line encloses a box that conceptualizes the control system loop that the VAV system uses. In a system without selfcorrecting controls, this process is a simple loop that involves taking measurements from sensors, calculating control signals using the sensor readings as inputs, and then controlling the system via the actuators (valves, dampers, etc.) to which the control signals are sent. In the self24
Table 5: Faults Detectable in Algorithms Developed for CIEE Algorithms report
Fault Diagnosed? Yes
Fault Corrected? Yes
HC/CC valve controller software logic fault
Yes
Yes
Fan controller software logic fault
Yes
Yes
Supply-air flow station complete failure
Yes
No
Supply-air fan complete failure
Yes
No
Supply-air fan belt slipping/decreased fan η
Yes
No
Supply-air flow station biased
Yes
Yes
Supply-air flow station erratic
Yes
No
CC valve stuck open or leaking
Yes
No
HC valve stuck open or leaking
Yes
No
MA temperature sensor biased
Yes
Yes
MA temperature sensor erratic/not working
Yes
No
HC temperature sensor biased
Yes
Yes
HC temperature sensor erratic/not working
Yes
No
SA temperature sensor biased
Yes
Yes
SA temperature sensor erratic/not working
Yes
No
Filter is clogged/oversized
Yes
No
Filter differential pressure sensor biased/ erratic/not working
Yes
No
Filter has fallen down or is installed incorrectly
Yes
No
VAV box damper does not modulate in upper half of signal range
Yes
No
VAV box damper does not modulate in lower half of signal range
Yes
No
VAV box flow sensor is biased
Yes
Yes
VAV box reheat coil valve stuck open or leaking
Yes
No
Discharge air temperature sensor biased
Yes
Yes
Discharge air temperature sensor erratic/not working
Yes
No
VAV box flow station erratic/ not working
Yes
No
VAV box damper stuck
Yes
No
VAV box incorrect maximum flow set point
Yes
Yes
Type of Fault Hunting CC valve
25
Figure 17: Master Flowchart for Self-Correcting Controls
Self Correcting Controls( SCC) Automated Fault Detection, Diagnosis and Correction Loop
Run Passive Diagnostics?
Yes
Passive Diagnostics
Run Proactive Diagnostics?
No
Get Virtual Sensor Readings from Control System
Proactive Diagnostics
No Correctable fault flag active?
Yes
Virtual Sensor Readings
Create Virtual Sensor Readings
Yes
Control System Loop
Control System
Update Virtual Sensor Points
Take Measurements from sensors
Fault Correction
Corrected Biases Training OAF Training
Filter-Fan-Coil-VAV Training 1 Filter-Fan-Coil-VAV Training 2
Store Data for ‘Hunting’ passive diagnostics
Filter-Fan-Coil-VAV Training 3
26
No
correcting controls process, there are additional steps in the process. The actual sensor measurements are input to virtual sensors, which generate corrected sensor values (when warranted). The corrected virtual values are then used by the control algorithms in place of erroneous sensor readings so that the controller sends the correct actuation signal to the actuator. From the standpoint of control, these virtual sensor readings replace the actual readings. A green dotted line in Figure 17 encloses a separate process that executes simultaneously with the control system loop. This process is the automated fault detection, diagnostics, and correction loop (AFDDC). This process takes in sensor data from the virtual sensor points as well as control code information from the control system and continuously monitors those values for signs of faults. As long as no faults are detected, the system runs through a sub-loop within this process that periodically checks for faults. The process of checking for faults is called Passive Diagnostics because faults are detected through passive, observation monitoring only, without affecting the control process. When a fault is detected by the passive diagnostics, a process called Proactive Diagnostics is initiated. The proactive process diagnoses (or isolates) the fault. For example, passive diagnostics may detect that a set of sensors is displaying readings that are inconsistent with one another based on the physical relationships among the measured variables. Proactive diagnostics determine which, if any of the sensors, is reading improperly, or if the detected inconsistency might be caused by something like stuck dampers or leaking valves that produce the unexpected (abnormal) measured conditions. Proactive diagnostics involve taking control of the system away from its ordinary automatic operation and placing it into alternative states controlled by the AFDDC software. The AFDDC software places the system into specific conditions that enable isolation of the fault to a specific component (or cause). The proactive diagnostics can run automatically, immediately upon fault detection, can be scheduled to run at specific times, or can be run manually, when it is convenient for the building operator or occupants. Once the fault has been successfully diagnosed, the AFDDC Fault Correction process starts, wherein the specific component is recalibrated so that its fault can be automatically accounted for by the control system via the creation of a new virtual sensor point. This is only possible, however, for “soft faults” or faults that exist in automatically correctable sensors or in the control code itself. The criteria for a sensor being automatically correctable varies, but generally involves having a working sensor available somewhere else in the system or a model that can be used along with correct measurements of other conditions in the physical process to infer the correct value that the faulty sensor would provide if it were working properly. Another dotted line in Figure 17 encloses a set of Training processes. Many of the fault detection algorithms rely on models of the physical system behavior under normal operation. Because each system is inherently different, these models are empirically in an initial training process that could be part of the system’s commissioning. In training, the system’s normal (fault-free) operation is empirically and quantitatively characterized.
27
Training Four training algorithms are grouped under the set of training processes shown in Figure 17. The first one, titled “OAF Training” is used for detecting mixing-box faults, and is described in Fernandez et al. (2009b). The others are training algorithms for the filter/fan/coil section of the air handler of the VAV system and are described in detail in Fernandez et al. (2009a). The “Filter/Fan/Coil/VAV Training 1” process, referred to subsequently as Training 1, develops empirical relationships between the normal supply-air flow rate (V S ) and two parameters: 1) U SF , the fan control signal, which is a voltage or current signal sent to the fan and is normalized to a range of 0-100% and 2) U damp , the normalized control signal for the outdoor-air damper. The variable U damp determines the outdoor-air damper position and, as a result, V S , given a value of the fan speed. While VAV dampers individually can affect air-flow resistance, all the dampers in the VAV boxes served by a specific air handler are typically controlled together to maintain the supply-air static pressure at a fixed value (its set point). This training algorithm fits the collected data to a two-factor polynomial regression equation. Training 2 develops two empirical relationships. The first relates the normal temperature rise of the air as it passes across the fan (from fan motor heat rejection) as a function of V S . Measurements of the temperature increase are taken at discrete values of the fan speed over its full range, and are stored as a lookup table. Temperature increases from the fan for values of V S between the measured values of the table are determined by linearly interpolating. The second relates the normal filter pressure drop to V S , again based on measurements of the pressure drop across the filter at selected values of V S over its full range. The measured results are stored in a lookup table and values of pressure drop for intermediate values of V S are obtained by linear interpolation. Training 3 develops an empirical relationship between ΔT SM , which is the difference between the supply-air temperature and the mixed-air temperature, and two variables, V S and the control signal for the chilled-water valve of the cooling coil, U CC . Measurements are made and a polynomial curve fit is used to establish the relationship.
Passive Diagnostics Figure 18 shows the main passive diagnostics process for the filter/fan/coil and VAV box sections. The passive diagnostics process is serial, executing a set of algorithms sequentially until a fault is found, at which point the Passive Diagnostics process terminates and the proactive diagnostics process begins (according to how it is scheduled) or until all of the algorithms have passed without detection of a fault. Key information can be obtained from the passive diagnostics about the nature of the fault that dictates which proactive tests are necessary to isolate and diagnose the fault. The specific passive diagnostic rule that detects the symptom of a fault provides one clue. Other clues can sometimes be obtained from the sequence of passive diagnostic tests. For example, if Fault 1 always causes both symptom A and symptom B, and Faults 2 and 3 cause symptom B, but not symptom A, then if the occurrence of symptom A is checked before the presence of symptom B and found not to be present, Fault 1 can be ruled out when symptom B is present. This type of logic is employed in the passive diagnostic algorithms through use of a set of “flags.” These 28
Figure 18: Passive Diagnostics for Filter/Fan/Coil/VAV Boxes
Control Signal Logic
Check for Hunting Cooling Coil
Passive Diagnostics: Filter-Coil-Fan-VAV No Passive Diagnostics: Fault Detected?
No
Check Supply Air Temperature
Fault Detected?
Yes
Fault Detected?
Yes
Fault Detected?
Yes
Fault Detected?
Yes
No
Setpoint Maintenance
No
Check Fan and Coil Signals
No
VAV Box Passive Diagnostics
Check Filter Pressure Drop
No
Main Program:Run Proactive Diagnostics?
29
numbered flags are raised at specific points in the passive diagnostic process when faults are detected. The flags then direct the flow of proactive diagnostic tests so that only the remaining tests necessary to diagnose the observed symptom are performed. Descriptions of the individual algorithms run sequentially in the passive diagnostics follow [see also Fernandez et al. (2011)]. Check for Hunting Cooling Coil – This algorithm checks that the cooling coil valve is not “hunting.” A hunting actuator is one that oscillates around the position it is seeking. Poorly set values of control constants in the proportional-integral (PI) or proportional-integral-derivative (PID) controller for the cooling coil valve actuator can cause this. The algorithm for checking for hunting uses a database of past cooling coil command signals to detect whether hunting is taking place. No proactive diagnostics are needed to detect this fault. Control System Logic – This algorithm checks to ensure that flow through the air-handler heating coil and cooling coil do not occur at the same time. It checks whether both the heating and cooling coils are properly off when the system is economizing with the outdoor-air damper signal U damp < 100% open and that the heating coil is off when the system is economizing at U damp =100%. Violation of these faults indicates incorrect control algorithms for the air-handler damper system, and can be automatically corrected with a correct algorithm upon detection; no proactive diagnostics are needed to isolate the fault. Check Supply-air Temperature – This algorithm uses training data from Training 2 to determine if the observed fan heat gain matches the training closely enough. This is done by monitoring the difference between the supply-air temperature and cooling coil inlet temperature. If the heating and cooling coils are off, the allowable supply-air temperature is bound on both sides by temperature tolerances to the temperatures expected from Training 2. If one of the coils is commanded on, the allowable supply-air temperature is only bounded on one side, i.e., if the cooling coil is on, the algorithm checks to make sure the supply-air temperature sensor is not reading higher than the cooling coil inlet temperature plus the fan temperature rise and the temperature tolerances. Set Point Maintenance - This algorithm checks whether both the supply-air temperature and supply-air static pressure are correctly within acceptable ranges of their set points. If the supply-air temperature cannot maintain its set point, but the coils are not being commanded on, or if the supply-air static pressure cannot maintain its set point, but the fan is not being commanded on, this indicates a control software (or algorithm) fault that is automatically correctable. Otherwise, these conditions might indicate a fault somewhere else in the system. Check Fan and Coil Signals – This algorithm uses the regression equations from Training 1 and Training 3 to determine if a) the current value of the coil coil control signal, U CC , is providing the expected degree of cooling, as measured by the difference between the supply-air and mixed-air temperatures, given the current supply-air flow rate and b) if the current value of the supply-fan control signal, U SF , is providing the expected supply-air flow rate, given the current outdoor-air damper position. Readings that are outside of acceptable ranges could indicate a number of different faults. VAV Box – This algorithm checks the sensor measurements from the VAV boxes for symptoms of faults. First, for each VAV box whose reheat coil has been off for at least 10 minutes and whose damper is at least partially open, it checks whether the VAV-box discharge-air 30
temperature is correctly within specified tolerances of the supply-air temperature set point. Next, it checks whether the room temperature is within the proper range of the heating and cooling set-point temperatures. This condition is acceptable, especially given the time delay between detecting that the room temperature differs from its set point by an unacceptable amount and subsequently returning the room temperature to the set point. If the temperatures are outside acceptable tolerance of the set points, the algorithm also checks whether the VAVbox flow meter indicates a box air-flow rate correctly above its minimum set point, and when heating is required, that the reheat coil for the VAV box is commanded on. If these conditions are violated a fault is present. Check Filter Pressure Drop- This algorithm uses Training 2 data to determine whether the fan’s differential pressure sensor is reading within acceptable ranges. If the pressure drop is too high, a clogged filter that needs to be replaced could be indicated. If it is too low, the filter could be missing, have fallen down out of its frame, or have been improperly installed. Low filter pressure drop could also indicate that the sensor itself is faulty or that a fan fault exists. As with most other instances of fault detection, further proactive diagnostics are needed to isolate the specific fault.
Proactive Diagnostics Proactive diagnostics begin subsequent (either immediately, or scheduled later) to the detection of a passive fault that cannot be automatically isolated and corrected. Figure 19 shows the overall process of proactive diagnostics for the filter-fan-coil-VAV section. Unlike the passive diagnostics, there is more management of the direction of logical flow through this proactive diagnostics process to efficiently schedule the tests - eliminating unnecessary testing. Proactive diagnostics always start with Check Fan. A fan that is completely stuck or not functioning could potentially lead to all of the undiagnosed faults detected in the passive diagnosis. Thus, verifying that the fan is, in fact, working is critical. This test starts by checking that the measured supply-air flow rate matches its baseline values for full, medium and off fan speeds established during training. If the values do not adequately match, the flow rate is verified to increase as the supply-fan command is increased. A failure to meet this criterion could indicate either a broken/unresponsive fan or a supply-air flow station that is not working. A further check is used to differentiate these two potential causes. The filter differential pressure is checked to verify that it increases as the fan control signal is increased. If it too, does not change appreciably, the fault is associated with a broken supply fan. If the differential pressure does change, it implicates a complete failure of the supply-fan air-flow station. If, on the other hand, the measured flow rate does increase as the fan control signal is increased, either the fan or the flow station has dropped out of calibration compared to its training baseline, but is still operating. A further test in this case checks for two symptoms that may exist if the problem is a decrease in fan efficiency (i.e., fan producing decreased mechanical output for a given control signal – one cause is a slipping fan belt). If this were the only fault, the deviation from training flow rates would be much greater at a full fan control signal 100% compared to the deviation when the control signal is zero (i.e., off). The filter pressure drop would also be lower for each specific fan control signal than the pressure drop during training, 31
Figure 19: Proactive Diagnostics for Filter/Fan/Coil and VAV Box Sections: Main Flowchart
Proactive Diagnostics: Filter-Coil-Fan-VAV
Passive Diagnostics: Fault Detected?
Yes Fault Diagnosed?
Yes
Check Fan
No
Proactive Flag A?
No
Yes Yes Check Temperature Sensors and Coils
Yes Proactive Flag B,D?
Fault Diagnosed?
No
No Check Filter Proactive Flag G?
No
Yes
Proactive Flag C,F?
Yes
Fault Diagnosed? VAV Box: Temp Sensors and Reheat Valves
No Fault Diagnosed? Proactive Flag C?
Yes Fault: Static Pressure Sensor
Proactive Diagnostics: Inconclusive FaultClear Flags
No
VAV Box: Check all Dampers
VAV Box: VAV Box Flow Sensor
No
Fault Diagnoesd?
VAV Box: Check Max Flow Setpoint
No
Fault Yes Diagnosed?
No Proactive Diagnostics: Inconclusive FaultClear Flags
Yes
Main Program:Run Fault Correction?
32
Yes
because the fan is not able to drive as much flow and, therefore, not able to establish as strong a pressure drop across the filter. The satisfaction of these two criteria automatically implicates a faulty fan. A partially clogged filter muddies the analysis, however, because clogging may act to increase the filter pressure drop. The assumption here is, however, that a clogged filter alone will not decrease the fan air flow rate sufficiently compared to training baseline values to bypass this entire set of algorithms. If however, the partially clogged filter occurs in conjunction with a slipping fan belt, for instance, it may hinder the detection of the slipping fan belt using this process (flowchart) alone. Thus, a somewhat redundant algorithm is used to distinguish between these different situations. This algorithm compares the measured supplyair flow rate against a few the individual VAV box measured flow rates. This requires closing all of the VAV dampers but one and measuring the flow rate at the fully open damper. Normal leakage through the network of closed dampers and ductwork needs to be accounted for (which is the purpose of the leakage flow testing performed in training). This training-based leakage flow is subtracted from the measured supply- air flow rate before comparison to the VAV box measured flow rate. If the two flow rates roughly match, the result implicates decreased efficiency of the supply fan, whereas if the values do not match adequately, this implicates a working, but faulty, supply-air flow station. If no faults are found in the fan or flow station, the measured flow rate should be reasonably close to the baseline (training) value, and selected proactive tests can then be scheduled according to clues from the passive diagnostics. If Proactive Flag A,B, or D is active (these flags are raised in response to several conditions in the passive diagnostics; see Fernandez et al. 2011), the Check Temperature Sensors and Coils process is performed. A fault can be traced to one of the three air-handler temperature sensors (mixed air, cooling-coil inlet air, or supply air) or to a leaking heating or cooling coil. Fault isolation is accomplished by setting the heating and cooling coil control signals to zero and monitoring the differences between the values of the three mixing-box temperature sensors at three fan speeds: low, medium, and full. Much of the differentiation relies on the temperature difference across a leaking heating or cooling coil decreasing with increased air-flow rate (even as the total heating or cooling imparted to the air stream increases). If the temperature change across the coils does not decrease with increasing flow rate, the fault is almost certainly with one of the temperature sensors, which can then be isolated by checking the three sensor readings against each other, accounting for fan temperature rise. The Check Filter process follows next. It runs when a flag for a fault occurs in the filter check during the passive diagnostics (and no faults have been isolated thus far). The algorithm isolates physical filter faults from pressure-drop sensor faults by setting the supply fan to zero and checking the measured pressure drop. If it is non-zero, the fault is isolated to the pressure sensor. If the pressure drop reads zero with the fan off, the fault is isolated to either a clogged filter, if the pressure drop was higher than the training value when the fault was detected, or to a missing, fallen or improperly installed filter, if the pressure drop was lower than the training value when the fault was detected. After the Check Filter process is completed, all potential faults in the air-handler filter-fan-coil section have been considered, leaving faults in the VAV boxes undiagnosed. When a flag is raised in the passive diagnosis that indicates the possibility of a VAV-box fault, four VAV box tests is performed sequentially until a fault is isolated.
33
The first test for VAV boxes, VAV Box: Check All Dampers, uses sensed data for a range of fan speeds for all VAV boxes to isolate either faulty dampers or faulty VAV-box flow sensors in any of the VAV boxes. Stuck dampers and completely non-functional VAV-box flow stations are indistinguishable at this point. If one of these faults exists, a new flag is raised, and an additional test is used to isolate the fault. If no faults are found in the VAV-box flow stations and there is a flag for a specific faulty VAV box from the passive diagnostics, the next algorithm, VAV Temperature Sensors and Reheat Valves runs. This process differentiates between faulty (leaking or stuck) VAV-box reheat valves and faulty VAV discharge-temperature sensors by checking for a coil heat-gain signature (decreasing temperature difference across the reheat coil at increasing air-flow rate). If this signature is present, the fault is traced to a leaking or stuck open reheat valve. If instead the temperature difference across the reheat coil (difference between the VAV-box discharge air temperature and the temperature of air entering the VAV box) is unchanged or increases , the fault is traced to the discharge-air temperature sensor itself. If the discharge-air temperature remains constant at all reheat coil command signals, the fault is traced to a reheat coil valve that is stuck closed. Otherwise, no faults related to VAV box temperature sensors or coils can be diagnosed. If no faults have yet been diagnosed in the VAV box, the VAV Box Flow Sensor process is used to isolate a faulty VAV-box flow-rate sensor. In this process, the VAV-box flow rate is checked against the supply-air flow rate at low fan speeds, when all other VAV-box dampers are completely closed. The assumption here is that at low fan speeds there will be negligible leakage flow through the other dampers. This assumption needs to be verified. If it is not a valid assumption, further data collection (training) may be required to quantify low-fan speed VAV system leakage (in addition to the full-speed leakage already performed). If the VAV-box flow rate does not match the supply-air flow rate, the result indicates a faulty VAV flow meter. If the readings match and Flag H is active, the fault is traced to a stuck VAV-box damper. If no faults are detected after completion of the VAV Temperature Sensors and Reheat Valves process, one final VAV diagnostic test called VAV Box Maximum Flow Rate Set Point is performed. This process tests whether the VAV box can meet its maximum flow-rate set point. At this point, all other components of the VAV box have been verified to be working properly, so this test should represent a conclusive test of the VAV box’s capability. If it passes this test, the detection of a fault in the passive diagnostics may have been an aberration, and the diagnostics should be reset, the system returned to normal operation, and the passive diagnostics instigated once more. There is one exception to this, however. If the supply-air pressure sensor could not meet its set point (leading to Proactive Flag C), and all other components and processes are determined function properly within the proactive diagnostics, the supply-air pressure sensor is deemed to be faulty by the process of elimination. There is no other way to test this sensor for a VAV system as instrumented.
Fault Correction Figure 20 shows the overall process flowchart for automatic fault correction. Automatic correction of diagnosed soft faults occurs subsequent to their diagnosis in the fault correction process. Two classes of soft faults (software errors and hunting) are corrected automatically as 34
Figure 20: Fault Correction: Filter/Fan/Coil and VAV sections SCC: Active Flag for Correctable Fault? Yes
Fault Correction: Filter-Coil-Fan-VAV Active Flag Mixed Air Temperature Sensor Fault
Yes
Fault Correction: Mixed-Air Temperature Sensor
Yes
Fault Correction: Heating-Coil Air Temperature Sensor
Yes
Fault Correction: Supply-Air Temperature Sensor
No Active Flag for Main Duct Cooling Coil Inlet Temperature Sensor Fault
No Active Flag for Supply Air Temperature Sensor Fault
No Active Flag for VAV Box Discharge Air Temperature Sensor Fault
Yes
Fault Correction: VAVBox Discharge-Air Temperature Sensor
Yes
Fault Correction: VAV-Box Flow Sensor
Yes
Fault Correction: Supply-Air Flow Sensor
No Active Flag for VAV Box Flow Meter Fault
No Active Flag for VAV Box Flow Meter Fault
No
35
SCC: Run Passive Diagnostics
they are detected in the passive diagnostics. This leaves one class of soft faults (sensor biases) that need to be corrected after the proactive diagnostics. There are four types of sensors and two types of flow-rate sensors that can be corrected using the processes presented here. The correction process involves calibrating the faulty sensor against a working sensor in the same airstream. First, however, the behavior of the faulty sensor is checked to determine whether its output is nearly constant over time compared to the working sensor against which it will be calibrated. If the difference is constant, this indicates a bias that can be readily determined and corrected by subtracting a constant value for the incorrect measured value in a virtual sensor placed in the control system loop. If it is not constant, correction of the fault will require a more complex behavioral characterization not developed yet, or the sensor may behave erratically or have failed in some way, both of which require that the faulty sensor be replaced. The mixed-air and cooling coil inlet air-temperature sensor outputs can be recalibrated directly from the other, unbiased sensor. Likewise the supply-air and any VAV-box air-temperature sensor can be recalibrated directly by using the other. The supply-air flow-rate sensor and any of the individual VAV-box air-flow sensors can be recalibrated to the other, unbiased sensor, but account must be made for air-flow leakage between the measurement points (i.e., using a, albeit simple, model). Most properly working dampers still leak slightly when they are completely closed, so it may not be possible to entirely isolate the flow into any one damper. Therefore, a leakage flow is characterized during Training 2 that can be used in this fault correction. The leakage flow rate is the difference between the supply-air flow rate and the flow rate at any one VAV damper that is open while the rest are closed.
36
CHAPTER 3: Implementation and Testing The algorithms developed to detect, diagnose, and correct faults in VAV systems were implemented for laboratory testing by coding them into a programming package that interacts with Factory Plant Management Interface (FPMI) software. In this project, FPMI is used as a human/machine interface (HMI). FPMI is a web-deployed front-end to the Object Linking and Embedding for Process Control (OPC) server and Structured Query Language (SQL) Database. Using the FPMI client interface, users can monitor live data, specify the control variables and sensor paths, and instigate diagnostic and correction tests, including the instigation of faults. Using a database server, the test data and control variables can be stored automatically. In this way, the algorithms we develop are implemented in software code that is used to control the physical system that has been constructed as a test facility for investigating the performance of the algorithms for automated fault detection and correction.
Description of the Test Facility Section 3 of Fernandez et al. (2009b) provides a description of the laboratory facility used to test the VAV system algorithms. In brief, the system is composed of a chilled water loop that provides chilled water to the coiling coil of an air handler. The air handler draws outdoor air from the environment and mixes it with return air from the room the air handler is located in. An electric heater maintains this room at a temperature set point. The mixed air flows through the chilled water coil, then through a fan and a flow-rate sensor. The test facility has been updated for this project to include four pressure-independent VAV boxes. From the discharge of air handler, where the flow rate sensor is located, the air stream branches to each of the VAV boxes. Each VAV box includes a damper, discharge-air temperature sensor, and a flow meter.
Implementation of Algorithms Priorities were set for implementation of the algorithms in software code to ensure compatibility with the available project budget. The goals of this prioritization were the following: •
Code a set of algorithms that enabled testing the entire process (fault detection, diagnostics, and correction), albeit for a limited number of faults
•
Focus on automatically-correctable, or soft faults, as opposed to hard faults
•
Include faults that had many diagnostic pathways so that diagnosis of the correct fault could be verified
•
Include all of the training algorithms, because data from these training tests is a valuable tool for future refinement of the algorithms.
With these goals in mind, a set of algorithms was selected that enabled implementation of faults in the supply-air temperature sensor and the supply-air flow meter, while differentiating these faults from those originating from the cooling-coil valve, the fan, other temperature sensors, and the VAV-box flow sensors. 37
The algorithms developed and the subset implemented in software are identified in Table 6.
Table 6: Algorithms Developed and Implemented (Coded) for Testing
Algorithms Developed
Algorithms Coded
Training Algorithms Filter-fan-coil-VAV section, training algorithm 1: expected fan signal Filter-fan-coil section of VAV air-handler, training algorithm 2: single-factor variables Filter-fan-coil-VAV section, training algorithm 3: expected cooling coil valve signal Passive Diagnostics Algorithm for Control System Loop Control system loop: store data for hunting passive diagnostics Passive Diagnostics Algorithms Automatic detection and correction of hunting Control system logic Check supply-air temperature Set-point maintenance Check fan and coil signals Check filter pressure drop Proactive Diagnostics Algorithms Check fan Check supply-air flow sensor Temperature sensors and coil valves Check filter VAV: Check all dampers VAV: Temperature sensors and reheat valves VAV: VAV-box flow sensors VAV: VAV-box maximum flow rate set point Fault Correction Algorithms Mixed-air temperature sensor Cooling-coil inlet-air temperature sensor Supply-air temperature sensor Supply-air flow-rate sensor Control system logic 1 Control system logic 2 VAV discharge-air temperature sensor VAV flow sensor
38
Results Analysis of Training Data Data from the training provides insight into how parts of the system perform, which can be critical to inform the process of fault detection. The set of algorithms developed here captures the variations of supply-air flow rate with supply-fan command signal and outdoor-air damper position, the temperature rise across the supply fan (from rejected motor heat) and the filter pressure drop with supply-air flow rate, and the temperature change from the mixed air to the supply air as a function of supply-air flow rate and the cooling-coil command signal. The training tests each involved tracking how these key variables change as a function of one or multiple system parameters. Given these “baseline” relationships, faults can be detected when values of these dependent variables differ the values indicated by the baseline (training) values for the same combination of conditions (values of independent variables). This section reports on how the functional variations observed and the empirical relationships captured from laboratory tests. Chapter 5: Future Work describes some proposed changes to the models to better model the relationships among these variables. Training 1 Algorithm Training test #1 uses an algorithm designed to capture the supply-air flow rate as a function of the supply-fan command signal and outdoor-air damper position. The supply-fan command signal directly affects the flow rate, while it was postulated that the outdoor-air damper would also affect the flow rate by changing the upstream resistance to air-flow. Figure 21 shows the results of testing. It reveals two things: 1) the supply-fan command signals do not correspond directly to fan speed (e.g., measured in revolutions per minute—rpm) and 2) a weak relationship exists between the outdoor-air dampers position and fan speed for the system tested. The supply fan does not start operating until the command signal rises above 25% or so. Because the relationship between supply-fan flow rate and the control signal, U SF , was modeled by a 2nd order polynomial, the regression process does not fit the constant supply-fan flow rate of zero for values of U SF less than 25% well. The model gives values less than zero for values of the fan control signal less than 25%. The fit of the model for U SF