Fingerprint Classification with Neural Networks Hugo Vieira Neto Centro Federal de Educação Tecnológica do Paraná Departamento Acadêmico de Informática Avenida Sete de Setembro 3165, 80230-901, Curitiba-PR, Brasil
[email protected] Díbio Leandro Borges Universidade Federal de Goiânia Escola de Engenharia Elétrica Praça Universitária s/n - Setor Universitário, 74605-220, Goiânia-GO, Brasil
[email protected]
Abstract This paper presents some intermediate results on fingerprint classification adopting a neural network as decision stage, in order to evaluate the performance of a discrete wavelet transform as feature extraction technique. Some issues on the image acquisition, preprocessing and segmentation are also discussed.
1. Introduction The automated classification and matching of fingerprint images has been a challenging problem in pattern recognition over the past decades. Several approaches for the solution have been proposed, however none of them is considered complete and the problem is still an open question. Traditional attempts to reach the solution make use of specific algorithms to extract unique fingerprint features, such as ridge orientation and minutia detection techniques [1] [2]. Minutia are particular types of discontinuities in the ridge patterns, such as endings, bifurcations and islands. Unfortunately, the minutiabased approach is very sensitive to noise and deformation. Perturbations in the acquisition process can easily create artificial minutia or cause existing ones to disappear [3]. This particular problem has stimulated the development of special algorithms for enhancement and feature purification of fingerprint images [4]. Other disadvantages are the complexity and the computational expensiveness that arise from the use of such specific methods.
This work proposes a more general feature extraction scheme for fingerprint images using a discrete wavelet transform and presents a preliminary evaluation of its usefulness and suitability for neural network classifiers. In [3] is suggested the use of neural networks as a possible solution for the case of fingerprint matching. Many reasons indicate the suitability of a connectionist approach, such as its robustness to noise and its adaptiveness. Furthermore, neural networks are trainable from examples and can be fine-tuned to fit the requirements of specific applications. In [5] a comparison is made between conventional statistical classifiers and neural network classifiers for fingerprint applications, which provides some motivating results on the performance of neural networks for this particular task.
Acquisition
Preprocessing
Segmentation
Classification
Feature Extraction
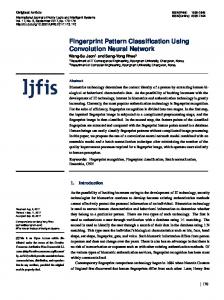
Figure 1. Fingerprint classification - block diagram Our classification method can be divided into 5 stages: image acquisition, preprocessing, segmentation, feature
extraction and classification, as Figure 1 illustrates. Each of these stages will be further described in details in the following sections.
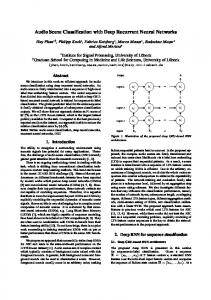
2. Image Acquisition Neural networks demand the availability of several samples of each pattern in order to be trained. Therefore, it is necessary to construct a database of digitized fingerprint images to train and test a neural network classifier. A special device for the collection of fingerprint images was built based on a simple principle, which is employed in most of the commercial devices for this purpose. A right-angle prism was used to project the fingerprint ridge pattern over a CCD camera. One of the square sides of the prism was illuminated by a light source. As the incoming rays of light reflect on the diagonal side of the prism, they interact with the touching finger ridges, forming the correspondent image on the other square side of the prism. The formed image is then focused on the CCD camera by means of a lens. Figure 2 illustrates the entire process.
3. Preprocessing and Segmentation Due to the simplicity of the fingerprint acquisition device, a perfect focus on the entire area of the images could not be achieved. For this reason, a high-pass filter with high-frequency emphasis [6] was applied to the original images, in order to enhance borders and minimize the focus problem. After the high-pass filtering, the resulting images were submitted to a histogram equalization to enhance contrast.
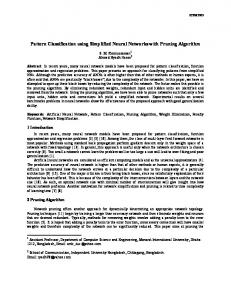
(a)
Prism
CCD Camera Lenses
Light Source Figure 2. Fingerprint image acquisition. The signal from the CCD camera was then digitized by a frame grabber board installed on a Macintosh computer, resulting in images of 320 x 240 pixels in size, with 5 bits gray scale per pixel and resolution of 320 dpi. The first data set assembled for this work contains 50 images of 10 distinct fingerprint patterns with 5 different samples of each pattern, corresponding to the fingers of both hands of only one person. The second data set consists of 160 images of 16 distinct fingerprint patterns with 10 different samples of each pattern, corresponding to both thumbs of eight different people.
(b) Figure 3. Preprocessing and segmentation of the first samples of a fingerprint class: (a) original image; (b) result of the preprocessing and segmentation, with the resulting reference region (128 x 128 pixels) and region of interest (32 x 32 pixels) assigned on the image. Once the preprocessing was done, it was necessary to find the region of interest within the images, where the
feature extraction would take place. The segmentation was divided into two different processes. The first sample images of each class of fingerprints were converted from gray-scale to binary through a fixed threshold value. The binary images were then submitted to morphologic operations of erosion and dilation, respectively, leaving in the image a single area of black pixels corresponding to the center of the region of interest.
images. The central 32 x 32 pixels region of the first cropped image was stored as a reference region to be used in the cropping process of the remaining images. Figure 3 shows one of the results of preprocessing and segmentation of the first sample of a fingerprint class. The remaining image samples of each fingerprint class were segmented in a different manner. The reference region of the first sample was slided across the remaining images corresponding to the same class. The correlation coefficient between the reference region and the local subimage was evaluated at each step and the position of maximal correlation was used as a reference for the 128 x128 pixels crop within the image. Figure 4 shows one of the results achieved. The correlational-based cropping minimizes translation problems. However, this method was observed to be quite sensitive to rotation. Some of the resulting 128 x 128 pixels images, using the segmentation process just described, are shown in Figure 5. The cropped images were used as inputs to the feature extraction stage.
(a)
(a) (b) Figure 5. Cropped images: (a) first sample crop of a fingerprint class (by means of mathematical morphology); (b) other sample crop of the same class (by means of maximal correlation with the reference region).
(b) Figure 4. Correlational-based cropping of the remaining samples: (a) first sample crop of a fingerprint class (by means of mathematical morphology); (b) another sample crop of the same class (by means of maximal correlation with the reference region). The next step was the detection of the boundary rectangle of the resulting black area, whose geometric center would be the center of a 128 x 128 pixels square image to be cropped from the corresponding preprocessed
The use of images taken from thumbs was observed to be less susceptible to rotation problems. This happens because the sizes of thumbs are close to the size of the window on the acquisition device, that provides a physical limitation for the degree of freedom of rotation. Besides that, thumbs provide larger useful areas on the resulting images. These were the reasons for the use of thumbs in our second data set.
4. Feature Extraction The extraction of relevant features of a pattern is not a trivial task. For the particular case of the feature extraction from fingerprint images several approaches have been developed, most of them based on special characteristics from the fingerprint patterns, such as
ridge orientation and minutia detection [1] [2]. A Karhunen-Loève transform of the ridge orientation pattern of fingerprints was used in [5] to obtain feature vectors, which were used as inputs to statistical and neural networks classifiers. A difficulty that follows from these traditional approaches is the use of specialized algorithms and operators to extract ridge orientation and minutia information. On the other hand, the use of mathematical transforms to map the patterns into a more suitable space in terms of representation is a plausible possibility. The use of a discrete wavelet transform as the feature extraction method was considered in this work for several reasons. One of them is that the FBI has achieved some motivating results with fingerprint data compression using a special specification of a wavelet transform [7] [8]. In fact, adequate wavelet transforms allow perfect reconstruction of the original signal, while providing good frequency-time localization at multiple scales [9] [10]. Furthermore, discrete wavelet transform algorithms seem to be more easily implemented on digital signal processors or specific hardware than the algorithms that follow from ridge or minutia-oriented techniques. 0 1 2 3
4
7
8
19
20
23
24
5
6
9
10
21
22
25
26
11
12
15
16
27
28
31
32
13
14
17
18
29
30
33
34
35
36
39
40
37
38
41
42
43
44
47
48
45
46
49
50
51
54
55
56
57
60
61
58
59
62
63
52
53
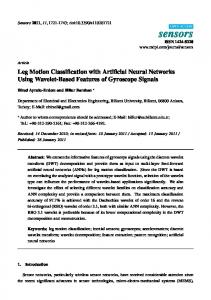
Figure 6. WSQ subband structure. The proposed wavelet-based feature extraction scheme followed the FBI’s directions to evaluate the wavelet transform over the fingerprint images. The images were normalized and then submitted to the wavelet transform, according to the subband structure defined in the WSQ Specification (see Figure 6). Also, the filters implemented follow the symmetric boundary conditions specified in [7] and [8]. However, the filter coefficients used to compute the transform were not the same suggested by the FBI. Instead, we adopted a least
asymmetric compactly supported wavelet basis with 8 vanishing moments [11]. The FIR filter coefficients that generate this wavelet basis are given as follows: h =[0.001890, -0.000303, -0.014952, 0.003809, 0.049137, -0.027219, -0.051946, 0.364442, 0.777186, 0.481360, -0.061273, -0.143294, 0.007607, 0.031695, -0.000542, -0.003382] The feature vectors were assembled from the resulting 64 wavelet coefficients from the subbands 0, 1, 2 and 3. The reason of this choice is the fact that these subbands contain compacted information from the entire image, as they represent the deepest wavelet analysis. Before training the neural network, a statistical analysis was made upon the obtained feature vectors of the first data set, in order to verify their validity. For that, the mean correlation coefficients between vectors from the same class and from different classes were evaluated. The results of this evaluation for the 10 concerned classes (f1 to f10) are given in Table 1. As expected, the correlation coefficients between the members of the same class were always greater than the ones between the members of different classes. The worst case of similarity between classes occurred between classes f6 and f7 of the first data set, whose corresponding fingerprint images in fact presented very similar ridge patterns. Nevertheless, these classes were still distinguishable, as will be shown in the next section.
5. Neural Network Classification To confirm the efficiency of our feature extraction method, a feed-forward neural network with a single hidden layer was trained with a gradient descent technique [12] [13]. This simple backpropagation network was composed of 64 input nodes (corresponding to the dimension of the feature vectors), 16 hidden nodes and 10 or 16 output nodes (corresponding to the number of concerned fingerprint classes of the first and second data sets, respectively). The supervised training was done with 4 elements from each class for the first data set and with 5 elements from each class for the second data set. In both cases the training patterns were presented randomly to the neural network. The remaining elements of each data set were used to test the neural network. Figures 7 and 8 show the behavior of the mean square error for the first and second data sets, during training. The curves correspond to learning constants (α) of 0.1, 0.2, 0.4 and 0.8. It is possible to observe the fast convergence of the networks in all cases. The training phases were divided in five stages of 100 epochs, with intermediate tests to evaluate the resulting mean square error of the neural networks. The results of these intermediate tests are given in tables 2 and 3.
f1 f1 f2 f3 f4 f5 f6 f7 f8 f9 f10
f2
0.8796 0.1075 0.1316 0.0600 0.3552 0.3791 0.2762 0.1537 0.1063 0.3815
f3
f4
f5
f6
f7
f8
0.1075 0.1316 0.0600 0.3552 0.3791 0.2762 0.1537 0.8064 0.4995 0.2847 0.1505 0.1024 0.3306 0.3790 0.4995 0.8167 0.4315 0.2336 0.1670 0.3705 0.3885 0.2847 0.4315 0.7866 0.1883 0.3942 0.3901 0.4562 0.1505 0.2336 0.1883 0.7623 0.3713 0.2531 0.0952 0.1024 0.1670 0.3942 0.3713 0.9692 0.7862 0.2425 0.3306 0.3705 0.3901 0.2531 0.7862 0.9733 0.4760 0.3790 0.3885 0.4562 0.0952 0.2425 0.4760 0.7739 0.2826 0.4929 0.5091 0.0932 0.4386 0.6438 0.5231 0.1967 0.4099 0.3802 0.2450 0.5553 0.5984 0.1746 Table 1. Mean correlation coefficients between classes.
f9
f10
0.1063 0.2826 0.4929 0.5091 0.0932 0.4386 0.6438 0.5231 0.8226 0.5358
0.3815 0.1967 0.4099 0.3802 0.2450 0.5553 0.5984 0.1746 0.5358 0.7053
0,9
Mean Square Error
0,8 0,7 0,6
Alpha=0.1
0,5
Alpha=0.2
0,4
Alpha=0.4
0,3
Alpha=0.8
0,2 0,1 0 1
3
5
7
9
11
13
15
17
19
21
23
25
27
29
Epochs x 10
Figure 7. Mean square error during training - first data set.
1 0,9 Mean Square Error
0,8 0,7
Alpha=0.1
0,6
Alpha=0.2
0,5
Alpha=0.4
0,4
Alpha=0.8
0,3 0,2 0,1 0 1
3
5
7
9
11
13
15
17
19
21
23
25
27
29
Epochs x 10
Figure 8. Mean square error during training - second data set.
Epoch α=0.1 α=0.2 α=0.4 α=0.8 0,55763 0,25128 0,06299 0,01950 100 0,23605 0,07831 0,02305 0,00829 200 0,11036 0,04614 0,01411 0,00540 300 0,06677 0,03265 0,01037 0,00403 400 0,04690 0,02547 0,00824 0,00325 500 Table 2. Resulting mean square errors during intermediate tests - first data set.
Epoch α=0.1 α=0.2 α=0.4 α=0.8 0,76686 0,37676 0,12168 0,06457 100 0,40285 0,11182 0,06617 0,04826 200 0,20495 0,07416 0,05596 0,04316 300 0,13387 0,06051 0,04978 0,04059 400 0,11077 0,05323 0,04609 0,03892 500 Table 3. Resulting mean square errors during intermediate tests - second data set.
It was possible to accurately identify all of the members of each class in the final tests, fact that suggests the wavelet transform feature extraction scheme can be suitable for fingerprint images. The results achieved with the second data set are considered to be more relevant than the ones obtained with the first data set. The first reason for this statement is the number of classes concerned in each data set (10 classes for the first versus 16 classes for the second data set) and the second is the number of samples of each class used to train and test the neural networks (four samples to train and only one sample to test for the first data set versus five samples to train and five samples to test for the second).
WSQ Specification, was discussed. Nevertheless, there is still plenty of work to be done concerning the evaluation of other possible arrangements. Future work comprehends studies upon the dimension of feature vectors and tests with other neural network architectures. Moreover, the data sets used in this work were very limited. This way, other experiments need to be done with enlarged data sets in the future.
6. Conclusions A wavelet-based method was proposed to be used as the feature extraction stage in fingerprint classifiers that make use of neural networks. Until this moment, the proposed classification method has given the expected results, from statistical and connectionist stand points. However, it has shown to be quite sensitive to rotation and translation. The latter weakness is minimized by the correlation-based segmentation of the images and the former is less incident when patterns of thumbs are used. Adequate results of the wavelet transform have shown to be dependent on the quality of the images and their normalization according to the WSQ Specification. The preprocessing stage of the presented scheme plays the role of enhancing the images so that better results can be achieved. The small amount of hidden nodes associated with the fast convergence presented by the neural networks suggest a high separability of classes. The adoption of the simplest backpropagation algorithm (without the use of a momentum factor) and the accurate classification of test patterns also indicate the obtained classes are consistent. These facts may be interpreted as a measure of suitability of the wavelet transform as feature extraction method for fingerprint classification. A preliminary approach, which directly employs the wavelet coefficients of specific subbands according to the
References: [1] Ratha, N. K., Chen, S., Jain, A. K., Adaptive Flow Orientation-Based Feature Extraction in Fingerprint Images, Pattern Recognition, vol. 28, n. 11, 1995, pp. 1657-1672. [2] Karu, K., Jain, A. K., Fingerprint Classification, Pattern Recognition, vol. 29, n. 3, 1996, pp. 389404. [3] Baldi, P., Chauvin, Y., Neural Networks for Fingerprint Recognition, Neural Computation, n. 5, 1993, pp. 402-418. [4] Hung, D. C. D., Enhancement and Feature Purification of Fingerprint Images, Pattern Recognition, vol. 26, n. 11, 1993, pp. 1661-1671. [5] Blue, J. L., Candela, G. T., Grother, P. J., Chellappa, R., Wilson, C. L., Evaluation of Pattern Classifiers for Fingerprint and OCR Applications, Pattern Recognition, vol. 27, n. 4, 1994, pp. 485501. [6] Gonzalez, Rafael C., Woods, Richard E., Digital Image Processing - Third Edition, Addison-Wesley, 1992. [7] Federal Bureau of Investigation, WSQ Gray-scale Fingerprint Image Compression Specification, document IAFIS-IC-0110v2, 1993. [8] Brislawn, C. M., Bradley, J. N., The FBI Compression Standard for Digitized Fingerprint Images, Proc. SPIE, vol. 2847, 1996. [9] Graps, A., An Introduction to Wavelets, IEEE Computational Science & Engineering, summer 1995. [10] Vaidyanathan, P. P., Djokovic, I., Wavelet Transforms, The Circuits and Filters Handbook, IEEE Press, 1995, pp. 134-219.
[11] Daubechies, I., Orthonormal Bases of Compactly Supported Wavelets, Comm. on Pure and Applied Mathematics, vol. 41, 1988, pp. 909-996. [12] Lippmann, R. P., An Introduction to Computing with Neural Nets, IEEE Acoustics, Speech and Signal Processing Magazine, 1987, pp. 4-22. [13] Rumelhart, D. E., Widrow, B., Lehr, M. A., The Basic Ideas in Neural Networks, Communications of the ACM, vol. 37, n. 3, 1994, pp. 87-92.