Sep 27, 2012 - reviews). One class of random walk has received close attention in ... dependent roughness) and the scaling of its free-energy fluctuations.
PHYSICAL REVIEW E 86, 031144 (2012)
Finite-temperature and finite-time scaling of the directed polymer free energy with respect to its geometrical fluctuations Elisabeth Agoritsas,1 Sebastian Bustingorry,2 Vivien Lecomte,3 Gr´egory Schehr,4 and Thierry Giamarchi1 1
DPMC-MaNEP, Universit´e de Gen`eve, 24 quai Ernest Ansermet, 1211 Gen`eve, Switzerland CONICET, Centro At´omico Bariloche, 8400 San Carlos de Bariloche, R´ıo Negro, Argentina 3 Laboratoire de Probabilit´es et Mod`eles Al´eatoires (CNRS UMR 7599), Universit´es Paris VI & Paris VII, site Chevaleret, 175 rue du Chevaleret, 75013 Paris, France 4 Laboratoire de Physique Th´eorique et Mod`eles Statistiques (UMR du CNRS 8626), Universit´e Paris Sud, 91405 Orsay Cedex, France (Received 28 June 2012; published 27 September 2012) 2
We study the fluctuations of the directed polymer in 1 + 1 dimensions in a Gaussian random environment with a finite correlation length ξ and at finite temperature. We address the correspondence between the geometrical transverse fluctuations of the directed polymer, described by its roughness, and the fluctuations of its free energy, characterized by its two-point correlator. Analytical arguments are provided in favor of a generic scaling law between those quantities, at finite time, nonvanishing ξ , and explicit temperature dependence. Numerical results are in good agreement both for simulations on the discrete directed polymer and on a continuous directed polymer (with short-range correlated disorder). Applications to recent experiments on liquid crystals are discussed. DOI: 10.1103/PhysRevE.86.031144
PACS number(s): 05.40.−a, 05.20.−y, 68.35.Ct, 46.65.+g
I. INTRODUCTION
Brownian particles have provided in physics one of the first example of systems whose geometrical properties differ radically from those encountered in regular classical mechanics: Instead of following “smooth” (differentiable) trajectories, those particles follow continuous but “rough” (nondifferentiable) paths due to the persistent stochastic thermal forces they withstand at finite temperature. This phenomenon is described in statistical mechanics by a random walk, whose geometrical self-similarity at large scale is depicted by scaling laws and scaling exponents. These scalings are known to be distinctive features of universality classes, gathering different physical phenomena sharing a common representation. A natural question regarding such random paths pertains to the influence of the environment: How does a path in a uniform medium differ, for instance, from a path in a medium with random inhomogeneities? And how do such differences manifest in scaling properties? Beyond particle trajectories, those paths also describe generic interfaces or random manifolds between distinct phases. Example systems include imbibition fronts [1,2], wetting and spreading interfaces [3,4], cracks propagating in paper [5], avalanches of pinned interfaces [6,7], burning fronts [8,9], interfaces in magnetic [10–12] or ferroelectric materials [13,14], and generic growth phenomena [15,16]. A wide selection of those systems, although ranging from microscopic to macroscopic scale and presenting a large variety of microphysics, have been described as generic disordered elastic systems (see Refs. [17–23] for reviews). One class of random walk has received close attention in the past decades, the one-dimensional Kardar-Parisi-Zhang (KPZ) [24] universality class (see Refs. [25,26] for recent reviews), since it is related to questions of extremely varied nature [27] ranging from Burgers equation in hydrodynamics [28], directed polymers in random media [29,30] to the parabolic Anderson model [31], eigenvalues of random matrices [32–34], vicious walkers [35–38], dynamics of cold 1539-3755/2012/86(3)/031144(18)
atoms [39], and transport in one-dimensional stochastic [40] or deterministic models [41]. Here we address the link between the scaling properties of the geometry of the directed polymer (through its scaledependent roughness) and the scaling of its free-energy fluctuations. We examine in particular the role of temperature for those scalings and its possible interplay with finite disorder correlation length, especially at finite time. More precisely, let us denote by t the direction of time of the growing directed polymer (DP), which also represents the “scale” at which a generic interface is examined, and by y the transverse direction in which fluctuations occur (see Fig. 1). One important aspect of the KPZ universality class is that the fluctuations of the (suitably centered) free energy F¯ (t,y) are expected to behave as follows in the large time asymptotics: � � y 1 (t→∞) , (1) F¯ (t,y) ∼ a t 3 χ 2 bt3 where a and b are constants which depend on the physical parameters of the system (e.g., temperature T , elasticity c, disorder strength D, and disorder correlation length ξ in the ¯ is a t-independent model we use; see Sec. II), and χ (y) “random variable” whose distribution characterizes the fluctuations of y-dependent observables. Note that in some systems, e.g., liquid crystals, the quantity F¯ (t,y) scaling as (1) is, up to a translation, the height of an interface and not its free energy [42–44]. For a directed polymer with fixed endpoints (as depicted in Figs. 1 and 2) and with uncorrelated random ¯ environment (ξ = 0) it has been shown [45,46] that χ (y), ¯ is equivalent in considered as a (stochastic) function of y, distribution to the so-called Airy2 process (minus a parabola), which is a stationary determinantal point process. It follows from this relation (1) that, in the large t limit, the fluctuations of F¯ (t,y), at fixed y, are described by the Tracy-Widom distribution F2 [47]. The latter distribution F2 , which can be written as a Fredholm determinant involving the Airy kernel, describes the fluctuations of the largest eigenvalue of random matrices belonging to the Gaussian Unitary Ensemble (GUE).
031144-1
©2012 American Physical Society
ELISABETH AGORITSAS et al.
PHYSICAL REVIEW E 86, 031144 (2012)
The directed polymer model we study is defined in Sec. II and the generalized scaling form we propose is presented and discussed analytically in Sec. III. Numerical results are gathered in Sec. IV for the discrete DP and Sec. V for its continuous version. We discuss experimental implications and draw our conclusions in Sec. VI. The details of some computations are gathered in the Appendices.
t t1
II. MODEL AND SCOPE OF THE STUDY
0
y1
y
A. DP formulation
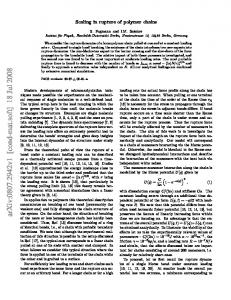
FIG. 1. Schematic view of a continuous directed polymer of trajectory y(t) starting in y = 0 at time 0 and arriving in y1 at time t1 , in a quenched random potential V (t,y). These point-to-point configurations correspond to the “droplet geometry” of growth models.
Still at ξ = 0, remarkably, it was shown that at finite time t the distribution of F¯ (t,y), for fixed y, can still be written as a Fredholm determinant, which involves a nontrivial finite t generalization of the Airy kernel [48–51]. In this paper we focus on the effects of finite temperature and finite disorder correlation length (ξ > 0 or discrete DP) at finite time for which we propose a generalized scaling relation which reads formally � � � y 1 , (2) F¯ (t,y) ∼ � a [ B(t)] 2 χ √ � b B(t) where B(t) is the roughness of the directed polymer, defined as the second cumulant of the transverse fluctuations along y at fixed time t. A more accurate statement is made in Sec. III B in terms of the two-point correlator of F¯ (t,y); see Eq. (22). The large time asymptotics (1) is then recovered (t→∞)
4
from B(t) ∼ t 3 . Our motivation for investigating the case ξ > 0 comes from the study of physical or chemical experiments where the disordered potential always presents a finite correlation length, which, albeit microscopic and often inaccessible to direct measurement, may still induce observable effects at large scales [23]. In particular, we probe the dependence of the constants � a ,� b on the system parameters by distinguishing a high- and a low-temperature regime due to ξ > 0. The appearance of those regimes generalizes the ones affecting some specific observables (such as the roughness of the interface, studied in Refs. [52,53]).
We focus on the directed polymer formulation: the trajectory of the polymer is described by a continuous coordinate y(t), starting from y = 0 at t = 0 (see Fig. 1), and growing in a random potential V (t,y) along the direction t. The energy of a trajectory y(t) of duration t1 is the sum of elastic and disorder contributions: � � t1 � c 2 dt (3) H[y,V ; t1 ] = [∂t y(t)] + V (t,y(t)) . 2 0 The first term flattens the polymer by penalizing its deformations (with an intensity encoded in the elastic constant c), while the second term tends to deform it. At fixed disorder V , the weight of all trajectories starting from 0 and arriving in y1 at time t1 is given by the path integral � y(t1 )=y1 1 Dy(t) e− T H[y,V ;t1 ] , (4) ZV (t1 ,y1 ) = y(0)=0
(we set the Boltzmann constant equal to 1 and denote thereafter the inverse temperature by β = T1 ). The mean value of an observable O depending on the value of y at final time t reads, at fixed disorder dy O(y)ZV (t,y) . (5) �O[y(t)]�V = dy ZV (t,y) Here and hereafter, the integrals dy over the DP endpoint run by convention on the real line. We also consider a discrete version of the same system, illustrated in Fig. 2 and described in Sec. IV. The weight ZV (t,y) is not normalized to unity [ dy ZV (t,y) �= 1 in general], but the path integral (4) is chosen so that at zero disorder dy ZV ≡0 (t,y) = 1 at all times. With this choice of normalization, it is known from the Feynman-Kac formula [54–57] (see also Ref. [58] for a discussion) that the weight ZV (t,y) evolves according to the “stochastic heat equation” [59–61] T 2 1 ∂ ZV (t,y) − V (t,y)ZV (t,y), (6) 2c y T while the free energy FV (t,y) = −T log ZV (t,y) obeys the Kardar-Parisi-Zhang equation [24,56] ∂t ZV (t,y) =
t
T 2 1 ∂ FV (t,y) − [∂y FV (t,y)]2 + V (t,y). (7) 2c y 2c The presence of the so-called nonlinear KPZ term makes the study of this equation particularly difficult; in particular the typical extension of the excursions along the direction 1 y does not scale diffusively at large times (i.e., y ∼ t 2 ) but 2 ζ superdiffusively (y ∼ t where ζ = 3 is the KPZ exponent) [24,28,32,45,56,62]. ∂t FV (t,y) =
y
1
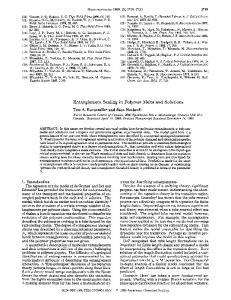
FIG. 2. (Color online) Geometry of the discrete DP model we consider. Allowed steps are y(t + 1) − y(t) = ±1. The longitudinal and transverse axes correspond to the directions t and y, respectively.
031144-2
FINITE-TEMPERATURE AND FINITE-TIME SCALING OF . . .
The distribution of the random potential V (t,y) determines the statistical properties of the free energy. We denote by an overline �O[y(t)]�V the statistical average over the disorder V . One case is well understood: When V (t,y) is a centered Gaussian uncorrelated random potential (ξ = 0), that is, when V (t,y) has a Gaussian distribution with zero mean and twopoint correlator V (t,y)V (t ,y ) = Dδ(t − t)δ(y − y),
(8)
PHYSICAL REVIEW E 86, 031144 (2012)
Note that the knowledge of the fluctuations of the free energy FV is not sufficient to retrieve the mean value of physical observables from (5): In general the full distribution of FV is required. The free-energy fluctuations described by the correlator C(t,y) still provide physically relevant information, for instance, combined to scaling arguments [67], or as the starting point of the “toy-model” approach where the freeenergy distribution is approximated to be Gaussian [53,68–71] (see also Sec. III C).
it is known for long [56] that the infinite-time distribution of the free energy is that of a two-sided Brownian walk: � � � 1 T (9) Prob[F (y)] ∝ exp − dy [∂y F (y)]2 . 2 cD In other words, FV (t,y) has a steady-state Gaussian distribution whose correlator reads: cD
|y − y|. [FV (t,y ) − FV (t,y)]2 −−−→ (10) t→∞ T The value 23 for the KPZ exponent is known since the work of Henley, Huse, and Fisher [56] and Kardar, Parisi, and Zhang [24] and Kardar [62,63], but this result has been proven in a mathematical framework much later [32,45]. The free-energy distribution has recently been determined by a variety of methods both in the physics [48,51,64] and in the mathematics [49,50,65] communities (see Ref. [66] for a review).
III. SCALING OF THE FREE-ENERGY CORRELATOR C¯ ξ (t, y) A. A generalized scaling relation
Let us first identify a definition of the free-energy correlator which is suitable to study its finite-time scaling. The correlator [FV (t,y2 ) − FV (t,y1 )]2 is invariant by translation along y only in the infinite-time limit (10). To extend this property at finite time, one may take advantage of the “statistical tilt symmetry” (STS) [72–74] of the model which ensures that the free-energy splits into two contributions (see, e.g., Ref. [58] for a derivation at nonzero ξ ): T 2π T t y2 + F¯V (t,y) FV (t,y) = c + log 2t 2 c
� � � � elastic contribution
B. Generalization of the free-energy fluctuation scaling
In the large- but finite-time limit, Pr¨ahofer and Spohn [45] have shown that at ξ = 0 the correlator C(t,y) = [FV (t,y) − FV (t,0)]2 obeys the following scaling relation:
2 2� C(t,y) = t 3 g˜ PS yt − 3 ,
(11)
(12)
¯ ∼ cD ¯ for small |y| ¯ [which thus gives (10) in the |y| with g˜ PS (y) T ¯ saturates to a constant at large |y|. ¯ limit t → ∞] while g˜ PS (y) ¯ is, up to nonuniversal longitudinal and This function g˜ PS (y) transverse length scales, the mean square displacement of the Airy2 process discussed below in Eq. (42). Our aim in this paper is to propose and test an extension of the scaling relation (12) (i) at finite time and/or (ii) for a disorder V (t,y) presenting short-range correlations. Much less is known in those two cases. To implement shortrange correlations (on a transverse scale ξ ) in the disorder distribution, we assume that it is still zero-mean Gaussian distributed with correlations of the form V (t,y)V (t ,y ) = Dδ(t − t)Rξ (y − y).
(13)
Such correlations in direction y on a range of order ξ are described by a rounded delta peak Rξ (y), normalized to unity [ dy Rξ (y) = 1] and by the strength D of the disorder. Note that even for ξ > 0 the distribution of V is invariant by translation along y, as in the uncorrelated case (8) (which corresponds to ξ = 0). For simplicity we may assume in explicit examples that Rξ (y) is a normalized Gaussian of variance 2ξ 2 : RξGauss (y)
=�
1 4π ξ 2
e
−
y2 4ξ 2
.
(15)
disorder contribution
2
t where c y2t + T2 log 2πT is the elastic contribution, which fully c captures the initial condition, while F¯V (t,y) is invariant by translation along y in distribution [in mathematical terms [49] F¯V (t,y) is “stationary” along y]. It represents the contribution of the disordered potential to the free energy, since F¯V (t,y)|V ≡0 = 0 by definition. Note also from (15) that the initial condition ZV (0,y) = δ(y) simply writes F¯V (0,y) = 0. This form of initial condition is technically different from the “sharp wedge” often considered to pin the polymer in y = 0 at initial time [50] and which also ensures ZV (0,y) = δ(y). This translational invariance allows us to define our correlator of interest:
C¯ ξ (t,y − y) = [F¯V (t,y ) − F¯V (t,y)]2 ,
(16)
where we have made explicit the dependence in ξ arising from the distribution of V . The STS ensures that (16) depends in y and y only through the difference y − y, while the invariance of the distribution of the disorder V by the reflection V → −V ensures that the function C¯ ξ (t,y) is even with respect to its argument y. Note that at ξ = 0, the steady-state result (10) implies cD C¯ ξ =0 (t,y) −−−→ |y|. t→∞ T
(17)
The correlator C¯ ξ (t,y) is actually the connected correlator of the full free energy FV (t,y) (see Appendix A)
(14) 031144-3
C¯ ξ (t,y − y) = [FV (t,y ) − FV (t,y)]2 − [FV (t,y ) − FV (t,y)]2 .
(18)
ELISABETH AGORITSAS et al.
PHYSICAL REVIEW E 86, 031144 (2012)
It is known that the roughness presents at small times a diffusive regime (ζth = 12 ) and at large times a random manifold (RM) superdiffusive regime (ζRM = 23 ) [24,32,56]. In terms of power laws of the time t, we have the two asymptotic regimes
¯ξ (t, y) C
� B(t) ∼ t
∼ξ
t
y
FIG. 3. Schematic plot of the correlator C¯ ξ (t,y) of F¯ , as a function of y at fixed t. It is rounded close to the origin (|y| � ξ ), � for intermediate length (ξ � |y| � t ), and goes to a varies as D|y| constant at large length (|y| � t ).
The expression (16) is useful to explicit the translational invariance, while (18) enables us to consider cases where no decomposition such as (15) is available (as for the discrete DP). How can we interpret the crossover from the initial condition C¯ ξ (0,y) = 0 to the steady-state result C¯ ξ (∞,y) ∝ |y|? y2
The weight ∝e−βc 2t −β FV (t,y) of a trajectory ending in y at time t depicts a particle of position y (time t being fixed) in an “effective potential” made up of a parabolic potential describing thermal fluctuations and of an “effective disorder” F¯ , which recapitulates the disorder landscape V perceived by the polymer from its starting point. Heuristically one expects that F¯ remains almost flat at initial times since the polymer endpoint y(t) has not explored much of its random environment, while at larger times F¯ becomes a “random force potential” with cuspy correlator C¯ ξ (t,y) ∝ |y|, at least on a transverse region |y| � t of typical size t in which the polymer endpoint has mainly been confined. We show in Appendix B that this intuitive picture is indeed correct: At all finite times, lim|y|→∞ ∂y C¯ ξ (t,y) = 0. The correlator C¯ ξ (t,y) thus has to switch from the absolute value behavior |y| for |y| � t to a plateau for |y| � t (see Fig. 3), at some scale t increasing and diverging with t. We assume that the effect of the correlation length ξ is to round C¯ ξ (t,y) at small |y| � ξ . The following scaling relation is thus expected to hold:
−1 � C¯ ξ (t,y) = t Cˆ −1 t y , (19) t ξ
C¯ ξ (t,y) =
(21)
�
� B(t) Cˆ √ ξ
B(t)
� y . √ B(t)
(22)
Before testing numerically this scaling law in different models (see Secs. IV and V), we discuss analytical arguments in favor of (22). On one hand, linearizing the dynamics at short time in Eq. (7) one finds that the fluctuations are diffusive: B(t) = Tct . In this approximation, the correlations of the free-energy rescale as follows (see Appendix C): � � y cD � lin lin ¯ ˆ , Cξ (t,y) = Bth (t) C √ ξ √ T Bth (t) Bth (t)
(23)
where Bth (t) = Tct is the thermal roughness. The scaling func¯ given in Eq. (C27), and depending on the properly tion Cˆ ξlin ¯ (y), adimensional variables y¯ and ξ¯ , is independent of the parameters c, D, and T . The behavior of C¯ ξlin (t,y) is as qualitatively expected with a rounding on a scale ξ , a plateau at large y, and a developing linear behavior in between, as plotted in Fig. 4. On the other hand, at zero ξ and large time, the result (12) of Pr¨ahofer and Spohn is compatible with (22): This corresponds 4 to the RM asymptotics B(t) ∼ t 3 . To address the RM regime at nonzero ξ , we study in the next paragraph a toy-model approach of the DP.
B. Asymptotic transverse fluctuations
The variance of the DP endpoint y(t), called the roughness, is the simplest length quantifying the spatial extension of the polymer at a given time t: dy y 2 ZV (t,y) 2 . (20) B(t) = �y(t) �V = dy ZV (t,y)
for t → ∞
(see also Refs. [53,58] when the disorder correlation length ξ √ is nonzero). We propose that t ∼ B(t) in Eq. (19), in other words,
¯
where the scaling function Cˆ ξ (y) depends on the physical parameters c, D, T , and ξ . At zero ξ , it is compatible with the 2 large time behavior (12), provided that t ∼ t 3 for t → ∞. We now have to identify the crossover length t at nonzero ξ and finite time.
t
4 3
¯ξlin (t, y) C
−
for t → 0,
t
y FIG. 4. (Color online) Graph of the correlator C¯ ξlin (t,y) of F¯ obtained in the linear approximation (C23), as a function of y for different times t (parameters are c = 1, D = 1, T = 1, and ξ = 0.3). Time increases geometrically from bottom (t = 2−4 ) to top (t = 210 ) curves.
031144-4
FINITE-TEMPERATURE AND FINITE-TIME SCALING OF . . . C. A winged DP toy model
In the infinite-time limit and at zero ξ , the free energy FV (t,y) is translationally invariant in distribution and has a Gaussian distribution (9). The statistical tilt symmetry expresses that the free energy splits at finite time in two contributions (15), of which only F¯V (t,y) is translationally invariant. The idea of the toy model [68–70,74] is to assume that for large t and finite ξ the distribution of the reduced free energy [denoted F¯ toy (t,y)] remains in a good approximation Gaussian, with zero mean and correlations toy C¯ ξ (t,y − y) = [F¯ toy (t,y ) − F¯ toy (t,y)]2 .
2�2
. For � ξ = 0, this writing yields the ¯ � ξ = 0 infinite-time result (10) C(∞,y) = D|y|, provided � = cD . For ξ > 0, R�toy (t,λ) encodes for F¯ the finite that D toy
T
ξ
ξ
correlation length of the disorder V : The absolute value becomes rounded around the origin up to a scale ∼� ξ . The problem of the form (25) of the correlator is that it implies toy � at large |y|, while we have seen that C¯ ξ (t,y) C¯ ξ (t,y) ∼ D|y| goes to a constant in the limit |y| → ∞ at all finite times t. To overcome the discrepancy between this exact result toy � −λ2�ξ 2 , one may rather study a and the model R�ξ (t,λ) = De toy correlator C¯ ξ (t,y) of the form (25) with additional saturation “wings” � R�ξ (t,λ) = D
λ2
toy
λ2
+
−2 t
e−λ
2�2
ξ
,
(26)
� at intermewhich still presents a behavior C¯ toy (t,y) ∼ D|y| diate y (ξ |y| t ), but goes to a constant at large |y| (|y| � t ). Note that more generically one can consider a toy correlator of the form
� toy � 1 λ t f2 (λ� R�ξ (t,λ) = Df ξ ), (27) in which the rounding due to the finite disorder correlation � length appears in the factor � f2 (λξ ) and the crossover at scale t in the function f1 λ t .1 In particular, scaling properties of the roughness arise from the form (27). Note that this form makes sense in principle only when the scales t and � ξ are separated enough (with t > � ξ ). We compute in Appendix D the roughness of this model in the Gaussian Variational Method (GVM) approximation, in the large t limit. The computation yields, in the random manifold regime − B(t) = B(t)| −1 t =0
� 2
� D , t + O −2 t 2 c t
where the RM roughness in the absence of wings ( −1 t = 0) is given by B(t)| −1 t =0
t ∼
(29)
� � � 13 D 2 t3. c2
(30)
¯ In other words, √ the wings of C(t,y) have to appear at a scale larger than B(t) in the RM regime. IV. NUMERICAL SIMULATIONS AT HIGH TEMPERATURE: THE DISCRETE DP A. Model
We use numerical simulations of the DP model in order to test the scaling properties of free-energy fluctuations at finite temperature. Following the geometry described in Fig. 2 we perform numerical simulations of a discrete DP model [63] with the solid-on-solid (SOS) restriction |y(t + 1) − y(t)| = 1. A site-dependent zero-mean uncorrelated Gaussian disorder potential Vt,y of intensity D is used: Vt,y Vt ,y = Dδt,t δy,y .
(31)
The energy of a given configuration of the DP is given by the sum of the site energies along the path y(t). Given a disorder realization characterized by Vt,y , the weight Zt,y of a polymer starting in (0,0) and ending in (t,y) is given by the following recursion:
� Zt,y = e−βVt,y Zt−1,y−1 + Zt−1,y+1 (32) with zero-time initial condition Z0,y = δ0,y . Therefore, the probability to observe a polymer ending in (t,y) is � Zt,y / y Zt,y . Due to the recursion relation, Zt,y grows exponentially with time t. To avoid numerical instability, all weights Zt,y at fixed t are divided by the largest one, which does not change the polymer ending probability. In terms of the weight Zt,y the free energy of the polymer starting in (0,0) and ending in (t,y) is therefore defined as � � Zt,y Ft,y = −T ln � , (33) y Zt,y
and the free-energy fluctuations are measured in terms of the connected correlation 2 ¯ C(t,y − y ) = [Ft,y − Ft,y ]2 − [Ft,y − Ft,y ] .
(28)
toy 1 Taking in Eq. (27) f1 (k) ∼ k 2 as k → 0 ensures that C¯ ξ (t,y) goes to a constant plateau for |y| � t while f1 (k) ∼ 1 as k → ∞ ensures toy ˜ C¯ ξ (t,y) ∼ D|y| for ξ � |y| � t .
� �2 � 13 3 2D 4 = t 3 −� ξ 2. 4 2 πc
For the scale t not to destroy the 23 exponent of the RM regime, one must have t growing at least as
(24)
It has been shown [53] that the roughness B(t) can be computed in a Gaussian Variational Method (GVM) approximation, for toy a correlator C¯ ξ (t,y) of the Fourier form � dλ 2 toy toy ¯ Cξ (t,y) = [1 − cos(λy)]R�ξ (t,λ), (25) 2π λ2 � −λ with R�ξ (t,λ) = De
PHYSICAL REVIEW E 86, 031144 (2012)
(34)
As discussed in Sec. III A, this definition is equivalent in the continuum to that involving F¯ (t,y) in Eq. (16). The index ξ ¯ is dropped from C(t,y) since the disorder is uncorrelated as in Eq. (8), and since no length scale below the lattice spacing can be considered in this discrete DP model. The roughness is defined as the mean square displacement of the free end, as in
031144-5
ELISABETH AGORITSAS et al.
PHYSICAL REVIEW E 86, 031144 (2012)
¯ y) C(t,
2
¯ y) C(t,
¯ y) t− 3 C(t,
t = 8192
t = 512
y 2
t− 3 y
y
¯ FIG. 5. (Color online) Bare free-energy fluctuations C(t,y) for the discrete DP at finite temperature T = 4 and for two different ¯ times t. The late increase of C(t,y) for t = 512 is a finite-size effect related to the solid-on-solid restriction of the DP model.
Eq. (20) for the continuous DP B(t) = �y(t)2 � =
� y
Zt,y y2 � . y Zt,y
(35)
Finally, note the correspondence between the discrete and continuous parameters [see (E8) with lattice spacings a and b taken to 1]: the continuum model (6) which is the limit of the discrete model (32) in the large size limit has the parameters temperature T , elasticity c = T ,
disorder D,
(36)
thus providing a comparison of the temperature dependence of the two models through the correspondence c = T . A generic study of the continuum limit of the discrete DP is presented in Appendix E. B. Results
In what follows, results are presented for the discrete DP model with D = 1 and disorder averages are performed on 104 disorder realizations. Figure 5 displays typical curves for ¯ the free-energy fluctuations C(t,y) at a temperature T = 4. Two different timescales are presented, t = 512 and t = 8192, in order to show how the finite size of the system affects free-energy fluctuations. It is clear that one observes for both timescales the characteristic |y| behavior at small transverse length scales and then a crossover to saturation at larger timescales. In addition, when the polymer length is small an ¯ increase of C(t,y) is observed for large y, as can be observed for the t = 512 data. This last point is a finite-size effect related to the fact that, in contrast to the continuous case, for the discrete DP model used here the polymer endpoint is constrained at all times to remain in the cone |y(t)| � t; see Fig. 2. This finite-size effect only plays a role when analyzing small DP lengths, and in the following we discard this finite-size regime in order to better compare different curves. ¯ We now test the different scaling properties for C(t,y). ¯ With respect to time t and in the large time limit [45], C(t,y) is expected to scale according to � � y ζ ˆ ¯ C(t,y) ∼ t C ζ , (37) t
¯ FIG. 6. (Color online) Rescaled free-energy fluctuations C(t,y) for the discrete DP at finite low temperature T = 0.5 and various times, according to the scaling (37) with ζ = ζRM = 23 . The inset ¯ shows the bare data C(t,y) against y for timescales t = 4096, 8192, 16 384, 32 768 from bottom to top.
with ζ = ζRM = 23 at large t, which corresponds to the scaling relation in Eq. (12). This behavior has been reported in Ref. [69] for a finite low-temperature value T ≈ 0.14 (β = 7) and moderated polymer sizes t = 512,1024. In Fig. 6 we test the scaling given in Eq. (37) for temperature T = 0.5, which is larger than the one used in Ref. [69] but still in a low-temperature regime (see below). As shown in the figure the scaling works satisfactorily for the large timescales used. This result confirms the scaling probed in Ref. [69] and subsequently analytically obtained in Ref. [45]. In order to go beyond the large time scaling of Eq. (37), we now discuss the temperature dependence of free-energy fluctuations with respect to the roughness. It is first important to properly consider the finite temperature scaling of the roughness, which has been discussed in Refs. [52,53,75]. In the high-temperature regime and within the continuum limit of the DP, the roughness scales asymptotically as �T t 2ζth (t LT ) T5 B(t) ∼ ccT �2þ 2ζ , (38) with LT = cD 2 t RM (t � LT ) D
where ζth = 12 is the thermal roughness exponent and ζRM = 23 . The temperature dependence of the roughness is described at large scale by the thorn exponent þ = − 13 . The thermal length scale LT separates short-scale thermal fluctuations characterized by ζth from large-scale disorder-induced fluctuations of exponent ζRM . It has been shown [75] that in the high-temperature regime the thermal length scale grows as LT ∼ T 1/θF /(cD 2 ), where θF = 15 is the Flory exponent [52,53]. In the discrete version of the DP one has c = T [see (36) and Appendix E] and therefore the scaling of the roughness (38) now reads � 2ζ t th (t LT ) T4 B(t) ∼ T 2 �2þ 2ζ with LT = 2 . (39) D t RM (t � LT ) D In this last case, remarkably, the short-time behavior is temperature-independent, while the large time prefactor scales with temperature as T 4þ = T −4/3 .
031144-6
PHYSICAL REVIEW E 86, 031144 (2012)
¯ y) C(t,
¯ y) C(t,
1
¯ y) [B(t)]− 2 C(t,
1 ¯ y) [B(t)]− 2 C(t,
FINITE-TEMPERATURE AND FINITE-TIME SCALING OF . . .
y
y
1
[B(t)]− 2 y
1
[B(t)]− 2 y
¯ FIG. 8. (Color online) Rescaled free-energy fluctuations C(t,y) for the discrete DP at large times and low temperatures, according to ¯ the scaling (40). The inset shows the bare data C(t,y) against y for timescales t = 4096, 8192, 16 384, 32 768 from bottom to top. Thin (thick) lines correspond to T = 0.5 (T = 1).
These scaling properties of the roughness can be directly incorporated into the scaling properties of free-energy correlations using the whole roughness to define the characteristic transverse scale as in the scaling relation (22), which, in the absence of ξ , may be written
� = D(D,T � ¯ is independent of where D ) and the function Cˆ 1 (y) � in Eq. (41) is the parameters D and T . Indeed, the prefactor D √ ¯ the slope of the correlator C(t,y) in the regime |y| � B(t) ¯ where C(t,y) ∝ |y|. It is known from the large-time limit at � = cD ; see (17) [and also (C25) in the diffusive zero ξ that D T � is thus expected to regime]. In the discrete DP case (c = T ), D be temperature independent in the high-temperature regime, � = D, and to behave as T 2/3 in the low-temperature regime D [58]. In order to test this, we rescale the data in Fig. 9 onto a single universal master curve as shown in Fig. 10. To � = D = 1 for T = 4,8 and ensure the this purpose, we fix D ¯ collapse of low-temperature correlators C(t,y) by proposing � values for the parameter D/D for T = 0.5,1,2, which are � is plotted in the inset of Fig. 10. Although the value of D 2/3 decreasing with T we did not observe the T behavior, possibly because we are not reaching the corresponding low-temperature asymptotic regime for the discrete DP model. However, it is remarkable to observe the crossover towards the
� � y . B(t) Cˆ √ B(t)
(40)
First note that the inset of Fig. 9 shows how the saturation regime of free-energy fluctuations is reached at smaller transverse length scale y when increasing the temperature. If, as suggested by the scaling relation (40), the crossover is dictated by the time-dependent roughness B(t), this is in agreement with the negative value of the thorn exponent ruling the temperature dependence of the roughness [52,53,75]. The main panel of Fig. 7 illustrates the validity of the scaling relation (40) that incorporates the temperature dependence through the roughness function, in the range of high-temperature roughness. Since the temperature dependence is included in the roughness B(t), this scaling relation can also be probed at lower temperatures. This is done in Fig. 8, were data corresponding to two low temperatures T = 0.5,1 and different timescales are collapsed on a single curve. However, the high- and lowtemperature regimes are not necessarily described by the same ˆ y). ¯ Figure 9 actually shows, for a single rescaling function C( value t = 16 384, that although high- and low-temperature data collapse on a single curve proper to each regime, there is a crossover between these two limiting cases. As suggested by the scaling relation (23), the slope of the linear initial growth of the free-energy correlator should fully account for the temperature dependence. As extensively discussed in Ref. [58], it can in fact be argued that the (D,T ) dependence of the scaling law (22) can be absorbed in a single � which in the case of the discrete DP model reads prefactor D, � � � y 1 ¯ ˆ � C(t,y) = D B(t) C √ , B(t)
(41)
¯ y) C(t,
�
1
¯ C(t,y) =
¯ y) [B(t)]− 2 C(t,
¯ FIG. 7. (Color online) Rescaled free-energy fluctuations C(t,y) for the discrete DP at large times and high temperatures, according ¯ to the scaling (40). The inset shows the bare data C(t,y) against y for timescales t = 4096, 8192, 16 384, 32 768 from bottom to top. Thin (thick) lines correspond to T = 4 (T = 8).
y 1
[B(t)]− 2 y
¯ FIG. 9. (Color online) Rescaled free-energy fluctuations C(t,y) for the discrete DP at a fixed large time t = 16 384 and from low to high temperatures, according to the scaling (40). The inset shows the ¯ bare data C(t,y) against y. Temperatures are T = 0.5,1,2,4,8 from top to bottom.
031144-7
PHYSICAL REVIEW E 86, 031144 (2012)
adjusting the parameters A and B using least-square fittings, and we find indeed a very good collapse of our numerical data and the exact expression of gPS (y) obtained in Ref. [45]. Note that the numerical evaluation of gPS (y) was done in Refs. [76,77], where precise numerical techniques were developed to compute Fredholm determinants with high precision. In the following section we extend this analysis to lower temperatures and short-range correlations by studying a continuous version of the DP model.
D(T )/D
1
¯ y) [D(T )/D]−1 [B(t)]− 2 C(t,
ELISABETH AGORITSAS et al.
V. NUMERICAL SIMULATIONS AT LOWER TEMPERATURE: THE CONTINUOUS DP
T 1
[B(t)]− 2 y
A. Numerical approach
FIG. 10. (Color online) Full temperature-independent rescaled ¯ free-energy fluctuations C(t,y) for the discrete DP at a fixed large time, according to the scaling (41). Same data as in Fig. 9. The inset � of (41) as a function of T . shows the parameter D
low-temperature regime, which reflects the influence of the lattice spacing even though no length scale is defined below it. In summary, we have shown in this section that numerical simulations of the discrete version of the DP model with the SOS constraint are √ fully compatible with the scaling arguments suggesting that B(t) is the relevant transverse scale for the free-energy fluctuations. Moreover, we have also shown that all the temperature dependence can only be accounted √ for by using, in addition to the proper transverse length scale B(t) the scale of linear free-energy fluctuations at small y, given � This universal behavior being established, by the function D. one would naturally expect from the result of Refs. [45,46] in Eq. (12), that the correlator Cˆ 1 (y) in Eq. (41) can be expressed in terms of the mean square displacement of the Airy2 process, A2 (y), namely, Cˆ 1 (y) = A gPS (y/B) ,
gPS (y) = �[A2 (y) − A2 (0)]2 �, (42)
where A and B are longitudinal and transverse parameterdependent length scales. In Fig. 11 we test this relation (42) by
Cˆ 1(y), AgPS(y/B)
6 5 4
To probe the implications for the scaling laws of short-range correlations (ξ > 0) of the disordered potential V (t,y), we have simulated a continuous version of the directed polymer. Directly integrating the partial differential equation (PDE) (6) for ZV (t,y) is difficult since, especially at low temperature, the weight concentrates exponentially in the most favorable regions for the polymer, preventing the whole space to be embraced. Taking the logarithm and considering the PDE (7) for FV (t,y) is also problematic because of the singular initial condition ZV (0,y) = δ(y). We took advantage of the STS (15) by directly simulating the PDE for the reduced free energy F¯V (t,y): 1 2¯ 1 ∂t F¯V (t,y) = ∂ FV (t,y) − [∂y F¯V (t,y)]2 2βc y 2c y − ∂y F¯V (t,y) + V (t,y) t
whose initial condition is simply F¯V (0,y) = 0. Another benefit of considering F¯V (t,y) instead of FV (t,y) is the removal of 2 the quadratic contribution c y2t which eclipses the disorder contribution in Eq. (6) at short time. The correlated disordered potential V (t,y) is constructed as follows: Independent random variables Vi,j are drawn from a centered Gaussian distribution of variance D grid on a grid of coordinates (t,y) = (iξt ,j ξy ). The continuum V (t,y) is defined as the two-dimensional cubic spline of the {Vi,j } on the grid. Its distribution is Gaussian and characterized by its two-point correlator, which can be analytically computed [58] and takes the form
3
V (t,y)V (t ,y ) = DRξt (t − t)Rξy (y − y),
2 1 0 10
5
0
5
10
y FIG. 11. (Color online) Comparison between Cˆ 1 (y) defined in Eq. (41), extracted from the numerical data shown in Fig. 10 and A gPS (y/B) (dashed line), where gPS (y) is defined in Eq. (42) while A and B are two fitting parameters (determined to A � 4.08 ± 0.05 and B � 2.07 ± 0.06). The numerical evaluation of the exact expression for gPS (y) was done in Refs. [76,77].
(43)
(44)
where Rξ is a normalized smooth delta function of width ξ . The amplitude of disorder is D = D grid ξt ξy and our correlation length of interest in the transverse direction is ξ = ξy . In numerical simulations, we took ξt = 1, ξy = 2, D grid = 4 (and thus ξ = 2 and D = 8). Simulations are run on a finite window [−ym ,ym ] in the transverse direction, outside of which the disorder potential is set to 0. Besides, since the equation (43) is ill-defined at t = 0, simulations were run starting at small initial time t0 with thermal initial conditions. A complete presentation of the numerical procedure can be found in Ref. [58].
031144-8
(a )
PHYSICAL REVIEW E 86, 031144 (2012)
¯ resc (t, y¯) C
¯ resc (t, y¯) C
FINITE-TEMPERATURE AND FINITE-TIME SCALING OF . . .
(b) ¯ y) C(t,
B(t) t
(a ) 500.0 100.0 50.0 10.0 5.0 1.0 0.5 0.1
y
(b)
¯ y) C(t,
B(t)
0.1
t 0.5 1.0
5.0 10.0
y
100.0
y¯
y¯
B. Results
For numerical simplicity, the scaling (22) was tested graphically √ at fixed ξ , defining a rescaled transverse coordinate y¯ = y/ B(t) and a rescaled correlator � 1 ¯ ¯ =√ Cξ (t,y¯ B(t)). C¯ resc (t,y) (45) B(t) Indeed, √ testing the full scaling (22) where ξ is also rescaled by B(t) would imply measuring C¯ ξ (t,y) for many different values of ξ , which was not numerically accessible √ [see below for an analytical explanation on the rescaling ξ/ B(t) of (22)]. Note that in the discrete DP it was sufficient to study the scaling function of (40) without taking ξ into account (no length below the lattice spacing, which plays the role of ξ , can be considered). Low-temperature results are shown in Fig. 12: The curves of C¯ ξ (t,y) at different times superimpose upon the rescaling (45), with a slight discrepancy around the origin due to the fixed disorder correlation length ξ . At higher temperature (Fig. 13) this scaling remains valid, the effect of the finite ξ being as expected less important. In the evaluation of ¯ from (45), the roughness B(t) is determined from the C¯ resc (t,y) numerical results for F¯ (t,y) using (5) to evaluate the thermal average �y(t)2 �V at fixed disorder, averaging afterwards over the realizations of disorder. For completeness, the graphs of the roughness are given in the inset (a) of Figs. 12 and 13. Similarly to the case of the discrete polymer (41), it can be argued that the (c,D,T ) dependence of the scaling law (22) � [58]: can be absorbed into a single prefactor D � � � y � B(t) Cˆ 1 ξ , (46) C¯ ξ (t,y) = D √ √ B(t) B(t) ¯ does not depend on (c,D,T ). By where the function Cˆ ξ1¯ (y) � we show on Fig. 14 from the tuning appropriately D,
FIG. 13. (Color online) Same graph as Fig. 12 but at higher temperature T = 1.5 (disorder average is over 446 realizations).
numerical evaluation of the correlator that this is indeed the � ) at fixed c and ξ is evaluated by case. The function D(T ¯ at T = Tref (Tref = 2 in fixing a reference curve C¯ resc (t,y) � ) which minimizes the Fig. 14) and finding the best D(T ¯ and the reference curve using distance between C¯ resc (t,y) the least-square method. We checked that the result does not depend on the choice of Tref or on the choice of the fixed t, within numerical uncertainty. This method allows a � ) up to a T -independent constant which determination of D(T � ref ) = 1. We refer the reader to Ref. [58] for imposes D(T � regarding an in-depth analytical and numerical study of D, its scaling and physical interpretation. As displayed in the � is compatible with inset (b) of Fig. 14, the measured D � = cD and a saturation at the predicted high T behavior D T low T . We can actually provide a short argument √ explaining the rescaling of the correlation length ξ by B(t) appearing in Eq. (46), which we could not probe numerically. As the
¯ resc (t, y¯) D−1 C
FIG. 12. (Color online) Graph for the continuous DP of the ¯ defined in Eq. (45) as a function of rescaled√correlator C¯ resc (t,y) y¯ = y/ B(t) for different times t, at low temperature. Parameters are c = 1, D = 8, T = 0.4, and ξ = 2. Disorder average is performed over 1092 realizations. (a) Roughness B(t) in log-log scale with the thermal [red line (bottom)] and random manifold [green line ¯ (top)] asymptotic regimes. (b) Corresponding bare correlator C(t,y). Time varies from 35 to 135 by steps of 25 from bottom to top curves.
(a )
(b)
¯ y) C(t,
D(T )
y
T
y¯ FIG. 14. (Color online) Plot of the rescaled correlator �−1 C¯ resc (t,y) ¯ as a function of y¯ at fixed large time t and for different D temperatures T ∈ {.4,.55,1.2,1.5,1.8}. (a) Corresponding original ¯ correlator C(t,y). Lighter color corresponds to lower temperature. � as a function of T (up to a numerical factor) in log-log scale. (b) D Points are determined by least-square minimization (see text) with � T =2 = 1. The respect to a reference curve at T = 2 which fixes D| line gives the expected slope of the large temperature asymptotics �∝ 1. D T
031144-9
ELISABETH AGORITSAS et al.
PHYSICAL REVIEW E 86, 031144 (2012)
¯ rounding of C(t,y) is quadratic in y for small y [see also ¯ scales as (C21)], we expect that Cˆ ξ1 (y) 2
� 1/2 . � y¯ ¯ (ξ¯ /D) ¯ �D Cˆ ξ1¯ (y) for |y| (47) ξ¯ √ The rescaling ξ¯ = ξ/ B(t) in Eq. (46) ensures thus that, in the large time limit of (46), C¯ ξ (t,y) remains independent of t at small y: � D (48) √ y2. 2ξ π √ Without the precise rescaling ξ/ B(t) in Eq. (46) this expression would become singular. Note that because of the rounding at small y the fitting procedure of Cˆ 1 (t,y) with respect to gPS , as done for the discrete DP in Fig. 11, cannot be performed since the Airy2 process is not adapted to a finite disorder correlation length ξ .
¯ i.e., to determine how many details of of the process χξ¯ (y), the correlator Rξ (y) of the microscopic disorder (13) are left ¯ in χξ¯ (y). A point of particular interest is the scaling of fluctuations with respect to temperature. Regarding the roughness B(t) it has been shown [23,52,75] that, above a char1 acteristic temperature Tc = (ξ cD) 3 , B(t) can be rescaled as
y≈0 C¯ ξ (t,y) −−−→
In the one-dimensional KPZ universality class, a suitably centered observable F¯ (t,y) presents, in the large time 1 limit, 2universal fluctuations of order t 3 at a transverse scale y ∼ t 3 , described by the scaling relation (1). We have probed numerically a refinement of this scaling law at short times, for the case of a random environment presenting correlations at a typical finite length scale ξ and at finite temperature, by testing the scaling relation (46) for the two-point free-energy correlation function C¯ ξ (t,y) defined in Eq. (16). If this scaling extends to the higher order correlation functions, it will be equivalent to stating that F¯ (t,y) scales in distribution as � � � B(t)] 21 χ √ ξ (y/ B(t)). F¯ (t,y) ∼ [D (49) B(t)
Compared to the large time asymptotics (1), this relation expresses the fact that the transverse fluctuations �y 2√ (t)� = B(t) correspond to free-energy fluctuations of order B(t), described by the roughness B(t) not only in the RM regime where 4 B(t) ∝ t 3 but also at smaller times. The properly rescaled ¯ would thus be independent of the parameters c, function χξ¯ (y) � capturing all the parameters deD, T , and ξ , the constant D pendence. We have in particular recovered numerically that the � = cD describes correctly the high-temperature value [56] D T regime where the disorder correlation length ξ plays no role and correlations take the form (10). Moreover, the distribution ¯ is known at ξ¯ = 0 (χ0 (y) = χ (y) being of the variable χξ¯ (y) then the Airy2 process [45]) and an interesting open question is thus to characterize the analogous process at nonzero ξ¯ . One can conjecture that a suitable characterization is provided by an appropriate Macdonald process (or a generalization of it), already known [65,78] to yield the process χ (y) at ξ¯ = 0 in some specific limit, especially in view of recent results [79] allowing to represent Macdonald processes in terms of Brownian motions interacting within a finite range. This could in particular help to characterize the universality
(50)
T3 , cD
(51)
with
t→∞
VI. DISCUSSION AND CONCLUSION
ˆ B(t; c,D,T ) = ξth2 B(t/t ∗ ), ξth =
t∗ =
T5 , cD 2
while below Tc such a rescaling does not hold. Nevertheless, ¯ our results on the free-energy correlator C(t,y) indicate that the extended scaling law (46) holds below and above Tc at large enough times, the dependence in the parameters ˜ If the (c,D,T ,ξ ) being then gathered in a single prefactor D. roughness exponent ζRM is not expected to change below Tc , ˆ 2ζRM however, the prefactor Aˆ of the roughness in B(t) ∼ At can be modified by ξ . This question is relevant in particular to determine the precise dependence of the crossover timescales of one-dimensional interfaces described by the DP coordinate y(t) [23,53]. We refer the reader to Ref. [58] for numerical and analytical results in that direction. On the other hand, recent experiments on liquid crystals [42–44] (see also Ref. [9] for a burning front experiment) have demonstrated that the height fluctuations of a growth interface are correctly described by the (centered) free energy F¯ (t,y) itself. In particular it was found that different Airy processes of the KPZ universality class successfully account for the observed height distribution (Airy1 or Airy2 depending on the geometry of the initial condition). The authors of those ¯ studies were in particular able to measure the correlator C(t,y) with high precision. Given the existence of finite disorder correlation length ξ in experiments, it would be interesting to study the equivalent of the low- and high-temperature regimes when tuning the system parameters which plays the role of T in our description. In the notation of Ref. [44], the relation � in Eq. (49) between the amplitude of χ (y) [linked to our D �2 /c] and λ and ν in the KPZ equation (linked to by = D our parameters by c = λ1 and T = λν ) would change from low ν to high ν. Precisely, defining the characteristic value 1 νc = (ξ λ2 D) 3 , we predict a crossover from the (observable) dependence ∼ D 2 λν −2 at high ν (ν � νc ) to a saturated regime ∼ D 2 λνc−2 at low ν (ν νc ). The influence of ξ could thus be probed by measuring the power-law dependence of in the parameter λ displaying a nontrivial dependence 1 ∼ λ− 3 for ν νc .
ACKNOWLEDGMENTS
We would like to thank Christophe Berthod for his help on the Mafalda cluster at the University of Geneva, where part of the simulations were run, and Folkmar Bornemann for sharing with us his data for the two-point correlation of the Airy2 process. E.A. and T.G. acknowledge support by the Swiss National Science Foundation under MaNEP and Division II. V.L. was financially supported by ANR SHEPI.
031144-10
FINITE-TEMPERATURE AND FINITE-TIME SCALING OF . . .
G.S. acknowledges support by ANR grant 2011-BS04-013-01 WALKMAT. S.B. and G.S. acknowledge partial support by the France-Argentina MINCYT-ECOS A08E03. S.B. is partially supported by CONICET grant PIP11220090100051.
PHYSICAL REVIEW E 86, 031144 (2012)
Note that the second derivative of C¯ ξ (t,y) with respect to y is directly related to the correlator of the “phase” ¯ ¯ ¯ η Vy (t,y) ≡ ∂y FV (t,y). Indeed, using FV (t,y) − FV (t,0) = dy η (t,y ) one has 1 V 1 0 ∂y2 C¯ ξ (t,y) = ∂y2 [F¯ (t,y) − F¯ (t,0)]2 � y � y 2 dy1 dy2 ηV (t,y1 )ηV (t,y2 ) = ∂y 0 0 � y � y ¯ = ∂y2 dy1 dy2 R(t,y 2 − y1 )
APPENDIX A: DIFFERENT FORMULATIONS OF THE FREE-ENERGY CORRELATOR
We determine in this Appendix some properties of the freeenergy correlator C¯ ξ (t,y) defined in Eq. (16). Defined by the decomposition (15) of the free energy, the reduced free energy F¯ (t,y) is statistically invariant by translation along y, which implies that all its moments are invariant by translation along y at fixed time: F¯V (t,y1 + Y ) . . . F¯V (t,yn + Y ) = F¯V (t,y1 ) . . . F¯V (t,yn ). (A1)
0
∂y2 C¯ ξ (t,y)
=c
y2 + const(t), 2t
(A2)
(A3)
thus T 2π T t y2 F¯V (t,y) = FV (t,y) − c − log 2t 2 c
(A4)
= FV (t,y) − FV (t,y) + const(t),
(A5)
and hence from the definition (16), and dropping the index V for simplicity C¯ ξ (t,y − y) = {[F (t,y ) − F (t,y )] − [F (t,y) − F (t,y)]}2 (A6) = [F (t,y ) − F (t,y)]2 − [F (t,y ) − F (t,y)]2 , (A7) as announced. The fact that this expression depends only on y − y is not obvious and arises from the STS through (15). See Ref. [58] for a study of the time dependence of the quantity F¯V (t,y), which is independent of y.
� ∂t
(A9) (A10)
0
¯ ¯ −y), = R(t,y) + R(t, ¯ = 2R(t,y),
(A11) (A12)
where the correlator of ηV is denoted by ¯ R(t,y 2 − y1 ) = ηV (t,y1 )ηV (t,y2 ).
In particular, F¯ (t,y) is independent of y, so that C¯ ξ (t,y) is also the connected correlator of FV (t,y). Indeed, starting from (15) y2 T 2π T t FV (t,y) = c + log + F¯V (t,y) 2t 2 c
(A8)
(A13)
APPENDIX B: LARGE y BEHAVIOR OF THE CORRELATOR C¯ ξ (t, y)
In this Appendix, we show that, as discussed in Sec. III A, ¯ the correlator C(t,y) presents “wings” at all finite times, i.e., ¯ at large |y| for t < ∞. goes to a finite constant lim|y|→∞ C(t,y) To this aim, let us first show that the integral ¯ N (t) = dy R(t,y) of the two-point correlator of ηV (t,y), defined in Eq. (A13), is a conserved quantity. From (7), the evolution equation for the reduced free energy F¯V (t,y) of the directed polymer, defined in Eq. (15), is given by (43) 1 2¯ 1 ∂y FV (t,y) − [∂y F¯V (t,y)]2 2βc 2c y ¯ − ∂y FV (t,y) + V (t,y) (B1) t so that the evolution equation of ηV (t,y) = ∂y F¯V (t,y) also includes an explicit time dependence: ∂t F¯V (t,y) =
1 2 1 ∂ ηV (t,y) − ηV (t,y)∂y ηV (t,y) 2βc y c 1 y − ηV (t,y) − ∂y ηV (t,y) + ∂y V (t,y). (B2) t t ¯ Taking advantage of the One can now compute ∂t dy R(t,y). invariance of the disorder distribution through the symmetry by reflection y → −y, and of the statistical invariance of ηV (t,y) by translation along y, one has, dropping the index V for simplicity, ∂t ηV (t,y) =
� ¯ dy R(t,y) = ∂t � =
(B3)
dy η(t,y)η(t,0) � � � 1 1 1 2 dy η(t,y) ∂y η(t,0) − η(t,0)∂y η(t,0) − η(t,0) + ∂y V (t,0) 2βc c t �
1 2 1 1 y + η(t,0) ∂ η(t,y) − η(t,y)∂y η(t,y) − η(t,y) − ∂y η(t,y) +∂y V (t,y) 2βc y c t
� t � = − 1t ∂y [yη(t,y)]
031144-11
�� (B4)
ELISABETH AGORITSAS et al.
PHYSICAL REVIEW E 86, 031144 (2012)
� 1 1 y=+∞ = − η(t,0)[∂y η(t,y) − ∂y η(t,0)]y=−∞ dy η(t,y)η(t,0) + t βc 1 1 y=+∞ y=+∞ − η(t,0)[η(t,y)2 ]y=−∞ − η(t,0)[yη(t,y)]y=−∞ c t � � 1 ¯ ¯ ⇐⇒ ∂t dy R(t,y) =− dy R(t,y). t
This shows that N (t) verifies the equation ∂t N (t) = − 1t N (t) whose solution reads N (t) = Ct1 . The constant C1 is equal to 0 due to the initial condition N (0) = 0 [the initial condition for F¯ is F¯V (0,y) = 0, see Sec. III A, and thus ηV (0,y) = 0]. This yields that N (t) is constant in time and equal to 0: � ¯ N (t) = dy R(t,y) = 0. (B7) This equality at all finite times t is equivalent to the existence of wings in the correlator C¯ ξ (t,y) at finite times. Indeed, since y
¯ 2 0 dy R(t,y ) = ∂y C¯ ξ (t,y) [see (A12)], this equality also writes lim ∂y C¯ ξ (t,y) = 0 ,
y→∞
APPENDIX C: SHORT-TIME DYNAMICS (DIFFUSIVE SCALING)
In this Appendix we study in the short-time regime and at finite ξ the scaling behavior of the two-point correlators C¯ ξ (t,y) and R¯ ξ (t,y) of F¯V (t,y) and ηV (t,y) = ∂y F¯V (t,y), defined respectively in Eqs. (16) and (A13). The polymer is pinned in y = 0 at time t = 0 so that the initial condition translates for the reduced free energy into F¯V (0,y) = 0. Let us thus assume that F¯V (0,y) remains small at short times so that in this regime the nonlinear term of (B1) remains small and negligible compared to the linear terms: T 2¯ y ∂ FV (t,y) − ∂y F¯V (t,y) + V (t,y). (C1) 2c y t This equation is linear and can thus be solved directly. Before doing so, note that for an uncorrelated disorder (ξ = 0), the corresponding steady-state distribution of F¯ is the same [56] as in the nonlinearized one (9) [remark from (15) that F and F¯ share the same distribution at infinite time]. In particular, denoting C¯ ξlin (t,y) [resp. R¯ ξlin (t,y)] the same correlator as (16) [resp. (A13)] but for F¯V solution of the linearized equation (C1), one also has cD |y|, (C2) C¯ ξlin (t,y)|ξ =0 −−−→ t→∞ T cD R¯ ξlin (t,y)|ξ =0 −−−→ δ(y), (C3) t→∞ T where R¯ ξlin (t,y) = 12 ∂y2 C¯ ξlin (t,y) as in Eq. (A12). Although the solution of the linearized evolution equation (C1) is valid only
(B6)
at short time compared to the complete evolution (B1), it is thus instructive to study its behavior at all times. In what follows, we determine the finite t and finite ξ equivalents of the correlators (C2) and (C3). To get rid of the term yt ∂y F¯V in Eq. (C1) we set F¯V (t,y) =
√
teβ
cy 2 2t
FˆV (t,y).
(C4)
The evolution of FˆV is then 1 2ˆ 1 −βcy 2 ∂y FV (t,y) + √ e 2t V (t,y) . ∂t FˆV (t,y) = 2βc t
� � ≡ Vˆ (t,y)
(B8)
and this corresponds to the plateau at large |y| of Fig. 3. This result is already known to hold at large finite time and for a delta-correlated disorder (ξ = 0) [45]. In this Appendix we thus have generalized this result at all times, and to a disorder correlator with short-range correlations.
(B5)
Besides, in absence of disorder (Vˆ = 0), � βc − βcy 2 G(t,y) = e 2t θ (t) 2π t
(C5)
(C6)
is a Green function of the equation for FˆV , that is, � � 1 2 ∂t − ∂y G(t − t ,y − y ) = δ(t − t )δ(y − y ). 2βc
(C7)
We denote by θ (t) the Heaviside step function. The solution of (C5) is hence � +∞ �
ˆ F (t,y) = dt dy G(t − t ,y − y )Vˆ (t ,y ). (C8) 0
Here and in what follows, integrals along direction y run by convention on the real line. Let us first determine the effect of ξ by computing the value of the peak of the correlator R¯ ξlin (t,0) = 12 ∂y2 [F¯ (t,y) − F¯ (t,y)]2 |y=0
∂t F¯V (t,y) �
= ∂y F¯ (t,0) ∂y F¯ (t,0),
(C9)
which is a matter of Gaussian integration. One has ∂y F¯ (t,0) = √ t∂y Fˆ (t,0) and � +∞ � ∂y Fˆ (t,0) = dt1 dy1 ∂y G(t − t1 , −y1 )Vˆ (t1 ,y1 ) 0
1 = √ 2π
�
�
�
t
dt1
dy1
0
βc t − t1
(C10)
� 32 y1 e
βcy 2 − 2(t−t1 ) 1
−βcy12
e 2t1 × √ V (t1 ,y1 ), t1
(C11)
so that putting everything together, and considering for the disorder V the Gaussian correlator RξGauss (y) defined in
031144-12
FINITE-TEMPERATURE AND FINITE-TIME SCALING OF . . .
PHYSICAL REVIEW E 86, 031144 (2012)
Eq. (14), one gets R¯ ξlin (t,0) = t ∂y Fˆ (t,0)∂y Fˆ (t,0)
(βc) =t 2π
3
(C12)
�
�
y2
t
y1 y2 e
y2
1 2 − βc 2 ( t−t + t−t ) 1
2
e
y2
y2
1
2
1 2 − βc 2 (t +t )
√D 2 πξ
e
(y −y )2 − 2 21 4ξ
δ(t1 −t2 )
� �
V (y1 ,t1 )V (y2 ,t2 )
√ 3 3 t1 t2 (t − t1 ) 2 (t − t2 ) 2 � � � � � t � 3 � (y2 − y1 )2 1 (βc) y1 y2 βc 1 2 2 y1 + y2 − . =t dt1 exp − + D dy1 dy2 3 (t − t1 )3 t1 2 t − t1 t1 4ξ 2 4π 2 ξ 0 dy1 dy2
dt1 dt2
The quadratic form in the last exponential writes − 12 y� T A y� with y� = (y1 ,y2 ) and A the matrix � 1 � � 1 βc t1 + t−t + 2ξ1 2 − 2ξ1 2 1 �
A= . 1 + 2ξ1 2 − 2ξ1 2 βc t11 + t−t 1 The result of the Gaussian integral with respect to y� is � 2π π ξ t13 (t − t1 )3 −1 (A )12 det , = A {βct[βcξ 2 t + t1 (t − t1 )]}3/2 and finally (C14) becomes
�
dt1
We see on one hand that the infinite time limit reads lim R¯ ξlin (t,0) =
cD √ , 2T ξ π
Dt √ + O(t 3/2 ). 12ξ 2 π
(C19)
(C20)
As for the correlator C¯ ξlin (t,y) of the reduced free energy, this yields from (A12) the small y expansions at large and short times: � cD Tξ lin 2 ¯ , (C21) Cξ (t,y) −−−→ √ y for y t→∞ 2T ξ π cD � (t→0) ξ2 Dt C¯ ξlin (t,y) ≈ . (C22) √ y 2 for y 2 Dt 12ξ π The full (t,y) scaling of the correlator C¯ ξlin (t,y) can be determined using the same approach as exposed above, starting from the solution (C8) for FˆV (t,y). One finds � C¯ ξlin (t,y) = D
0
t
(C15)
(C16)
(C17)
(C18)
To reveal the scaling of this expression, one performs the change of variable t1 = tτ in the integral � � 1 1 − exp � −βcy 2 τ 2 /t � t cD 4[ξ 2 βc/t+τ (1−τ )] C¯ ξlin (t,y) = dτ √ � T βc 0 π τ (1 − τ ) + ξ 2 βc/t � � t ¯ √ Cξ βc/t (1,y βc/t), (C24) = βc
which diverges indeed as ξ → 0. The effect of ξ is to regularize the ξ = 0 result (C3) around y = 0. The factor 2√1 π directly arises from the Gaussian correlator (14) as it will become clear below. On the other hand, the short-time behavior writes R¯ lin (t,0) =
(C14)
t
π ξ t12 {βct[βcξ 2 t + t1 (t − t1 )]}3/2 0
� � √ t(t + 2βcξ 2 ) − ξ βct(t + 4βcξ 2 ) arccot 2ξ βct = βcD . √ 2 π tξ (t + 4βcξ 2 ) 3
(βc) R¯ ξlin (t,0) = t D 3 4π 2 ξ
t→∞
(C13)
0
� � βct12 y 2 1 − exp − 4t [βcξ 2 t+t (t−t ) 1 1 ] dt1 . (C23) √ � t1 (t−t1 ) 2 π + ξ βct
which takes the scaling form, with the thermal roughness Bth (t) = βct = Tct � � y cD � , C¯ ξlin (t,y) = Bth (t) Cˆ √ ξ √ Bth (t) T Bth (t)
(C25)
where the scaling function is ¯ = C¯ ξ¯ (t = 1,y)| ¯ c=β=D=1 Cˆ ξ¯ (y) � y¯ 2 � 1 1 − exp �− 4[ξ¯ 2 +τ (1−τ )] = dτ √ � . 0 π τ (1 − τ ) + ξ¯ 2
(C26) (C27)
The relation (C25) describes a scaling form of the freeenergy correlation, with the roughness Bth (t) of the thermal regime. We discuss in Secs. IV B and V B an extension of its validity to the large time regime of the DP, with the full roughness B(t) instead of Bth (t).
031144-13
ELISABETH AGORITSAS et al.
PHYSICAL REVIEW E 86, 031144 (2012)
To find the best quadratic approximation of F˜ (t,y), the extremalization conditions read for the pairs {a,b}:
APPENDIX D: SOLUTION OF THE WINGED DP TOY MODEL IN THE GAUSSIAN VARIATIONAL METHOD APPROXIMATION
As introduced in Refs. [71,80], what we call generically a DP “toy model” is essentially based on the assumption that the reduced free energy F¯V (t,y) of the polymer endpoint (the “effective potential” it sees) has a Gaussian distribution, i.e., that it is fully determined by its mean value and its two-point correlator C¯ toy (t,y). Following the scheme used in Ref. [53], we compute in this appendix the Gaussian-Variational-Method (GVM) approximation of a DP toy model with saturation “wings” appearing at |y| � t at time t. We check√specifically that by consistency they should appear at t ∼ B(t) at asymptotically large length scales, as asserted in Sec. III C. 1. Replicas
The replica approach allows to determine the statistical average of an observable O(t,y) of the DP toy model as defined in Sec. III C from the formal expression � �n toy �O(t,y)� = lim dy1 . . . dyn O(y1 )e−β a=1 F (t,ya ) (D1) n→0 Rn � = lim dy1 . . . dyn O(y1 ) exp{−β F˜ (t,y)}, (D2) n→0 Rn
where the replicated free energy F˜ (t,y) of n copies y = (y1 , . . . ,yn ) of the polymer endpoint reads n n c � 2 β � ¯ toy C (t,yb − ya ) . ya + F˜ (t,y) = 2t a=1 4 a,b=1 � �
� � F˜el (t,y)
(D3)
F˜dis (t,y)
To obtain this expression, we have used the assumed Gaussianity of the F¯ toy distribution, similarly to the Gaussian distribution of the random potential.
∂Fvar [G(t) ↔ G−1 (t)] = 0, ∂Gab (t)
where the variational physical free energy Fvar i.e., after averaging over thermal fluctuations) is defined at each time t as Fvar = F0 + �F˜ − F˜0 �0 = F0 + �F˜el − F˜0 �0 + �F˜dis �0 , (D8) and the trial physical free energy is T log det G + const. (D9) 2 In those expression �·�0 denotes the average with respect to ˜ the normalized Boltzmann weight e−β F0 /Z0 and Z0 is the corresponding partition function. Let us first compute � � � n n c 1 � −1 2 ˜ ˜ �Fel − F0 �0 = y − ya Gab (t)yb (D10) 2t a=1 a 2 a,b=1 0 � � 1� c δab − G−1 (t) �ya yb �0 (D11) = ab 2 ab t � � 1� c δab − G−1 = (t) T Gab (t) (D12) ab 2 ab t F0 = −T log Z0 = −
=
� � � dλ 1 − e− 12 λ2 �(yb −ya )2 �0 toy βD = R�ξ (t,λ) 2 ab R 2π λ2
There is no known way of determining the exact roughness of the toy model. The GVM approach [71,80] for the toy model (see Ref. [53] for a detailed presentation) consists in approximating the replicated free energy (D3) by a trial quadratic free energy (D4)
parametrized by the n × n hierarchical matrix G−1 (t): c (D5) G−1 ab (t) = δab − σab (t) t � −1 c with the connected part G−1 c (t) = b Gab = t fixed by the case in absence of disorder. The corresponding roughness is directly read from the diagonal term of its inverse matrix, combining (D2) and (D4): B(t) = T lim Gaa (t). n→0
(D6)
n cT � Gaa (t) + const, 2t a=1
(D13)
and using the Fourier transform of the correlator C¯ toy (t,y) as defined in Eq. (25): n � � � dλ 2 βD toy �F˜dis �0 = �1 − cos[λ(yb − ya )]�0 R�ξ (t,λ) 4 a,b=1 R 2π λ2
2. Gaussian Variational Method (GVM)
n 1 � ya G−1 F˜0 (t) = ab (t)yb 2 a,b=1
(D7)
(D14)
(D15) � − T2 λ2 (Gaa +Gbb −2Gab ) � � βD dλ 1 − e toy = R�ξ (t,λ). 2 ab R 2π λ2 (D16) Gathering the results (D9), (D13), and (D16) in the definition of Fvar (t) (D8), we obtain an explicit expression of Fvar [G(t)], and we can apply the extremalization condition (D7) for the off-diagonal terms a �= b (setting the usual � = Gaa ): notation G � � dλ λ2 T −λ2 T (G−G T βD � toy ab ) 0 = − G−1 − 2 × e R�ξ (t,λ) 2 ab 2 R 2π λ2 (D17) � dλ −λ2 T (G−G T � toy ab ) � e = σab − D R�ξ (t,λ) (D18) 2 2π R � since the sum ab in Eq. (D16) contains twice Gab by symmetry of the matrix, hence the “2×” in Eq. (D17). Thus for
031144-14
FINITE-TEMPERATURE AND FINITE-TIME SCALING OF . . .
a continuous parametrization σ (u) (u ∈ [0,1]; see Ref. [81]) of the hierarchical matrix σab , in a full replica-symmetrybreaking (full-RSB) formulation, one gets the self-consistent equation at each time t: � � dλ −λ2 T [G(t)−G(t,u)] D � toy e R�ξ (t,λ), (D19) σ (t,u) = 2 T R 2π � where [G(t),G(t,u)] characterizes the matrix G(t) whose matrix inverse has off-diagonal coefficients G−1 (t,u) = −σ (t,u). 3. Formal solution of the equation for σ (u)
The algebra of hierarchical matrices in the limit n → 0 has been worked out in Ref. [81], and following the conventions of Ref. [53] we recall the properties needed thereafter in the derivation of the GVM solution: � � σ (u) � − G(u) = − � ∂u G (D20) �2 G−1 c + [σ ](u) � u dv σ (v) (D21) [σ ] (u) = uσ (u) − 0 � 1 1 dv 1 � − G(u) = 1 G − −1 −1 2 u Gc + [σ ](u) u v Gc + [σ ](v) (D22) � � � 1 dv [σ ](v) σ (0) �= 1 1+ , (D23) G + −1 2 G−1 G−1 0 v Gc + [σ ](v) c c where the connected term G−1 c (t) = c/t. Denoting � dλ k −λ2 T [G(t)−G(t,u)] � toy λ e Jk (t) = R�ξ (t,λ) (D24) R 2π the extremalization equation (D19) becomes simply � 0 . Differentiating with ∂u and assuming that σ (u) = 2β DJ σ (u) �= 0, we obtain � 2D 1= � �2 J2 . G−1 c + [σ ](u)
(D25)
PHYSICAL REVIEW E 86, 031144 (2012) 2�2
of a rounded correlator R�ξ (t,λ) = e−λ ξ . In order to add saturation “wings” to this correlator, we consider a Cauchy Ansatz (see Sec. III C and Fig. 3): toy
toy
R�ξ (t,λ) =
λ2 λ2 + −2 t
e−λ
2�2
ξ
,
(D28)
where t corresponds to the transverse length scale at which the wings start to develop. From the infinite-time result (18), we expect t to diverge as t goes to infinity, which allows us to study the large-scale regime by focusing on a toy (t,λ) in small −1 t expansion. However, bluntly expanding R� ξ −1 powers of t 1 in Eq. (D19) yields divergent integrals; an alternative solution is rather to solve the coupled equations (D27) perturbatively in −1 t . Expanding J2 and J4 in powers of −1 t one finds that the following equation in X: − 12
u=2
� � � 14 � π 1 3 −2 14 � 2 4 + 7 t π X D 3 X
(D29)
� − G(t,u)] as a solution to the first admits X = � ξ 2 + T [G(t) . The physical solution must go in the limit order in −1 t −1 → 0 to the solution obtained in Ref. [53] at −1 t t = 0, which involves two RSB cutoffs u∗ (t) � uc (� ξ ) such that the solution σ (t,u) is nonconstant only for u∗ (t) � u � uc (� ξ ) and ξ ). We times below the Larkin time tc defined by u∗ (tc ) = uc (� have � − G(t,u)] � ξ 2 + T [G(t) 4
� 3 πT 4 37 × 7π 2 T 8 −2 = 8 2 4+ t + O −4 . (D30) t 10 4 8 � � 2D u 2 D u Inserting this result into the first relation in Eq. (D27), one finds that �2 � 2 u �2
� 2D (D31) + O −2 σ (t,u) = t π T 3T
� 1/2 and differentiating again Isolating G−1 c + [σ ](u) = (2DJ2 ) with ∂u yields � � 1 −1/2 T 2D u= � J4 . (D26) �2 J2 −1 Gc + [σ ](u) 2
whenever σ (t,u) is not constant. To minimal order in −1 t , � −1 σ (t,u) is translated by the constant − D . We also see from T t its definition (D21) that [σ ](t,u) is not modified at this order:
� [σ ](t,u) = [σ ](t,u)| −1 + O −2 t t =0 � �3 �
2 �2 2 u = D . (D32) + O −2 t π 3T
One finally obtains that σ (t,u) can be determined by solving the coupled self-consistent equations
Besides, the definition (D21) imposes the condition [σ ](t,0) = 0 and thus the existence of u∗ (t) for which
� 0 σ (u) = 2β DJ
and
�− 2 T u = 2− 2 D 3
1
J4 3
J2 2
[σ ](t,u � u∗ (t)) = 0.
(D27)
and the definition (D24) which hides the t dependence, � − G(u) as a function of u from the e.g., by isolating G second equation, and then inferring σ (u) from the first. These equations are valid on segments of u ∈ [0,1] where σ (u) is not constant. 4. Solution for Cauchy wings at large times
Up to now the results are valid for a generic toy-model toy correlator R�ξ (t,λ). In Ref. [53] we have worked out the case
(D33)
Both σ (t,u) and [σ ](t,u) are constant in u below u∗ (t) and can be strictly monotonous only above u∗ (t); this implies by continuity of σ (t,u) that σ (t,0) = σ (t,u � u∗ (t))
� −1
� D t + O −2 . (D34) t T ξ ) has a To determine whether the second threshold uc (� at this order, one has to correction which depends on −1 t check that the original equation (D19) is satisfied. Using the
031144-15
= σ (t,0)| −1 − t =0
ELISABETH AGORITSAS et al.
PHYSICAL REVIEW E 86, 031144 (2012)
replica inversion formula (D22), one checks that uc being fixed this quantity is not modified at order O( −1 t ):
� � − G(t,u) = [G(t) � − G(t,u)]| −1 =0 + O −2 , (D35) G(t) t t and replacing its value in the original self-consistent equation ξ ) is not for σ (t,u) (D19) we see that the equation on uc (� modified at the same order. We can hence compute the modification to the roughness � B(t) = T limn→0 G(t) as given in Eq. (D6) through the formula (D23). Observing that σ (t,0) − σ (t,0)| −1 t =0
� = G(t)| � −1 =0 + G(t) t
2 [G−1 c (t)]
1 Vt,y Vt1 ,y =
2 �
−2 � � −1 =0 − t D −1 = G(t)| , t + O t t 2 c T
(D37)
we finally obtain � −1
� t 2D . + O −2 t c2 t
1 1 1 Vt,y Vt ,y = δt,t δy,y
abD b a
−−−→ δ(t − t )δ(y − y ). a,b→0
1
Wt,y = 12 e−ß(abD) 2 Vt,y [Wt−b,y−a + Wt−b,y+a ] � �� � 1 1 2Wt−b,y + a 2 ∂y2 Wt,y � 12 1 − ß(abD) 2 Vt,y 1
B(t)| −1 t =0
so in the random-manifold roughness regime �2 1 4 D 3 t 3 . Thus for the length scale ) BRM (t) ∼ 32 ( 2πc t not 4 to modify the scaling of this asymptotic behavior via the √ 2� −1 , we must have consistently t � BRM (t). correction − t cD 2 t APPENDIX E: FROM THE DISCRETE TO THE CONTINUOUS DP
In this Appendix we determine formally the continuum limit of a discrete directed polymer model, whose parameters are denoted for convenience in Gothic script (the inverse temperature ß, the disorder strength D, and when needed the elastic constant c). See also Ref. [52] for a detailed analysis of the scalings and Ref. [61] for a mathematical approach.
β = ß, c =
(E1)
It is described by an inverse temperature ß and a disorder strength D (hidden in V through Vt,y Vt ,y = Dδtt δyy ). To explicit the correspondence between the discrete parameters ß and D and the continuum parameters β, c, and D [e.g., of the evolution equation (6)], we may explicit the lattice spacings a and b in directions y and t, respectively: Zt,y = e
1 −ß(abD) 2
1 Vt,y
[Zt−b,y−a + Zt−b,y+a ],
(E2)
b 1 , D = ab−1 D. a2 ß
(E8)
This correspondence between discrete and continuum parameters is used in Sec. IV when discussing numerical results on the discrete DP. 2. Generic case: Jump to the 2n nearest neighbors
For the sake of completeness, we now consider a generalized SOS model in the spirit of Ref. [52], where the polymer endpoint y can jump to either of its 2n neighbors y − 2n + 1,y − 2n + 3, . . . ,y + 2n − 1 with an elastic 2 weight depending on the distance j as e−ßj . The partition function now obeys Zt,y = e−ßVt,y
n �
e−ßj [Zt−1,y−(2j −1) + Zt−1,y+(2j −1) ]. (E9) 2
j =1
We explicit as previously the lattice spacings a and b, and we also introduce a microscopic elastic constant c: Zt,y = e−ß(abD) 2 Vt,y
1. Simplest case: Jump to the two nearest neighbors (n = 1)
Zt,y = e−ßVt,y [Zt−1,y−1 + Zt−1,y+1 ].
(E6)
1 a2 2 1 1 ∂y Wt,y − ß(ab−1 D) 2 Vt,y Wt,y , (E7) 2 b which corresponds for instance to the continuum FeynmanKac evolution (6) with the parameters
1
The partition function Zt,y of the discrete SOS model, where the polymer can jump one step either to its right or to its left at each time step, obeys the recursion relation
(E5)
∂t Wt,y =
(D38)
(D39)
(E4)
so that, with Wt,y − Wt−b,y � b∂t Wt,y ,
At asymptotically large times, we know [53] that � �2 � 13 3 2D 4 = t 3 −� ξ2 2 π c4
(E3)
Introducing for normalization purposes Wt,y = 2−t Zt,y , one expands its corresponding equation of evolution as follows:
� + O −2 t (D36)
B(t) = B(t)| −1 − t =0
continuum limit:
1
n �
e− 2 ca 1
2
ßj 2
j =1
× [Zt−b,y−(2j −1)a + Zt−b,y+(2j −1)a ].
(E10) −t
Introducing, for normalization purposes, Wt,y = (2�) Zt,y one expands its corresponding equation of evolution as follows: � � − 1 ca 2 ßj 2 1 � 1 1 1 − ß(abD) 2 Vt,y e 2 2� j =1 � � × 2Wt−b,y + (2j − 1)2 a 2 ∂y2 Wt−b,y . n
Wt,y �
(E11)
To ensure that the dominant order of the right-hand side is Wt−b,y , which allows us to recognize a time difference, one sets
1 2
where the factor (abD) in front of the disorder is chosen 1 1 so that Vt,y ≡ (abD)− 2 Vt,y becomes a white noise in the 031144-16
�=
n � j =1
e− 2 ca 1
2
ßj 2
.
(E12)
FINITE-TEMPERATURE AND FINITE-TIME SCALING OF . . .
Then, defining the effective elastic constant κn (c,ß) as in Ref. [52]: �n − 12 ca 2 ßj 2 j =1 e κ n = �n , (E13) 1 2 2 ß j =1 (2j − 1)2 e− 2 ca ßj
PHYSICAL REVIEW E 86, 031144 (2012)
which corresponds to the continuum evolution (6) upon the identification b (E15) β = ß, c = 2 κn (c,ß), D = ab−1 D. a
1 a2 2 1 ∂ Wt,y − ß(ab−1 D) 2 Wt,y Vt,y , (E14) 2ßκn b y
Note that the result holds for any n; in particular, κn = 1ß for n = 1 (as obtained in the previous paragraph) but κn goes to another c-dependent limit for n2 � T , which enables us in particular to study the high-temperature limit of the discrete directed polymer model [52].
[1] S. Moulinet, C. Guthmann, and E. Rolley, Eur. Phys. J. E 8, 437 (2002). [2] M. Alava, M. Dub´e, and M. Rost, Adv. Phys. 53, 83 (2004). [3] D. Bonn, J. Eggers, J. Indekeu, J. Meunier, and E. Rolley, Rev. Mod. Phys. 81, 739 (2009). [4] P. Le Doussal, K. J. Wiese, S. Moulinet, and E. Rolley, Europhys. Lett. 87, 56001 (2009). [5] M. Alava and K. Niskanen, Rep. Progr. Phys. 69, 669 (2006). [6] P. Le Doussal, A. A. Middleton, and K. J. Wiese, Phys. Rev. E 79, 050101 (2009). [7] P. Le Doussal and K. J. Wiese, Phys. Rev. E 79, 051106 (2009). [8] J. Maunuksela, M. Myllys, O.P. K¨ahk¨onen, J. Timonen, N. Provatas, M. J. Alava, and T. Ala-Nissila, Phys. Rev. Lett. 79, 1515 (1997). [9] L. Miettinen, M. Myllys, J. Merikoski, and J. Timonen, Eur. Phys. J. B 46, 55 (2005). [10] S. Lemerle, J. Ferr´e, C. Chappert, V. Mathet, T. Giamarchi, and P. Le Doussal, Phys. Rev. Lett. 80, 849 (1998). [11] V. Repain, M. Bauer, J. Jamet, J. Ferr´e, A. Mougin, C. Chappert, and H. Bernas, Europhys. Lett. 68, 460 (2004). [12] P. J. Metaxas, J. P. Jamet, A. Mougin, M. Cormier, J. Ferr´e, V. Baltz, B. Rodmacq, B. Dieny, and R. L. Stamps, Phys. Rev. Lett. 99, 217208 (2007). [13] T. Tybell, P. Paruch, T. Giamarchi, and J. M. Triscone, Phys. Rev. Lett. 89, 097601 (2002). [14] P. Paruch, T. Giamarchi, and J. M. Triscone, Phys. Rev. Lett. 94, 197601 (2005). [15] A. Barab´asi and H. E. Stanley, Fractal Concepts in Surface Growth (Cambridge University Press, Cambridge, 1995). [16] J. Krug, Adv. Phys. 46, 139 (1997). [17] G. Blatter, M. V. Feigel’man, V. B. Geshkenbein, A. I. Larkin, and V. M. Vinokur, Rev. Mod. Phys. 66, 1125 (1994). [18] T. Halpin-Healy and Y. Zhang, Phys. Rep. 254, 215 (1995). [19] S. Brazovskii and T. Nattermann, Adv. Phys. 53, 177 (2004). [20] P. Le Doussal and K. J. Wiese, Phys. Rev. E 72, 035101 (2005). [21] K. J. Wiese and P. Le Doussal, Markov Proc. Relat. Fields 13, 777 (2007). [22] T. Giamarchi, A. Kolton, and A. Rosso, in Lecture Notes in Physics, Vol. 688 (Springer, Berlin, 2006), p. 91. [23] E. Agoritsas, V. Lecomte, and T. Giamarchi, Physica B 407, 1725 (2012). [24] M. Kardar, G. Parisi, and Y. C. Zhang, Phys. Rev. Lett. 56, 889 (1986). [25] T. Sasamoto and H. Spohn, J. Stat. Mech.: Theor. Exp. (2010) P11013.
[26] I. Corwin, Random Matrices: Theory Appl. 1, 1130001 (2012). [27] T. Kriecherbauer and J. Krug, J. Phys. A 43, 403001 (2010). [28] D. Forster, D. R. Nelson, and M. J. Stephen, Phys. Rev. A 16, 732 (1977). [29] F. Comets, T. Shiga, and N. Yoshida, in Stochastic Analysis on Large Scale Interacting Systems (Mathematical Society of Japan, Tokyo, 2004), pp. 115–142, http://hal.archives-ouvertes.fr/hal-00104909/. [30] G. Giacomin, Random Polymer Models (Imperial College Press, London, 2007). [31] F. Comets and M. Cranston, arXiv:1107.2011 (2011). [32] K. Johansson, Comm. Math. Phys. 209, 437 (2000). [33] M. Pr¨ahofer and H. Spohn, Phys. Rev. Lett. 84, 4882 (2000). [34] H. Spohn, Physica A 369, 71 (2006). [35] H. Spohn, Physica A (Amsterdam) 369, 71 (2006). [36] J. Rambeau and G. Schehr, Europhys. Lett. 91, 60006 (2010). [37] G. Schehr, arXiv:1203.1658 (2012). [38] P. J. Forrester, S. N. Majumdar, and G. Schehr, Nucl. Phys. B 844, 500 (2011). [39] M. Kulkarni and A. Lamacraft, arXiv:1201.6363 (2012). [40] L.H. Gwa and H. Spohn, Phys. Rev. A 46, 844 (1992). [41] H. van Beijeren, Phys. Rev. Lett. 108, 180601 (2012). [42] K. A. Takeuchi and M. Sano, Phys. Rev. Lett. 104, 230601 (2010). [43] K. A. Takeuchi, M. Sano, T. Sasamoto, and H. Spohn, Sci. Rep. 1, 34 (2011). [44] K. Takeuchi and M. Sano, J. Stat. Phys. 147, 853 (2012). [45] M. Pr¨ahofer and H. Spohn, J. Stat. Phys. 108, 1071 (2002). [46] K. Johansson, Comm. Math. Phys. 242, 277 (2003). [47] C. Tracy and H. Widom, Comm. Math. Phys. 159, 151 (1994). [48] P. Calabrese, P. Le Doussal, and A. Rosso, Europhys. Lett. 90, 20002 (2010). [49] G. Amir, I. Corwin, and J. Quastel, Comm. Pure App. Math. 64, 466 (2011). [50] T. Sasamoto and H. Spohn, Nucl. Phys. B 834, 523 (2010). [51] V. Dotsenko, Europhys. Lett. 90, 20003 (2010). [52] S. Bustingorry, P. Le Doussal, and A. Rosso, Phys. Rev. B 82, 140201 (2010). [53] E. Agoritsas, V. Lecomte, and T. Giamarchi, Phys. Rev. B 82, 184207 (2010). [54] R. P. Feynman, Rev. Mod. Phys. 20, 367 (1948). [55] M. Kac, Trans. Amer. Math. Soc. 65, 1 (1949). [56] D. A. Huse, C. L. Henley, and D. S. Fisher, Phys. Rev. Lett. 55, 2924 (1985). [57] M. Kardar, Statistical Physics of Fields (Cambridge University Press, Cambridge, 2007).
one recovers from (E11) the equation of evolution ∂t Wt,y =
031144-17
ELISABETH AGORITSAS et al.
PHYSICAL REVIEW E 86, 031144 (2012)
[58] E. Agoritsas, V. Lecomte, and T. Giamarchi, arXiv:1209.0567 (2012). [59] L. Bertini and N. Cancrini, J. Stat. Phys. 78, 1377 (1995). [60] L. Bertini and G. Giacomin, Comm. Math. Phys. 183, 571 (1997). [61] T. Alberts, K. Khanin, and J. Quastel, arXiv:1202.4403 (2012). [62] M. Kardar, Nucl. Phys. B 290, 582 (1987). [63] M. Kardar, Phys. Rev. Lett. 55, 2923 (1985). [64] V. Dotsenko and B. Klumov, J. Stat. Mech.: Theor. Exp. (2010) P03022. [65] A. Borodin, I. Corwin, and P. Ferrari, arXiv:1204.1024 (2012). [66] I. Corwin, arXiv:1106.1596 (2011). [67] T. Nattermann, Europhys. Lett. 4, 1241 (1987). [68] G. Parisi, J. Phys. 51, 1595 (1990). [69] M. M´ezard, J. Phys. France 51, 1831 (1990).
[70] J. P. Bouchaud and H. Orland, J. Stat. Phys. 61, 877 (1990). [71] M. M´ezard and G. Parisi, J. Physique I 2, 2231 (1992). [72] D. S. Fisher and D. A. Huse, Phys. Rev. B 43, 10728 (1991). [73] T. Hwa and D. S. Fisher, Phys. Rev. B 49, 3136 (1994). [74] P. Le Doussal and C. Monthus, Physica A 317, 140 (2003). [75] T. Nattermann and W. Renz, Phys. Rev. B 38, 5184 (1988). [76] F. Bornemann, P. L. Ferrari, and M. Pr¨ahofer, J. Stat. Phys. 133, 405 (2008). [77] F. Bornemann, Math. Comp. 79, 871 (2010). [78] A. Borodin and I. Corwin, arXiv:1111.4408 (2011). [79] N. O’Connell, Ann. Probab. 40, 437 (2012). [80] Y. Y. Goldschmidt and T. Blum, Phys. Rev. E 48, 161 (1993). [81] M. M´ezard and G. Parisi, J. Phys. I 1, 809 (1991).
031144-18