Compass enables a developer to effectively navigate from an object ... poses the novel concept of flow-centric debugging to support an effective navigation of.
Flow-Centric, Back-In-Time Debugging? Adrian Lienhard, Julien Fierz, Oscar Nierstrasz Software Composition Group, University of Bern, Switzerland http://scg.unibe.ch
Summary. Conventional debugging tools present developers with means to explore the run-time context in which an error has occurred. In many cases this is enough to help the developer discover the faulty source code and correct it. However, rather often errors occur due to code that has executed in the past, leaving certain objects in an inconsistent state. The actual run-time error only occurs when these inconsistent objects are used later in the program. So-called back-intime debuggers help developers step back through earlier states of the program and explore execution contexts not available to conventional debuggers. Nevertheless, even back-in-time debuggers do not help answer the question, “Where did this object come from?” The Object-Flow Virtual Machine, which we have proposed in previous work, tracks the flow of objects to answer precisely such questions, but this VM does not provide dedicated debugging support to explore faulty programs. In this paper we present a novel debugger, called Compass, to navigate between conventional run-time stack-oriented control flow views and object flows. Compass enables a developer to effectively navigate from an object contributing to an error back-in-time through all the code that has touched the object. We present the design and implementation of Compass, and we demonstrate how flow-centric, back-in-time debugging can be used to effectively locate the source of hard-to-find bugs.
1 Introduction When debugging object-oriented systems, the hardest task is to find the actual root cause of a failure as this can be far from where the bug actually manifests itself [1]. In a conventional debugger, the developer is provided with an interface to explore the run-time context at a particular point in time in the execution of the program. Very often defective code leads very quickly to a run-time failure, so in these cases the run-time context is exactly what we need to identify bugs. Unfortunately there are also frequent situations where the failure occurs an arbitrary period of time after the defective code has executed, in which case the run-time context at the time of the failure contains little or no useful information about the source of the error. In a recent study, Liblit et al. examined bug symptoms for various programs and found that in 50% of the cases the execution stack contains essentially no information about the bug’s cause [2]. Back-in-time debuggers have been developed to help developers step back through earlier states of the program and explore execution contexts not available to conventional debuggers. Back-in-time debugging has gained increasing attention recently ?
In Proceedings of TOOLS Europe 2009, LNBIP 33 p. 272-288, © Springer-Verlag, 2009.
2
A. Lienhard, J. Fierz, O. Nierstrasz
[3, 4, 5, 6]. Still, even back-in-time debuggers are of only limited help, since they provide no dedicated mechanism to identify which past contexts led to the defective state. As a consequence, developers have to manually inspect the execution history to backtrack the origins of an object. Manual inspection of the execution history can be tedious because of the overwhelming amount of data that is typically recorded from program runs. Essentially, we need an effective way to answer the question: “Where did this object come from?”. We have previously proposed an approach to track the flow of objects in a dedicated Object Flow Virtual Machine to answer precisely such questions [7], but the prototype VM does not include any debugging support to exploit object-flows. This paper proposes the novel concept of flow-centric debugging to support an effective navigation of object-oriented execution history during debugging, and presents Compass, a proof-ofconcept flow-centric debugger based on the Object Flow VM. Compass provides several novel views to aid the developer in navigating between the historical control flow and object flow information spaces. One of these views represents the entire history of a running application as an interactive call graph using a “fisheye” view. In this view, the method execution currently in focus is represented as a large circle, and more distant nodes are correspondingly smaller. As one navigates through the call graph, nodes shift and are resized as though they were viewed through a fisheye lens. The contributions of this paper are: (i) a novel approach, called flow-centric debugging, to bridge control flow views offered by conventional debuggers and historical object state views of back-in-time debuggers, and (ii) a scalable and practical implementation strategy with a proof-of-concept prototype called Compass. Outline. In Section 2 we present a simple example to motivate the need for flow-centric debugging. In Section 3 we review existing approaches to back-in-time debugging, and demonstrate how they fall short in tracing back through object flows. Section 4 describes Compass, a proof-of-concept, object-centric, back-in-time debugger. Section 5 describes a realistic example that illustrates how Compass can be used effectively to discover hard-to-track software bugs. In Section 6 we present our implementation, which is based on a metamodel for a debugger that integrates control and object flow into a common approach. Section 7 presents conclusions and remarks on possible future extensions.
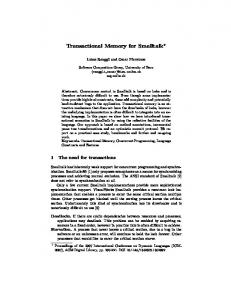
2 Motivating example Let us consider a simple toy example that illustrates the shortcomings of both conventional debuggers and back-in-time debuggers for tracking down a common class of software defects. Figure 1 shows a UML sequence diagram of a scenario leading to a software failure. A Bank is responsible for logging new deposits and adding interest to individual BankAccount instances. It makes a request to an InputReader instance for (1) a new deposit, which is (2) returned to the Bank. The returned value happens to be nil, but this does not lead to an immediate failure. The value is (3) returned to the Bank
Flow-Centric, Back-In-Time Debugging Bank BankAccount
a BankAccount
an InputReader
3
an InterestCalculator
example getDeposit
readDeposit nil
1
2 nil 3 4 deposit: (deposit:nil) 5
addInterest deposit
6 nil
7
8 calculateNewDeposit (deposit : nil, interest: 0.05)
Fig. 1. Sequence diagram of the crashing example.
from a helper method. The value is (4) saved in a BankAccount and (5) stored in a private field. The Bank then triggers the BankAccount to compute interest, so it (6) reads the value with an accessor that (7) returns it. The BankAccount then (8) passes the value to the InterestCalculator instance, which blows up when it tries to compute interest for a nil value. Now consider a developer trying to debug this with a conventional debugger. We can clearly see that the failure is due to the nil value, but the debugger only gives us the run-time context back to the point where the value was (6) read from the field where it was stored. We would have to set a breakpoint where the variable is stored (5) and re-run the program. Now we can see that the value was returned (3) from the method getDeposit, but since this method context is not on the stack anymore, we have to set another breakpoint to find out where the value comes from, etc. A back-in-time debugger would allow us to step back in time, but we do not know how far back in time we must travel. We have no information to tell us where to go. Although the given scenario is tiny, a real-world scenario might include many thousands of events between the failure and the point where the faulty value is computed and stored. As we shall see in the following section, present back-in-time debuggers do not
4
A. Lienhard, J. Fierz, O. Nierstrasz
offer adequate mechanisms to identify the contexts that the faulty object has passed through.
3 Limitations of current back-in-time debuggers Next we look briefly at three examples of back-in-time debuggers and summarize the mechanisms they provide for navigating through historical contexts. In particular we look at how well they support the task of tracing object flow. TOD. The Trace-Oriented Debugger [4] is a back-in-time debugger for Java, implemented as an Eclipse plugin, that improves the performance by using a high-speed distributed database backend. Omniscient Debugger. The Omniscient Debugger [3] is a back-in-time debugger for Java, which instruments bytecode at load time, and offers a user interface to step through the generated traces and inspect the state of objects at any time. Unstuck. The Unstuck debugger [5] is a back-in-time debugger for Squeak Smalltalk2 . These approaches adopt a common perspective of the program execution history. All three debuggers provide views that are stack-oriented and state-centric. The user can browse and step through the method execution trace (run-time control flow) and inspect the past state of objects. Figure 2 shows a debugging session of our running example introduced in Section 2 with the Trace-Oriented Debugger (TOD). The stack is displayed in view (A) and the current values of variables are shown in view (D). With the buttons (B) the user can step forward and backward in the recorded control flow. This perspective is a natural extension from conventional debuggers, which show the current call stack and a snapshot of the current state of objects. Back-in-time debuggers have extended these views with historical run-time data. The call stack is extended to the complete execution trace, and the object inspector is extended to all previous values of an object’s fields. Considering our example, with this perspective we can identify the faulty value of the deposit field in the bank account instance. Furthermore, we can jump to any past method execution. However, none of the three debuggers provides sophisticated support to link the symptom of the bug (null pointer exception) with its root cause (where the null value is introduced). Hence, we do not know how far back we need to jump. If we knew the origin of null, the root cause could be identified in one step. In practice, however, bugs tend to be more complex as faulty variables may infect other variables [8, 9]. Therefore, to trace back the infection chain, often several objects have to be backtracked. The features that the TOD, Omniscient Debugger, and Unstuck provide to backtrack object flow are ad hoc: – TOD: a “why?” hyperlink (see Figure 2 (D)) allows the focus to be moved to the statement that assigned the current value 2
http://squeak.org
Flow-Centric, Back-In-Time Debugging
5
C
B
A
D
Fig. 2. TOD. Control flow (A) can be stepped (B), and stays in sync with events in the source code (C). Current objects are also shown (D).
– Omniscient Debugger offers similar functionality like TOD – Unstuck: allows one to color all methods in the call trace in which a selected object was used The features provided by TOD and Omniscient Debugger support only one backtracking step (from a field value to where it was assigned or from a method parameter to where the method was called). Hence, to get to the origin of the value, manual steps are required. This includes figuring out by which method execution an object was returned, which can be hard if loops are involved. Therefore, backtracking non-trivial object flows can quickly become a tedious task. The coloring feature provided by Unstuck (see Figure 3) gives a good overview of how often an object was used but it provides only limited support for tracking object flows. For objects that are often used, a lot of code gets highlighted even if the code is not in the path of the object that the developer is interested in. This limitation becomes especially obvious if one wants to backtrack the flow values like null, true, and false. Since these values occur in a very large number of methods, the highlighting of Unstuck is of little use.
26 6
CHAPTER 4. EXAMPLES A. Lienhard, J. Fierz, O. Nierstrasz
Fig. 3. Unstuck. The method trace (at left) stays in sync with the source code view (at right). Methods of the currently selected object are highlighted (reprinted from reference [5]).
Further related work. Omnicore’s CodeGuide3 and RetroVue4 , two commercial products, provide similar stack-oriented functionality like the three above presented apFigure 4.7: The the place where the only theis interesting variable proaches. Probably most interesting earlierchange related of work ZStep95, a reversible happend. debugger for Lisp. A notable feature of ZStep95 is to directly access from graphical objects the code that drew them [10]. Approaches, such as the Data Display Debugger [11] and Reference Patterns [12], explicitly focus on graphical state-centric views. Most other back-in-time debugging related work is focused on improving performance and addressing the memory explosion problem rather than researching ways to exploit the gathered data [13, 14, 15]. Problem summary. Since existing back-in-time debuggers adopt the traditional stackoriented and state-centric views and introduce only minimal innovations to take history into account, they fail to capture the orthogonal issue of object flow. As Figure 4 illustrates, the problem we face is to link the control flow and object flow spaces. What we are missing is a means to link these spaces and to provide views to navigate between them.
4 Compass: a flow-centric back-in-time debugger Compass5 is a proof-of-concept debugger for object-oriented programs. We chose the name “Compass” because its goal is to be an instrument that provides directions to 3 4 5
http://www.omnicore.com Figure 4.8: The abstract syntax tree for the method. http://www.visicomp.com http://scg.unibe.ch/Research/ObjectFlow/
26
Flow-Centric, Back-In-Time Debugging
7
Control flow space
? Object flow space
Fig. 4. A debugger must offer mechanisms to navigate between control and object flow views.
effectively navigate the large information space. Compass is implemented using the Object Flow VM, which efficiently tracks object-flow at run-time [7]. The Compass user interface is shown in Figure 5. We briefly introduce each of the views provided by Compass, and then we focus on the views that are especially interesting from the perspective of navigating between the object and control flow spaces.
8
1
2
3
4
5
6
9
7
Fig. 5. The Compass debugger.
1. The method trace view visualizes the entire run-time control flow as a tree of nodes in a fisheye view. Object flows are shown as green arrows between nodes. 2. Call stack of the currently selected method execution. 3. Lists each reference transfer of the flow of the object selected by the developer, by, e.g., double-clicking on an item in the sub-method statements list (5). 4. Source code of the selected method and buttons to step forward and backward through the method trace.
8
A. Lienhard, J. Fierz, O. Nierstrasz
5. 6. 7. 8.
List of reference transfers and message sends of current method execution. Variable inspector panes. Lists of control flow statements the method depends on. Displays changes in relationships between objects in the subtrace of the selected method execution. 9. Lets the developer go back and forth, or jump to bookmarked method executions. We now focus on how these views present control flow and object flow, and how they enable navigation between these two spaces. 4.1 Navigating method execution traces Compass provides two synchronized views of method execution traces. The method trace view ((1) in Figure 5) shows the entire method execution trace as a tree, and view (2) offers a more conventional stack-oriented view of a single slice of the trace, focused on a given method execution. The challenge in presenting the entire trace as a tree is that the obvious approach of using a conventional tree list does not scale well. For this reason Compass offers a novel approach to navigating traces based loosely on the notion of a fisheye view [16]. The key idea is to present method executions not as text but as circles, showing the currently selected method execution as a large circle in the center of the view. More distant method executions are shown as progressively smaller circles, progressively closer to the edge of the view.
Fig. 6. A method trace view synchronized with a stack view. Mousing over a node pops up a tool tip identifying the method execution. Clicking on it shifts the focus to that node.
Flow-Centric, Back-In-Time Debugging
9
In Figure 6 we see the currently selected method execution simultaneously highlighted in the method trace view and the call stack view. Note that we sacrifice the textual feedback of a tree list view for a high level graphical overview of the method execution tree, but we lose little since the synchronized stack view gives us detailed information of the method execution in focus. We can rapidly navigate to nearby nodes in the tree by clicking on them. Since nodes in neighbouring branches are not represented in the stack view, the fisheye view offers tooltips with the name of each method execution as the mouse hovers over its node. The layout of the method trace tree is not strictly a conventional fisheye view because we independently scale the x and y coordinates of each node. We compute the x coordinate as a function ft of the timestamp t of a given node, as shown in the following equation, where tf ocus is the start timestamp of the currently selected method execution, Ct is a constant configured in the tool, and w is the width of the view: ( w + ft · w2 (t ≥ tf ocus ) 1 x = w2 ft = 1 − w |tf ocus − t| · Ct + 1 (t < tf ocus ) 2 − ft · 2 The value of ft is always in the interval [0, 1); the more ft tends to 0, the closer the node is positioned horizontally to the focused node. The y coordinate is computed similarly, but using the nesting level (depth of the call stack) of method executions instead of their timestamp. The size s of each circular node is computed as follows: s = (1 − ft ) · sf ocus where the constant sf ocus is the size of the focused method execution. Both constants sf ocus and Ct , where the latter defines the relative distance between nodes, can be adjusted by the user. When the focused node changes, the transition from the old to the new state of the method trace view is animated. The smooth transition is intended to help the user follow how the point of view changes. This proved especially useful when backtracking object flows that jump between a large number of method executions. 4.2 Navigating object flows Object flow is visualized as follows: for a given method execution selected in either the method trace view (1) (Figure 5) or the stack view (2), all object flow events are listed in view (5). An object flow is selected by double-clicking on one of these events. The entire object flow is then simultaneously displayed textually as a list in view (3), and graphically as green arrows connecting nodes in the method trace view (1), as shown in Figure 7. An object flow answers the question “Where did this object come from?” by displaying the path of reference transfers from the instantiation event to the selected reference. One may then navigate through the object flow by using either the textual or graphical views. The beginning of an object flow represents the creation event. An arrow from a parent to a child node usually means that an object reference was passed as a method
10
A. Lienhard, J. Fierz, O. Nierstrasz
Fig. 7. Object flow visualized in method trace. Synced with the stack view at bottom left and the list of reference transfers of the selected object flow at bottom right.
argument, and an arrow from a child to its parent node means that the reference was returned from that method. Arrows between more distant nodes mean that the first node wrote the object to a field and that the second node read it. Arrows between parent and child nodes may also indicate that a field was written and then read, but this is relatively rare. To directly navigate to where the object was instantiated one can select the last item in the textual list. (Like the call stack, which grows from bottom to top, the most recent transfer of the object is at the top of the list and its instantiation is at the bottom of the list.) Often, not only the flow of an object is of interest but also where one of its field values comes from. Compass and the Object Flow VM treat objects and values of primitive type the same. Hence, to track back the origin of a field value (even if it is nil) one simply changes the focus of Compass to this value. For more details about the other views and the design and implementation of Compass, the interested reader is referred to the Masters thesis by Fierz [17].
5 Flow-centric debugging in action In this section we demonstrate how Compass can be used in practice with an example of an actual, hard-to-debug defect in a multi-threaded application. The defect occurred in Pharo Smalltalk6 in the software update feature, which downloads and installs both 6
http://pharo-project.org
Flow-Centric, Back-In-Time Debugging
11
kernel and library updates. The example has been simplified for presentation purposes, but otherwise reflects the actual defect. Problem. The example application downloads and installs software updates using two concurrent processes. The download process is handled by an UpdateDownloader class. It puts updates into a queue shared with an installer process and puts a special marker in the queue to indicate that all updates have been downloaded: self getUpdates withIndexDo: [ :code :i | aSemaphore wait. aQueue nextPut: i. aQueue nextPut: code ]. aQueue nextPut: ''. aQueue nextPut: #finished
The installer process is handled by an UpdateLoader class, which simply gets updates from the shared queue and evaluates them: [ this := docQueue next. nextDoc := docQueue next. nextDoc ∼= #finished ] whileTrue: [ Compiler evaluate: nextDoc. docQueueSema signal ].
Unfortunately the application freezes unexpectedly. If we interrupt the application, a traditional debugger tells us that the update loader is blocked on an empty queue. This suggests that the downloader has not only stopped putting updates into the queue, but it has also failed to put the “finished” marker into the queue. Inspecting the stack trace and reading the source code does not help us to get any further in tracking down the source of the problem. Solution. In Compass, when more than one process is traced, the method trace view simply displays more than one root method execution. Starting Compass, we find ourselves in the context of the block method execution of next in the shared queue. Stepping up the stack one level, we find ourselves in the UpdateLoader method responsible for sending the blocking request (Figure 8).
Fig. 8. Execution of the update loader.
We see here that next has been sent 5 times, after which the method blocks on the shared queue. Therefore, this context is clearly interesting and we bookmark it so that we can easily return here.
12
A. Lienhard, J. Fierz, O. Nierstrasz
Now we want to understand where the objects in the shared queue are coming from, so we double-click the statement return '4+4' to backtrack the flow of the string '4+4' (Figure 9).
Fig. 9. Object flow of a element in the queue.
We follow back the object flow, which brings us from the update loader process to the execution of withIndexDo: in the download process (see Figure 10).
Fig. 10. Loop on downloaded updates.
We can clearly see that a fifth update has been downloaded, but then the downloader stops abruptly. Something has interrupted this process, but we do not know what. The other active process is the update loader, so we follow our bookmark back to there. We note (Figure 8) that updates read from the queue are evaluated by the compiler, so now we step into the last evaluation and explore what happened during the last update. Quickly we arrived at the cleanup method of the update loader and remark something unusual in the side effects graph (right side of Figure 11), namely that the update loader used to have a reference to the downloader, but now it points to nil. Furthermore, the downloader no longer refers to its process.
Fig. 11. Side effects of the executed update code.
Flow-Centric, Back-In-Time Debugging
13
Stepping further we discover that the cleanup method terminates the downloader and nils it out (Figure 12). Evidently this update has erroneously initiated the cleanup procedure, which is only supposed to be invoked when all updates have been downloaded.
Fig. 12. Cleanup method that stops the download process.
Alternative solution. Of course, there are other ways to home in on the defect. For example, the update loader initializes and starts the downloader as follows: retrieveUpdatesOntoQueue: aQueue withWaitSema: aSemaphore self downloader ifNotNil: [ self downloader terminate ]. self downloader: (UpdateDownloader new initializeWith: aQueue with: aSemaphore). self downloader start
We can then use another feature of Compass, the forward flow explorer, to see what happens with the downloader afterwards (Figure 13).
Fig. 13. The forward flow of the downloader object.
The forward flow shows us that the downloader is later instructed to terminate itself. When we shift our focus to this point, the run-time stack tells us that this request has originated from one of the downloaded updates.
6 Implementation: a flow-centric debugging metamodel Existing approaches commonly collect run-time data by introducing sensors into the bytecode to emit events whenever a method is entered or exited, or when a variable is assigned. The result is a trace of events organized into a control flow. The data for the user interface is then obtained by querying this trace.
14
A. Lienhard, J. Fierz, O. Nierstrasz
Fig. 14. A metamodel combining control flow and object flow.
In contrast, we implement our new approach to flow-centric debugging by making the relevant metamodel explicit. In order to effectively exploit the opportunities offered by back-in-time debuggers, we must connect these views at the metamodel level. The metamodel is populated by run-time data gathered by the Object Flow VM, which tracks object-flow by creating an alias whenever an object reference is transferred [7]. Figure 14 presents our proposal for a combined metamodel. The upper portion of the figure shows our metamodel for representing control flow information [18]. The lower portion presents our metamodel for expressing object flow. Control flow. The execution trace is modeled by the entity MethodExecution, which points to the caller and holds a timestamp to capture the order and nesting of method executions in the control flow. Each method execution is associated with the entity Method, its static counterpart. The code of a method is represented as a list of statements (we could also use an abstract syntax tree representation, but a flat list is sufficient for our purpose). This control flow metamodel provides the means to step through the runtime control flow and to map each method execution to the source code statement from which it was called (notice the association between MethodExecution and the Send statement). Hence, one main reason for capturing single statements is to be able to map dynamic events, like method executions, to the source code.
Flow-Centric, Back-In-Time Debugging
15
Object flow. Object-flow is captured by representing every object reference created at run-time as an instance of the entity Alias. A new alias is created whenever an object is created, passed as a parameter to a method, returned from a method, written to a field, or read from a field. The flow of an object is then given by all its aliases. Through the origin association, each alias points to the alias from which it originates. This allows us to track the flow of an object from a specific point in the program execution back to where it was instantiated. Furthermore, aliases capture historical object state, modeled by the predecessor association. The combined control flow and object flow metamodel establishes the links between these two: each alias is linked to the control flow that caused the alias to be created. That is, each alias captures the method execution in which it is created and it captures the static statement that caused its creation. This linking in our metamodel allows us to precisely map object flow to control flow. Hence, the metamodel not only supports stepping in the execution trace, but it also directly supports navigating along the flow of objects. Scalability. Benchmarks of our Object Flow VM have shown significant improvements over existing approaches. By only keeping track of still-relevant past data, memory consumption stays within reasonable bounds and the run-time overhead is reduced. Our solution makes use of the garbage collector to release the objects that are not referenced anymore in memory and that are not relevant anymore in the program’s history. The relevance of a historical data point depends, among other properties, on the flow of objects. For instance, a method context (and its associated call stack) is retained in history as long as objects exist in memory that were passed through this method context. The Object Flow VM tracks object flow and hence the Compass debugger can directly access this information without requiring a static analysis. For a more detailed description of the Object Flow VM and its performance characteristics we refer the interested reader to our previous work [7, 19].
7 Conclusions and future Work We have proposed flow-centric, back-in-time debugging as a novel way to improve the effectiveness of back-in-time debuggers by tracking the flow of object references back through the method executions responsible for their flow. We have presented Compass, a proof-of-concept prototype that offers several novel views to aid the developer in navigating between historical control flow and object flow views. We have presented a typical scenario that demonstrates how empirically hard-to-find defects can be effectively tracked down with flow-centric debugging. Finally we have formalized our approach by presenting a simple metamodel that integrates conventional control-flow analysis of running applications with object flow analysis. Although Compass was not especially designed for debugging multi-threaded applications, it turns out to be remarkable effective since object flows capture precisely the interesting interactions between processes. The fisheye view displays the method executions of each relevant process as a tree. These trees then interleave. The view
16
A. Lienhard, J. Fierz, O. Nierstrasz
could be further improved by better distinguishing the different processes, yet keeping the property of revealing object reference transfers between processes. We have not yet carried out an empirical study to evaluate the effectiveness of flowcentric debugging. We hypothesize that Compass will considerably speed up the process of identifying the root cause of typical bugs in object-oriented programs compared to the identical tool lacking object-flow navigation features.
Flow-Centric, Back-In-Time Debugging
17
Acknowledgments We gratefully acknowledge the financial support of the Swiss National Science Foundation for the project “Bringing Models Closer to Code” (SNF Project No. 200020121594, Oct. 2008 - Sept. 2010). We would also like to thank David R¨othlisberger and Tudor Gˆırba for their help in reviewing drafts of this paper.
References 1. Zeller, A.: Why Programs Fail: A Guide to Systematic Debugging. Morgan Kaufmann (October 2005) 2. Liblit, B., Naik, M., Zheng, A.X., Aiken, A., Jordan, M.I.: Scalable statistical bug isolation. In: Proceedings of the 2005 ACM SIGPLAN conference on Programming language design and implementation (PLDI’05), New York, NY, USA, ACM (2005) 15–26 3. Lewis, B.: Debugging backwards in time. In: Proceedings of the Fifth International Workshop on Automated Debugging (AADEBUG’03). (October 2003) 4. Pothier, G., Tanter, E., Piquer, J.: Scalable omniscient debugging. Proceedings of the 22nd Annual SCM SIGPLAN Conference on Object-Oriented Programming Systems, Languages and Applications (OOPSLA’07) 42(10) (2007) 535–552 5. Hofer, C., Denker, M., Ducasse, S.: Design and implementation of a backward-in-time debugger. In: Proceedings of NODE’06. Volume P-88 of Lecture Notes in Informatics., Gesellschaft f¨ur Informatik (GI) (September 2006) 17–32 6. Maruyama, K., Terada, M.: Debugging with reverse watchpoint. In: Proceedings of the Third International Conference on Quality Software (QSIC’03), Washington, DC, USA, IEEE Computer Society (2003) 116 7. Lienhard, A., Gˆırba, T., Nierstrasz, O.: Practical object-oriented back-in-time debugging. In: Proceedings of the 22nd European Conference on Object-Oriented Programming (ECOOP’08). Volume 5142 of LNCS., Springer (2008) 592–615 ECOOP distinguished paper award. 8. Zeller, A.: Isolating cause-effect chains from computer programs. In: SIGSOFT ’02/FSE-10: Proceedings of the 10th ACM SIGSOFT symposium on Foundations of software engineering, New York, NY, USA, ACM Press (2002) 1–10 9. Cleve, H., Zeller, A.: Locating causes of program failures. In: ICSE ’05: Proceedings of the 27th international conference on Software engineering. (2005) 342–351 10. Lieberman, H., Fry, C.: ZStep 95: A reversible, animated source code stepper. In Stasko, J., Domingue, J., Brown, M.H., Price, B.A., eds.: Software Visualization — Programming as a Multimedia Experience, Cambridge, MA-London, The MIT Press (1998) 277–292 11. Zeller, A., L¨utkehaus, D.: DDD — a free graphical front-end for Unix debuggers. SIGPLAN Not. 31(1) (1996) 22–27 12. De Pauw, W., Sevitsky, G.: Visualizing reference patterns for solving memory leaks in Java. In Guerraoui, R., ed.: Proceedings of the European Conference on Object-Oriented Programming (ECOOP’99). Volume 1628 of LNCS., Lisbon, Portugal, Springer-Verlag (June 1999) 116–134 13. Feldman, S.I., Brown, C.B.: Igor: a system for program debugging via reversible execution. In: Proceedings of the 1988 ACM SIGPLAN and SIGOPS workshop on Parallel and distributed debugging (PADD’88), New York, NY, USA, ACM (1988) 112–123 14. Boothe, B.: Efficient algorithms for bidirectional debugging. In: Proceedings of the ACM SIGPLAN 2000 conference on Programming language design and implementation (PLDI’00), New York, NY, USA, ACM (2000) 299–310
18
A. Lienhard, J. Fierz, O. Nierstrasz
15. Xu, G., Rountev, A., Tang, Y., Qin, F.: Efficient checkpointing of java software using contextsensitive capture and replay. In: Proceedings of the the 6th joint meeting of the European software engineering conference and the ACM SIGSOFT symposium on The foundations of software engineering (ESEC-FSE’07), New York, NY, USA, ACM (2007) 85–94 16. Furnas, G.W.: Generalized Fisheye View. In: Proceedings of CHI ’86 (Conference on Human Factors in Computing Systems), ACM Press (1986) 16–23 17. Fierz, J.: Compass: Flow-centric back-in-time debugging. Master’s thesis, University of Bern (January 2009) 18. Richner, T.: Recovering Behavioral Design Views: a Query-Based Approach. PhD thesis, University of Bern (May 2002) 19. Lienhard, A.: Dynamic Object Flow Analysis. Phd thesis, University of Bern (December 2008)