Forecasting Return Volatility in the Presence of Microstructure Noise Zhixin Kang1 Lan Zhang2 Rong Chen3 March 15, 2009
Abstract Measuring and forecasting volatility of asset returns is very important for asset trading and risk management. There are various forms of volatility estimates, including implied volatility, realized volatility and volatility assumed under stochastic volatility models and GARCH models. Research has shown that these different methods are closely related but have different perspectives, strength and weakness. In order to exploit their connections and take advantage of their different strength, in this paper, we propose to jointly model them with a vector fractionally integrated autoregressive and moving average (VARFIMA) model. The model is also used for forecasting purpose. In addition, we investigate the impacts of the two realized volatility estimators obtained from intradaily high frequency data on the forecasts of return volatility. Our methods are applied to five individual stocks and forecasting performances are compared with those from a GARCH(1,1) model and a basic stochastic volatility (SV) model and their extended versions. The proposed VARFIMA model outperforms other volatility forecasting models in this study. Our results show that including the two different realized volatility estimators obtained from the intradaily high frequency data in the VARFIMA model imposes significant impacts on the forecasting precision for return volatility. 1 Corresponding Author. Department of Economics, Finance, and Decision Sciences, School of Business, University of North Carolina at Pembroke, One University Drive, Pembroke, NC 28372. e-mail:
[email protected] 2 Department of Finance, College of Business Administration, University of Illinois at Chicago, 601 South Morgan Street, MC 294, Chicago, IL 60607. e-mail:
[email protected] 3 Department of Statistics, Rutgers University, Piscataway, NJ 08854. e-mail:
[email protected]
1
KEY WORDS: Intra-daily high frequency data; Microstructure noise; Return volatility forecasting; Vector ARFIMA model.
1
Introduction
Modelling and forecasting the return volatility of financial assets have drawn significant attention from both academia and financial industry due to its importance in asset pricing, volatility-related derivative trading, and risk management. However, volatility cannot be directly measured and has to be inferred from the underlying asset returns or the option prices observed in the market. Various models and methods have been developed for measuring volatility, based on available data and assumptions. Among them, there are four major types of measures and their extensions. Implied volatility (IV) is the volatility implied by the observed option prices of the asset, based on a theoretical option pricing model, for example, the seminal Black-Scholes-Merton model (Black and Scholes, 1973a; Merton, 1973) or its various extensions including Black (1976), Cox et al. (1979), and Hull and White (1987), among many others. Realized volatility (RV) uses intra-daily high frequency data to directly measure the volatility under a general semimartingale model setting, using different subsampling methods (Andersen and Bollerslev, 1998; Andersen et al., 2001; BarndorffNielsen and Shephard, 2002; Dacorogna et al., 2001; Zhang et al., 2005; BarndorffNielsen et al., 2008). The Autoregressive Conditional Heteroscedasticity model (ARCH) by Engle (1982) and the generalized ARCH model (GARCH) by Bollerslev (1986) assess latent volatility process based on the return series of a financial asset, assuming a deterministic relationship between the current volatility with its past and other variables. The stochastic volatility model (SV) extends the ARCH/GARCH model by including randomness in the inter-temporal relationship of the volatility process. For a sample
2
of literature on this topic, see Hull and White (1987), Scott (1987), and Wiggins (1987). In addition, Bollerslev et al. (1994), Ghysels et al. (1995), and Shephard (1996) provide reviews on ARCH/GARCH-type and stochastic volatility models. The aforementioned approaches provide closely related but different volatility measures. Each of them have their strength and weakness. On the one hand, both ARCH/GARCH-type and SV models successfully capture the temporal dependence in the volatility process. However, they cannot accommodate the intra-daily variability in the asset returns and tend to have poor forecast for ex-post squared returns over a day or longer time horizon. In contrast, by construction, daily realized volatility naturally contains the information about the intra-day variations which ARCH/ARCH lacks. The realized volatility by itself, however, cannot tell us the inter-temporal dependence of the volatility process across days or longer horizon. Finally, implied volatility cannot directly measure the variability of an underlying asset returns, it does reflect, to some degree, the (options) market’s expectations on the asset volatility. In order to exploit the relationship of different volatility measures and take advantage of their strength, in this paper we first investigate the characteristics of the volatility measures from the four approaches. Our study shows that the relationship between the measures are closer than previously recognized in the literature, with no apparent leading terms. Such an observation indicates a joint vector modelling approach, instead of a transfer function type of modelling in which one variable is the output and others are input. In addition, all of these four volatility measures display certain long memory characteristic. The above preliminary findings provide the motivation of modelling the volatility measures jointly using a vector time series model. We consider two groups of measures: one including GARCH(1,1) volatility, realized volatility and implied volatility (model I), and the other including the SV volatility, realized volatility and implied volatility (model II). To capture the long memory characteristics of the volatility processes, a vector fractional integrated ARMA model (VARFIMA) is used. Fore3
casting performance comparison is then carried out with real data. It shows that the proposed model indeed produces improved forecasting performances. It is noted that the long memory behavior of the volatility process can also be modeled by a regime switching process (Hidalgo and Robinson, 1996) but it is beyond the scope of this paper. It is important to mention that there are studies that combine different volatility measures for better modelling and forecasting performance. For example, Andersen et al. (2003) found that by incorporating the realized volatility measure based on fiveminute returns, volatility forecast improved over the conventional GARCH forecast. Our current paper adopts an improved measure of realized volatility, called two-scale realized volatility (TSRV, Zhang et al. (2005)). TSRV is computed from tick-bytick intra-day returns – a much denser and richer returns series – and it corrects the bias from the market microstructure noise which is typically present in the high frequency data. The enhanced accuracy in TSRV over conventional RV should provide further improvement in volatility forecast. Also in the literature, by introducing lagged realized volatility and implied volatility in the basic GARCH and SV models, Koopman et al. (2005) found that the inclusion of realized volatility in GARCH improved the forecasting of the daily return volatility, whereas the incorporation of implied volatility in GARCH and SV model helped very little. Different from Koopman et al. (2005), we model the volatility measures jointly and thus are able to capture the long memory characteristics of the process. The rest of the paper is organized as follows. Section 2 provides some preliminaries, including details of the volatility measures used in the paper, a description of the data set used in our study and some findings on the structures and relationships of the measures. Section 3 introduces a VARFIMA model for the volatility measures and provides details on the model estimation approach. Section 4 compares the one-day and five-day ahead out-of-sample return volatility forecasts using the proposed model with some existing volatility forecasting models. Section 5 contains a brief conclusion 4
and remarks.
2
Preliminaries
2.1
Volatility Measures
Our study focuses on four different daily volatility measures, namely implied volatility, realized volatility, volatility based on a GARCH model and that based on a stochastic volatility (SV) model. Details are as follows. (i) Implied Volatility Implied volatility (IV) of an underlying asset is the volatility implied from its option prices observed in the market. It is typically derived from calibrating a theoretical option pricing formula against the market price of the option. Because an option with different strike price (or expiration date) can yield a different IV, an IV index is often calculated from a weighted average of IVs of various options and serves as a representative IV measure in practice. We used IV index provided by IVolatility.com, where the weighting scheme takes into account of the delta and vega of each participating option. For basic concepts in options pricing, we refer to Hull (2008). (ii) Realized Volatility Realized volatility (RV), different from the implied volatility that conveys the market’s assessment of future volatility, measures the market’s historical volatility in the past. They are constructed by using intra-daily high frequency data. In this study we use two different versions with the intention to exploit their differences in forming volatility forecasts. Both of them assume that the logarithmic (efficient) prices of a financial asset follow a semi-martingale process. This rather general assumption is required by the no-arbitrage law in financial theory. Specifically, let G be a complete collection of the trading times in a day, G = {t0 , t1 , · · · , tn }, with t0 = 0 and tn = T . Let {ytj } be the logarithmic price of a financial asset observed at time tj , tj ∈ G. Also let H be a subset of G, with sample 5
size nsparse , nsparse ≤ n. The standard RV 2 , realized variance, is then calculated as the sum of the squared returns within that day: X
RV 2 =
(ytj,+ − ytj )2 ,
(1)
tj ,tj,+ ∈H
where tj and tj,+ are the adjacent elements in H, with tj < tj,+ . We obtain the standard RV by taking the square root of that in (1). In the absence of market microstructure in the data, conventional RV in (1) is a consistent estimator of the daily variation of returns, as the sampling interval shrinks (Jacod and Protter, 1998). However, empirical studies suggest that market microstructure noise is prevalent in high frequency data (Andersen and Bollerslev, 1998; Dacorogna et al., 2001). As prices are sampled at finer interval, microstructure noise becomes progressively dominant and as a consequence, RV becomes increasingly unreliable with a bias inversely proportional to the sampling interval length (Zhang et al., 2005). In the empirical finance literature, the sampling period is typically equal to or larger than 5 minutes in order to reduce the impact of microstructure noise. Following this literature, we choose five-minute sampling intervals to compute the daily RV measure using the intra-daily high frequency data. Zhang et al. (2005) proposed an approach to correct the microstructure bias by combining the RV estimators from two different time scales, resulting in two-scale realized volatility (TSRV). Specifically, TSRV is obtained by taking the square root of the two-scale realized variance, which is calculated as: T SRV 2 = (1 −
where n ¯=
n−K+1 K
´ n ¯ −1 ³ n ¯ ) RVK2 − RV12 n n
(2)
and RVK2 =
1 K
X tj ,tj+K ∈G
6
(ytj+K − ytj )2 .
(3)
RV12 is a special case of (3) with K = 1. Note that RVK2 is the realized variance based on sampling every K-th price while RV12 is the RV based on all available prices in G. Our preliminary analysis show that the estimated TSRVs are fairly robust to the choice of K, especially when K is equal to or greater than 200. We choose K = 200 in our calculation. (iii) GARCH Model and Its Extensions Generalized autoregressive conditional heteroscedasticity (GARCH) model was proposed by Bollerslev (1986). A GARCH(p,q) model assumes a form of: yt = σt εt , σt2
= α0 +
t = 1, . . . , T 2 α1 yt−1
+ ··· +
(4) 2 αp yt−p
+
2 β1 σt−1
+ ··· +
2 βq σt−q
where yt is the daily de-meaned returns of a financial asset, σt the instantaneous volatility of the return process at time t, p the order of the ARCH term, q the order of the GARCH term. This model successfully describes most of the recognized stylized features in asset return series, as mentioned in Section 1. A GARCH model can be extended by including realized volatility (RV or TSRV) and implied volatility (IV) in the variance equation, as follows, yt = σt εt , σt2
= α0 +
t = 1, . . . , T p X i=1
2 αi yt−i
+
q X
2 βj σt−j
+
j=1
m X
2 φk RVt−k
k=1
+ ··· +
n X
2 γl IVt−l .
(5)
l=1
Estimation of the above models can be done through maximum likelihood estimation (Doornik and Ooms, 2003; Laurent and Peters, 2006). In Section 4 where forecasting performance is evaluated, we also consider a different type of extension to GARCH(1,1), namely, the fractional integrated GARCH(1,1) (FIGARCH(1,1)) model (Baillie et al., 1996). This model is able to capture long memory property in the return volatility. The general form of a FIGARCH model can be written as: 7
yt = σt εt , σt2
t = 1, . . . , T
= α0 [1 −
q X
j −1
βj B ]
¸ · q p X X i d j −1 + 1 − [1 − βj B ] αi B (1 − B) ε2t
j=1
(6)
i=1
j=1
where yt is the demeaned returns, εt follows an i.i.d. standard normal distribution and B is the backshift operators defined as: Bxt = xt−1 . The fractional differencing parameter d is a non-integer real number. Similar to GARCH model and its extensions, a FIGARCH model can be estimated using the maximum likelihood method, and the G@rch package (Laurent and Peters, 2006) in Ox software is employed for estimation and forecasting procedures in this study. (4) Stochastic Volatility Model and Its Extensions A basic stochastic volatility (SV) model (Taylor, 1986) is in a form of:
yt = σt εt , σt2 = exp(ht ), ht = µ + ϕht−1 + ση ηt ,
(7)
where yt and σt2 are the de-meaned returns of a financial asset and its instantaneous variance, respectively, at time t. The noise processes εt and ηt are independent and follow i.i.d. standard normal distributions. The logarithm of the instantaneous variance ht has a persistence parameter ϕ, which is positive and takes a value less than 1. Similar to Koopman et al. (2005), we extend SV model to include realized volatility and/or implied volatility as follows:
yt = σt εt ,
σt2 = exp(ht ),
ht = µ + ϕht−1 +
M X
2 ) pi log(RVt−i
i=1
+
N X
2 ) qj log(IVt−j
(8) + ση ηt ,
j=1
where M and N represent the maximum lags of realized volatility (RV or TSRV) and 8
implied volatility (IV), respectively. Gibbs sampler is used for estimating the SV-type models, as well as for obtaining predictions. In each case, 50,000 samples are generated, with 2,000 burn-in samples.
2.2
Data
For our empirical study, we use five individual stocks traded in the New York Stock Exchange (NYSE), namely Microsoft (MSFT), Citi (C), Disney (DIS), Pfizer (PFE), and General Electric (GE). All of them are highly liquid, representing five different industries. The time period considered is from January 2, 2001 to December 31, 2003, with 752 daily observations in total for each series. Intra-daily high frequency return data are also obtained in this period. The daily return data set and the intra-day high frequency data set are downloaded from Wharton Research Database Services (WRDS). The intra-daily high frequency data is the consolidated trades in the NYSE’s TAQ database. When constructing the daily realized volatility (RV and TSRV) with the intra-day high frequency data set, we remove those prices with more than 1% bounceback, defined as |yti − yti−1 | > 1% and |yti +1 − yti | > 1% in additional to the conditions that the consecutive returns yti − yti−1 and yti +1 − yti hold opposite signs. Such incidents are often due to data recording errors.
2.3
Characteristics and Relationship of the Volatility Measures
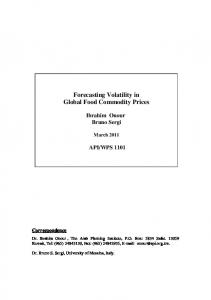
When exploring the characteristics of different volatility measures, we used the implied volatility series published in www.Ivolatility.com, the estimated daily realized volatilities RV and TSRV, and the instantaneous daily volatility measures under GARCH(1,1) and basic SV model for the five stocks. Our findings for the five stocks are similar, so we only report that of Microsoft. Figure 1 shows the autocorrelation
9
functions of four MSFT volatility series. The ACF plot of RV is omitted since it is quite similar to TSRV. From Figure 1, all the volatility measures have strong and persistent autocorrelations, an evidence for the volatility clustering phenomenon. ACF of the Volatility from Basic SV Model
0.8
0.8
0.6
0.6
Sample Autocorrelation
Sample Autocorrelation
ACF of the Volatility from GARCH(1,1) Model
0.4
0.4
0.2
0.2
0
0
−0.2
0
5
10
15
20
25 Lag
30
35
40
45
−0.2
50
0
5
10
15
(a) GARCH(1,1)
0.6
0.6
Sample Autocorrelation
Sample Autocorrelation
0.8
0.4
0.2
0
0
10
15
20
25 Lag
30
35
40
45
50
35
40
45
50
0.4
0.2
5
30
ACF of the Implied Volatility
0.8
0
25 Lag
(b) SV
ACF of the Two−Scale Realized Volatility
−0.2
20
35
40
45
−0.2
50
(c) TSRV
0
5
10
15
20
25 Lag
30
(d) IV
Figure 1: Estimated Autocorrelations of the Four Volatility Measures of Microsoft In order to investigate the relationship between the four different volatility measures, Figure 2 presents their cross-correlation functions. It is evident that strong cross-correlation exists in each pair of the volatility measures. Within 20 leads/lags, the cross-correlations between any two volatility measures are at least 0.4. The maximum correlation between TSRV and other measures does not occur at lag zero, instead, a lagged TSRV seems to have strong cross-correlation with other volatility measures. Both theoretical and empirical literature have documented long-memory volatility property. Early work in this area includes Robinson (1991) and Ding et al. (1993). This long-range dependence in volatility process can often be characterized by certain fractional integration models where a fractional integrated process xt of order d can be transformed into a stationary process via fractional differencing. As its name suggests, 10
Cross−correlation between the Volatility from GARCH(1,1) Model and Realized Volatility
0.9
0.8
0.8
0.7
0.7
Sample Cross Correlation
Sample Cross Correlation
Cross−correlation between the Volatilities from GARCH(1,1) and Basic SV Models
0.9
0.6 0.5 0.4 0.3
0.6 0.5 0.4 0.3
0.2
0.2
0.1
0.1
0 −0.1 −50
0
−40
−30
−20
−10
0 Lag
10
20
30
40
−0.1 −50
50
−40
(a) GARCH(1,1) vs. SV
0.8
0.7
0.7
Sample Cross Correlation
Sample Cross Correlation
0.9
0.8
0.6 0.5 0.4 0.3
0 Lag
10
20
30
40
50
0.6 0.5 0.4 0.3
0.2
0.2
0.1
0.1
0
0
−40
−30
−20
−10
0 Lag
10
20
30
40
−0.1 −50
50
−40
−30
(c) GARCH(1,1) vs. IV
−20
−10
0 Lag
10
20
30
40
50
40
50
(d) SV vs. TSRV
Cross−correlation between the Volatility from Basic SV Model and Implied Volatility
Cross−correlation between the Realized Volatility and the Implied Volatility
0.9
0.9
0.8
0.8
0.7
0.7
Sample Cross Correlation
Sample Cross Correlation
−10
Cross−correlation between the Volatility from Basic SV Model and Realized Volatility
0.9
0.6 0.5 0.4 0.3
0.6 0.5 0.4 0.3
0.2
0.2
0.1
0.1
0 −0.1 −50
−20
(b) GARCH(1,1) vs. TSRV
Cross−correlation between the Volatility from GARCH(1,1) Model and Implied Volatility
−0.1 −50
−30
0
−40
−30
−20
−10
0 Lag
10
20
30
40
−0.1 −50
50
(e) SV vs. IV
−40
−30
−20
−10
0 Lag
10
20
30
(f) TSRV vs. IV
Figure 2: Estimated Cross-correlations of the Four Volatility Measures of Microsoft. In each figure, the first volatility measure leads the second one when the lags are positive; the second volatility measure leads the first one when the lags are negative
11
the differencing parameter d is a non-integer real number. We apply the long memory R/S test proposed by Lo (1991) to each of the volatility processes, using 20 as the bandwidth for the cross variance. We also obtain the GPH fractional differencing estimator d using the methodology proposed by Geweke and Porter-Hudak (1983). Tables 1 and 2 present the R/S statistics and the GPH estimates, respectively, for each of the five stocks’ volatility measures. Table 1: R/S Statistics of the Volatility Measures Series Citi Disney GE Microsoft Pfizer
GARCHVol 1.8990 1.9303 1.8226 1.7735 1.8776
SVVol 1.9504 1.9084 2.0640 1.9458 1.9794
RVol 2.0244 2.0403 1.9264 1.9229 1.8238
TSRVol 1.9799 2.0138 1.9407 1.8358 1.9628
ImpVol 1.9231 1.9872 1.8845 1.8714 1.8765
Table 2: GPH Estimators of Fractional Differencing Parameters Series Citi Disney GE Microsoft Pfizer
GARCHVol 1.0159 (0.0467) 0.7923 (0.0540) 0.8664 (0.0492) 0.9299 (0.0497) 0.9519 (0.0512)
SVVol 1.0935 (0.0328) 1.0165 (0.0285) 0.9730 (0.0253) 0.9934 (0.0227) 1.0916 (0.0282)
RVol 0.5367 (0.0479) 0.4770 (0.0464) 0.5023 (0.0438) 0.5538 (0.0429) 0.4922 (0.0502)
TSVol 0.6441 (0.0570) 0.5180 (0.0527) 0.5173 (0.0494) 0.6082 (0.0465) 0.5221 (0.0474)
ImpVol 0.7538 (0.0510) 0.7029 (0.0503) 0.6589 (0.0473) 0.7864 (0.0506) 0.7970 (0.0512)
Table 1 shows that all of the R/S statistics are significant at 0.05 level, with critical value 1.747, thus suggesting all four volatility measures exhibit fractional integration characteristics. In Table 2, the GPH estimates of the fractional differencing parameters are listed, where the values in the parentheses are standard deviations corresponding to each of the GPH estimates. The GPH estimates show that, although 12
the different volatility measures are of long memory, the extent of fractional integration varies for different volatility measures. The GPH estimates for GARCH(1,1) volatility and basic SV volatility are larger than those of realized volatilities (RV and TSRV), while the estimate for implied volatility lies in between. This pattern holds for all the five individual stocks.
3
A Vector ARFIMA(p,d,q) Model for Volatility Series
The empirical evidence in Section 2 suggests that fractional integration patterns exist in all the volatility series and the volatility measures have strong short-term and longterm cross-correlations. The extensions of GARCH and SV models in the literature, as cited in Section 1, either do not incorporate the rich information from the ultrahigh-frequency returns with microstructure noise correction, or fail to capture the long memory property in the return volatilities. As a consequence, the forecasting performance from these models is limited. We propose to model GARCH and SV return volatility jointly with realized volatility and implied volatility, using a vector fractionally integrated autoregressive and moving average model (VARFIMA). This model is able to capture the long memory characteristic property of the individual volatility measure, as well as the interactive relationship between each other. We will allow different differencing parameter d’s to reflect different degrees of fractional integration among the volatility measures. Without losing generality, a VARFIMA(p,d,q) model may be expressed as:
Φ(B)M(B)y t = Θ(B)εt
(9)
where y t is a de-meaned k × 1 vector consisting of k time series at time t. Here we assume M(B) to be a k×k diagonal matrix with diagonal elements being (1−B)d1 , (1−
13
B)d2 , . . . , (1 − B)dk where di is the fractional differencing parameter of ith dimension. In addition, Φ(B) = I − Φ1 B − · · · − Φp B p and Θ(B) = I − Θ1 B − · · · − Θq B q are matrix polynomials of order p and q of the backshift operator, respectively. The noise vector εt is assumed to be Gaussian with εt ∼ N ID(0, Σ). We implement two VARFIMA models in this paper with, both of three dimensional (k = 3): VARFIMA I : jointly models the GARCH(1,1) instantaneous volatility, realized volatility and implied volatility. VARFIMA II : jointly models the basic SV volatility, realized volatility, and implied volatility. In both cases, we use the standard RV or the TSRV for realized volatility and compare the impacts of these two realized volatility estimators on the volatility forecasts. The corresponding models are hence labelled as Model I-RV and I-TSRV and Model II-RV and II-TSRV, respectively. Maximum likelihood method is employed for model estimation. It is computationally intensive due to the nonlinearity in the fractional integration parameters d1 , d2 and d3 and the large number of parameters in coefficient matrices Φ(B) and Θ(B). Specifically we use a grid search for d1 , d2 , and d3 around the initial value of the GPH estimates of each individual univariate series, shown in Table 2. For each combination of grid values of (d1 , d2 , d3 ), its likelihood function value is obtained by estimating the corresponding VARFIMA(p,(d1 ,d2 ,d3 ),q) model. The optimal values of d1 , d2 , and d3 are those which generate the maximum likelihood value for the specified VARFIMA(p,q) model. Given optimal d1 , d2 , and d3 values, the rest of the parameters are estimated through a standard estimation procedure for vector ARM A model with refinements. Here we only report the results of Microsoft stock. Findings for other stocks show similar features and are omitted to avoid redundancy. Table 3 lists the estimates of d’s and the corresponding maximum likelihood values with different specifications 14
of p and q as well as their corresponding AIC (Akaike, 1969) values. In Table 3, dI,k , k = 1, 2, 3, are the estimated fractional differencing parameter corresponding to GARCH volatility, TSRV and implied volatility in the model I, respectively. Similarly, dII,k , k = 1, 2, 3 are those in the model II, respectively. Table 3: Estimation Results of the VARFIMA(p,(d1 , d2 , d3 ),q) Models Model VARFIMA(1,di ,0) VARFIMA(2,di ,0) VARFIMA(3,di ,0) VARFIMA(4,di ,0) VARFIMA(5,di ,0) VARFIMA(1,di ,1) VARFIMA(2,di ,1) VARFIMA(3,di ,1) VARFIMA(1,di ,2) VARFIMA(2,di ,2) VARFIMA(3,di ,2) VARFIMA(1,di ,3) VARFIMA(2,di ,3) VARFIMA(3,di ,3)
dˆI,1 0.91 0.90 0.98 0.92 1.02 0.88 1.09 0.96 1.03 0.89 0.93 0.90 0.97 1.01
dˆI,2 0.59 0.55 0.54 0.57 0.58 0.61 0.68 0.53 0.67 0.52 0.46 0.44 0.46 0.55
dˆI,3 0.81 0.84 0.85 0.83 0.86 0.76 0.90 0.77 0.86 0.73 0.72 0.71 0.75 0.81
M LI 10,364.00 10,368.24 10,373.11 10,376.89 10,378.20 10,373.90 10,393.29 10,381.09 10,378.27 10,376.39 10,391.55 10,383.09 10,396.42 10,393.87
AICI -36.79 -36.93 -37.03 -36.86 -36.92 -36.57 -37.18 -37.05 -36.86 -36.83 -37.04 -36.98 -37.13 -36.99
dˆII,1 0.96 0.92 0.96 0.95 0.99 0.93 0.98 0.96 0.99 0.92 0.95 0.92 0.97 1.03
dˆII,2 0.63 0.59 0.57 0.61 0.59 0.57 0.65 0.57 0.63 0.51 0.55 0.47 0.49 0.57
dˆII,3 0.86 0.85 0.89 0.83 0.88 0.89 0.91 0.82 0.85 0.76 0.68 0.77 0.71 0.85
M LII 10,733.43 10,738.27 10,741.03 10,743.95 10,747.21 10,744.95 10,753.92 10,749.10 10,746.73 10,745.39 10,749.51 10,746.25 10,750.44 10,748.99
AICII -37.92 -37.99 -37.99 -37.96 -38.03 -37.95 -38.26 -37.98 -37.96 -37.82 -37.99 -37.93 -37.93 -37.90
According to the AIC values in Table 3, the best model I is VARFIMA(2,(0.91, 0.59, 0.81),1) and the best model II is VARFIMA(2,(0.98, 0.65, 0.91),1). We can see that the orders p and q do have certain effect on the fractional integration order. To obtain more accurate coefficient estimation and to avoid model ambiguity often encountered in vector ARMA models (Tiao and Tsay, 1989; Tsay, 1989), we employ a coefficient-refining procedure with fixed di ’s to zero-out the insignificant coefficients in the AR and MA coefficient matrices. Specifically, with fixed di ’s, a backward elimination procedure is used to remove insignificant coefficients one at a time with models re-estimated iteratively, until all remaining coefficients are significant at 5% level. The estimated AR and MA coefficient matrices with their standard errors, as well as the estimated covariance matrix for the error term in our VARFIMA model, from both model I and II are given below. As is showed in the estimated coefficient matri15
ces, even though many of the coefficients are zeroed out due to their insignificance, the estimated significant coefficients do reflect the inter- and cross- correlation among the three different volatility measures in both model I and model II. Specifically, for model I, the non-zero lag-1 AR and MA coefficients are only related to realized volatility, except the MA(1) coefficient of the realized volatility itself. Hence it seems that the past observations of the realized volatility has more influences on all three volatility measures under Model I. In addition, the estimated noise covariance matrix shows that the noises in realized volatility series and implied volatility series have higher correlation than other two pairs. The structure of the coefficient matrices in Model II is very different from that in Model I, showing the difference between volatility measures based on GARCH models and SV models. However, the noises in realized volatility series and implied volatility series still have higher correlation than other two pairs in Model II, showing a constant pattern.
ˆ I,1 Φ
0 −0.08(0.03) 0.08(0.02) 0 0.21(0.06) 0 ˆ I,2 = ; ; Φ = 0 0 0 0 0 0.18(0.05) 0 −0.13(0.03) 0.29(0.06) 0 −0.55(0.14) 0
ˆ I,1 Θ
0 0 0.22(0.06) 0.20E-05 0.43E-06 0.86E-07 ˆ = 0 0.28(0.04) −0.50(0.07) ; ΣI = 0.43E-06 0.12E-04 0.20E-05 ; 0 −0.59(0.14) 0 0.86E-07 0.20E-05 0.30E-05 ˆ II,1 Φ
0 0 0.85(0.02) ; = 0 0 −0.82(0.35) 1.02(0.24) −0.38(0.10) 0
16
ˆ II,2 Φ
0 −0.005(0.002) 0 = 1.39(0.36) 0 0.26(0.07) ; 0 −0.07(0.03) 0.18(0.06)
−0.017(0.005) 0.50E-07 -0.25E-07 0.12E-07 ˆ II = -0.25E-07 0.12E-04 0.20E-05 . ; Σ 0 0.25(0.04) −1.31(0.35) 0.12E-07 0.20E-05 0.30E-05 0.88(0.33) −0.41(0.10) 0 0
0
ˆ II,1 Θ
=
4
Volatility Forecasting
The practical relevance of sophisticated volatility modelling to a large extent hinges on its forecasting performance. In practice, volatility forecasting is very important due to its close relation to asset pricing, derivatives’ pricing and trading, and risk management. For example, in derivative trading, volatility swap, volatility corridor and variance swap are traded in the over-the-counter market every day. Better forecasts of an asset’s return volatility can help practitioners gauge market trend and make a more intelligent trading decision. In risk management, reliable and longhorizon volatility forecasts make risk assessment and management feasible, both from regulators and financial institutions’ viewpoints. Based on an estimated VARFIMA(p,d,q) model for the volatility series, we can obtain volatility forecast through standard methods. Specifically, based on model (9), we have:
y t+` = (I − M(B))y t+` + Φ1 M(B)y t−1+` + . . . + Φp M(B)y t−p+` + Θ(B)εt+` (10) where I is a k × k identity matrix. Note that the expression (I − M(B))y t+` does ˆ t+` can be not involve y t+` . By taking expectations on both sides, the predictor y
17
easily obtained (Box et al., 2008) through the following rules: E(y t+j ) = y t+j for ˆ t (j) for 0 < j ≤ `, where y ˆ t (j) represents the j-step ahead j ≤ 0, E(y t+j ) = y ˆ t at time t; E(εt+j ) = 0 for j > 0, and E(εt+j ) = ε ˆt+j for j ≤ 0 (the forecasted y ∞ P Γ(−d+k) estimated residuals), and (1 − B)d = 1 + B k is approximated by the Γ(−d)Γ(k+1) k=1
finite summation using only available data. We shall compare the forecasting power of different volatility models, including VARFIMA I, VARFIMA II (the number of dimension is k = 3), as well as the GARCH(1,1) and basic SV model together with their extensions as specified in Section 2. Note that for model VARFIMA I, we evaluate the forecasting performance of the GARCH volatility, and for model VARFIMA II, we evaluate the forecasting performance of the SV volatility. It is well known that the microstructure noise is prominent in the intra-daily high frequency data, hence presents a concern in estimating the daily realized volatility. Since the TSRV is constructed to remove the effect of the microstructure noise on volatility estimation, we shall be particularly interested in the impacts of including RV versus TSRV on our VARFIMA(p,d,q) forecasts. We focus on one-day and five-day forecasts of return volatility, which are widely followed in practice, to investigate the forecasting power of our approach. Specifically, we perform out-of-sample rolling forecasting with a total of 251 one-day and five-day ahead daily forecasts, where the out-of-sample period is from 12/31/2002 to 12/31/2003. In the forecasting procedure, we fix the fractional differencing parameters di where i = 1, 2, 3 by using the estimated di ’s in our VARFIMA model I and II from the procedures introduced in Section 3, and then exact maximum likelihood estimates on all AR and MA parameters in the model are obtained in each of the rolling windows, and the one-day and five-day ahead forecasts for the return volatility are made based on the fitted model accordingly. Following the results in Section 3, we employ a V ARF IM A(2, d, 1) model for both model VARFIMA I and VARFIMA II here. 18
In addition, we also obtained out-of-sample one-day ahead and five-day ahead volatility forecasts using the basic GARCH(1,1) and SV model, as well as the extend GARCH and SV models expressed in (2) and (4) with lag-1 realized volatility and implied volatility included in the variance and log-variance equations, respectively. Furthermore, we derived the volatility forecasts from the FIGARCH(1,1) model. Whenever realized volatility is involved, both RV and TSRV are considered. Following Andersen and Bollerslev (1998), we treat the daily realized volatility obtained from the intra-daily high frequency data as the true return volatility. Specifically we use the daily TSRV, instead of the standard RV, as the benchmark of the daily return volatility, as TSRV is a more precise estimator (Zhang et al., 2005). To evaluate the forecasting performance of different models, we used three criteria: regression R2 , heteroscedasticity-adjusted root mean squared error (HRMSE), and heteroscedasticity-adjusted mean absolute error (HMAE). Specifically, Goodness-offit measured by R2 is obtained by regressing the volatility benchmark σ ˜t2 – in our case, TSRV – against the volatility forecast σ ˆt2 within the same time horizon. The R2 is obtained using the OLS approach: σ ˜t2 = α + β σ ˆt2 + ²t .
(11)
A higher R2 suggests a higher proportion of the variation in the benchmark can be explained by the volatility forecast. HRMSE is computed as: v u u HRM SE = t
!2 Ã M σ ˆj2 1 X 1− 2 M − ` j=1 σ ˜j
(12)
where M is the total number of the forecasts, ` = 1 or 5 depending on whether the forecast is one-day or five day ahead. Again, σ ˜t and σ ˆt are the benchmark TSRV and volatility forecast on day t, respectively. Different from the R2 measure, HRMSE measures the local fluctuations of the forecasted return volatility from the benchmark.
19
HMAE is similar to HRMSE except that it uses mean absolute error. It is defined as: ¯ M ¯ σ ˆj2 ¯ 1 X ¯¯ HM AE = 1 − 2 ¯¯ M − ` j=1 ¯ σ ˜j
(13)
Tables 4 and 5 compare the one-day-ahead and five-day-ahead forecasting performance, using all five stocks. Column A indicates whether standard RV or TSRV is used as a representative for realized volatility in different forecasting models (Columns C-I). Column B is about different forecasting evaluation criteria. For both one-day forecasts (Table 4) and five-day forecasts (Table 5), the VARFIMA models outperform the other models, yielding the highest R2 ’s and lowest HRMSE’s and HMAE’s for most of the stocks under consideration. In particular, one-day-ahead VARFIMA volatility forecasts can explain 55.1%-66.8% of the variation (R2 ) in the benchmark σ ˜t2 , while five-day-ahead forecasts explain 35.1%-40.4% of such variation, across stocks. For each evaluation criteria in Column B, the incremental improvement in the forecast performance has a clear pattern across models. First, extended GARCH forecast (Column G) outperforms basic GARCH forecast (Column E), indicating that realized volatility and implied volatility bring in additional information in the GARCH forecast. Similarly, extended SV (Column H) has better forecasting power than basic SV (Column F). Second, the capability of capturing long-memory characteristic in volatility measure helps the forecasting. This is evident from the superior forecast of FIGARCH (Column I) over extended GARCH model (Column G). Also, the VARFIMA II (Column D) forecasts perform much better than the extended SV forecast. Third, overall enhancement in the forecast performance from FIGARCH to VARFIMA I (Column C) seems to indicate that joint modelling of the dynamic relations between different volatility measures has a gain. And finally, for any given volatility model, using the TSRV instead of the standard RV as the realized volatility estimator consistently improves the forecasting. This could be caused by two reasons: one is that TSRV is constructed from a much richer return series (i.e.
20
21
Pfizer: RV
Pfizer: T SRV
Microsoft: RV
Microsoft: T SRV
GE: RV
GE: T SRV
Disney: RV
Disney: T SRV
Citi: RV
Citi: T SRV
A
R2 HRM SE HM AE R2 HRM SE HM AE R2 HRM SE HM AE R2 HRM SE HM AE R2 HRM SE HM AE R2 HRM SE HM AE R2 HRM SE HM AE R2 HRM SE HM AE R2 HRM SE HM AE R2 HRM SE HM AE
B
C V ARF IM A I 0.642 0.315 0.293 0.561 0.357 0.322 0.625 0.332 0.309 0.557 0.348 0.335 0.626 0.331 0.304 0.565 0.353 0.333 0.623 0.339 0.309 0.570 0.348 0.327 0.660 0.325 0.298 0.577 0.337 0.317
D V ARF IM A II 0.652 0.310 0.289 0.579 0.348 0.318 0.618 0.337 0.319 0.551 0.353 0.338 0.633 0.323 0.297 0.578 0.348 0.319 0.631 0.328 0.302 0.581 0.339 0.311 0.668 0.309 0.297 0.585 0.331 0.308
E GARCH 0.449 0.393 0.376 0.388 0.425 0.390 0.437 0.409 0.383 0.359 0.436 0.398 0.442 0.394 0.378 0.370 0.430 0.387 0.451 0.388 0.367 0.382 0.419 0.380 0.463 0.379 0.350 0.398 0.405 0.368
F SV 0.471 0.385 0.371 0.392 0.409 0.384 0.441 0.402 0.391 0.355 0.443 0.403 0.450 0.389 0.370 0.383 0.425 0.381 0.459 0.379 0.359 0.389 0.413 0.373 0.471 0.370 0.343 0.402 0.400 0.360
G GARCH + RV + IV 0.535 0.341 0.327 0.441 0.376 0.350 0.530 0.347 0.332 0.438 0.385 0.357 0.537 0.340 0.328 0.443 0.379 0.350 0.543 0.332 0.317 0.448 0.368 0.340 0.557 0.325 0.304 0.469 0.357 0.330
H SV + RV + IV 0.540 0.335 0.323 0.445 0.382 0.345 0.537 0.338 0.326 0.440 0.380 0.353 0.543 0.334 0.319 0.450 0.371 0.345 0.549 0.328 0.311 0.453 0.360 0.338 0.563 0.318 0.299 0.481 0.350 0.323
Table 4: Evaluation of One-day Ahead Return Volatility Forecasting Performance I F IGARCH 0.573 0.321 0.307 0.509 0.361 0.333 0.562 0.334 0.319 0.500 0.366 0.331 0.573 0.328 0.311 0.507 0.355 0.325 0.585 0.319 0.307 0.519 0.348 0.316 0.593 0.308 0.290 0.535 0.331 0.301
22
Pfizer: RV
Pfizer: T SRV
Microsoft: RV
Microsoft: T SRV
GE: RV
GE: T SRV
Disney: RV
Disney: T SRV
Citi: RV
Citi: T SRV
A
R2 HRM SE HM AE R2 HRM SE HM AE R2 HRM SE HM AE R2 HRM SE HM AE R2 HRM SE HM AE R2 HRM SE HM AE R2 HRM SE HM AE R2 HRM SE HM AE R2 HRM SE HM AE R2 HRM SE HM AE
B
C V ARF IM A I 0.395 0.497 0.462 0.371 0.543 0.504 0.380 0.509 0.468 0.352 0.535 0.510 0.399 0.497 0.459 0.360 0.529 0.491 0.390 0.520 0.470 0.365 0.545 0.511 0.397 0.503 0.468 0.370 0.538 0.512
D V ARF IM A II 0.392 0.500 0.469 0.374 0.536 0.496 0.400 0.508 0.471 0.351 0.529 0.513 0.404 0.499 0.461 0.369 0.518 0.492 0.385 0.523 0.471 0.378 0.535 0.503 0.402 0.498 0.463 0.377 0.531 0.512
E GARCH 0.201 0.639 0.582 0.177 0.650 0.610 0.194 0.643 0.595 0.181 0.649 0.603 0.206 0.633 0.580 0.186 0.640 0.594 0.196 0.637 0.606 0.182 0.653 0.608 0.207 0.624 0.592 0.193 0.638 0.613
F SV 0.189 0.660 0.594 0.170 0.673 0.618 0.199 0.638 0.590 0.186 0.645 0.597 0.213 0.625 0.572 0.190 0.640 0.588 0.193 0.643 0.613 0.177 0.664 0.619 0.213 0.616 0.589 0.200 0.633 0.602
G GARCH + RV + IV 0.225 0.579 0.560 0.202 0.585 0.549 0.233 0.570 0.552 0.207 0.591 0.573 0.241 0.563 0.544 0.212 0.579 0.560 0.233 0.581 0.552 0.207 0.589 0.573 0.238 0.575 0.550 0.215 0.581 0.568
H SV + RV + IV 0.231 0.568 0.552 0.206 0.579 0.544 0.239 0.563 0.543 0.214 0.580 0.565 0.249 0.558 0.538 0.215 0.573 0.553 0.228 0.589 0.548 0.201 0.594 0.577 0.245 0.569 0.541 0.219 0.573 0.560
Table 5: Evaluation of Five-day Ahead Return Volatility Forecasting Performance I F IGARCH 0.297 0.525 0.507 0.271 0.548 0.513 0.313 0.517 0.498 0.296 0.523 0.501 0.324 0.503 0.489 0.305 0.511 0.493 0.319 0.519 0.497 0.301 0.523 0.505 0.334 0.504 0.490 0.315 0.509 0.498
tick-by-tick data) whereas the standard RV is calculated from a sparse return series (i.e. five-minute returns), the other reason is that TSRV is a more precise volatility measure in the sense that it corrects the bias from the microstructure noise whereas standard RV is vulnerable to the microstructure noise in the high frequency data.
5
Conclusions
In this study, we proposed a vector ARFIMA model to capture the long memory and cross-correlation of different volatility measures of a financial return series. The volatility measures involved in our VARFIMA model are the volatility generated from the GARCH(1,1) model, the volatility generated from the basic SV model, two realized volatility estimators (RV and TSRV) constructed from intra-daily high frequency data set, and the implied volatility. In an out-of-sample forecasting comparison, the proposed vector model outperforms some existing volatility models in the literature, including GARCH(1,1) and its extension, basic SV and its extension, as well as FIGARCH(1,1). Our VARFIMA model has three attractive features: (a) it successfully captures the long memory properties in the volatility process; (b) it incorporates richer information from options market (through implied volatility) and from intra-daily tick-by-tick data (through TSRV), meanwhile it is shielded from the microstructure noise in the intra-daily data; and (c) it jointly models the dynamic inter-day relations between different volatility measures. Our data analysis suggests that all above features contribute to a better volatility forecast.
References Akaike, H. (1969). Fitting autoregression models for prediction. Annals of the Institute of Statistical Mathematics, 21:243–247. Andersen, T. G. and Bollerslev, T. (1998). Answering the skeptics: Yes, standard 23
volatility models do provide accurate forecasts. International Economic Review, 39:885–905. Andersen, T. G., Bollerslev, T., Diebold, F. X., and Labys, P. (2001). The distribution of exchange rate realized volatility. Journal of the American Statistical Association, 96:42–55. Andersen, T. G., Bollerslev, T., Diebold, F. X., and Labys, P. (2003). Modeling and forecasting realized volatility. Econometrica, 71:579–625. Baillie, R., Bollerslev, T., and Mikkelsen, H. (1996). Fractionally integrated generalized autoregressive conditional heteroskedasticity. Journal of Econometrics, 74:3–30. Barndorff-Nielsen, O. E., Hansen, P. R., Lunde, A., and Shephard, N. (2008). Designing realized kernels to measure ex-post variation of equity prices in the presence of noise. econometrica, 76. Barndorff-Nielsen, O. E. and Shephard, N. (2002). Econometric analysis of realized volatility and its use in estimating stochastic volatility methods. Journal of Royal Statistical Society, B, 64:253–280. Black, F. (1976). The pricing of commodity contracts. Journal of Financial Economics, 3:167–179. Black, F. and Scholes, M. (1973a). The pricing of options and corporate liabilities. Journal of Political Economy, 81:637–654. Black, F. and Scholes, M. (1973b). The pricing of options and corporate liabilities. Journal of Political Economy, 81:637–654. Bollerslev, T. (1986). Generalized autoregressive conditional heteroskedasticity. Journal of Econometrics, 31:307–327.
24
Bollerslev, T., Engle, R., and Nelson, D. (1994). Arch models. In Engle, R. and McFadden, D., editors, Handbook of Econometrics, volume IV. North Holland Press, Amsterdam. Box, G., Jenkins, G., and Reinsel, G. (2008). Time series analysis: Forecasting and control. Wiley, New York, fourth edition. Cox, J., Ross, S., and Rubinstein, M. (1979). Option pricing: A simplified approach. Journal of Financial Economics, 7:229–263. Dacorogna, M. M., Gen¸cay, R., M¨ uller, U., Olsen, R. B., and Pictet, O. V. (2001). An Introduction to High-Frequency Finance. Academic Press, San Diego. Ding, Z., Granger, C. W., and Engle, R. F. (1993). A long memory property of stock market returns and a new model markets. Journal of Empirical Finance, 1:83–106. Doornik, J. and Ooms, M. (2003). Computational aspects of maximum likelihood estimation of autoregressive fractionally integrated moving average models. Computational Statistics and Data Analysis, 42:333–348. Engle, R. F. (1982). Autoregressive conditional heteroskedasticity with estimates of variance of the u.k. inflation. Econometrica, 50:987–1008. Fan, J. and Wang, Y. (2007). Multi-scale jump and volatility analysis for highfrequency financial data. Journal of American Statistical Association, 102:1349– 1362. Geweke, J. and Porter-Hudak, S. (1983). The estimation and application of long memory time series models. Journal of Time Series Analysis, 4:221–238. Ghysels, E., Harvey, A., and Renault, E. (1995). Stochastic volatility. In Maddala, G. and Rao, C., editors, Handbook of Statistics 14, Statistical Methods in Finance. North Holland Press, Amsterdam.
25
Hidalgo, J. and Robinson, P. M. (1996). Testing for structual change in a long-memory environment. Journal of Econometrics, 70:159–174. Hull, J. (2008). Options, Futures, and Other Derivatives. Prentice Hall, India, seven edition. Hull, J. and White, A. (1987). The pricing of options on assets with stochastic volatilities. Journal of Finance, 42:281–300. Jacod, J. and Protter, P. (1998). Asymptotic error distributions for the euler method for stochastic differential equations. Annals of Probability, 26:267–307. Koopman, S., Jungbacker, B., and Hol, E. (2005). Forecasting daily variability of the s & p 100 stock index using historical, realized and implied volatility measurements. Journal of Empirical Finance, 12. Laurent, S. and Peters, J. P. (2006). G@RCH 4.2, Estimating and Forecasting ARCH Models. Timberlake Consultants Press, London. Lo, A. (1991). Long-term memory in stock market prices. Econometrica, 59:1279– 1313. Merton, R. C. (1973). The theory of rational option pricing. Bell Journal of Economics and Management Science, 4:141–183. Robinson, P. M. (1991). Testing for strong serial correlation and dynamic conditional heteroskedasticity in multiple regression. Journal of Econometrics, 47:67–84. Scott, L. O. (1987). Option pricing when the variance changes randomly: Theory, estimation, and an application. Journal of Financial and Quantitative Analysis, 22:419–438. Shephard, N. (1996). Statistical aspects of arch and stochastic volatility. In D.R.Cox,
26
Hinkley, D., and Barndorff-Nielsen, O., editors, Likelihood, Time Series with Econometric and Other Applications. Chapman and Hall, London. Taylor, S. J. (1986). Modelling Financial Time Series. John Wiley, Chichester. Tiao, G. and Tsay, R. (1989). Model specification in multivariate time series. Journal of the Royal Statistical Society, B, 51:157–213. Tsay, R. (1989). Parsimonious parameterization of vector autoregressive moving average models. Journal of Business & Economic Statistics, 7:327–341. Wiggins, J. (1987). Option values under stochastic volatility: Theory and empirical estimates. Journal of Financial Economics, 19:351–372. Zhang, L., Mykland, P. A., and A¨ıt-Sahalia, Y. (2005). A tale of two time scales: Determining integrated volatility with noisy high-frequency data. Journal of the American Statistical Association, 100:1394–1411.
27