J Neurophysiol 87: 122–139, 2002; 10.1152/jn.00104.1999.
Functional Role of Auditory Cortex in Frequency Processing and Pitch Perception MARK JUDE TRAMO,1–3 GAURAV D. SHAH,1,2 AND LOUIS D. BRAIDA2 1 Department of Neurology, Harvard Medical School and Massachusetts General Hospital, Boston 02114-2696; 2Research Laboratory of Electronics, Department of Electrical Engineering and Computer Science, Massachusetts Institute of Technology, Cambridge 02139; and 3Eaton-Peabody Laboratory of Auditory Physiology, Department of Otology and Laryngology, Harvard Medical School and Massachusetts Eye and Ear Infirmary, Boston, Massachusetts 02114 Received 10 February 1999; accepted in final form 4 September 2001
Tramo, Mark Jude, Gaurav D. Shah, and Louis D. Braida. Functional role of auditory cortex in frequency processing and pitch perception. J Neurophysiol 87: 122–139, 2002; 10.1152/jn.00104.1999. Microelectrode studies in nonhuman primates and other mammals have demonstrated that many neurons in auditory cortex are excited by pure tone stimulation only when the tone’s frequency lies within a narrow range of the audible spectrum. However, the effects of auditory cortex lesions in animals and humans have been interpreted as evidence against the notion that neuronal frequency selectivity is functionally relevant to frequency discrimination. Here we report psychophysical and anatomical evidence in favor of the hypothesis that fine-grained frequency resolution at the perceptual level relies on neuronal frequency selectivity in auditory cortex. An adaptive procedure was used to measure difference thresholds for pure tone frequency discrimination in five humans with focal brain lesions and eight normal controls. Only the patient with bilateral lesions of primary auditory cortex and surrounding areas showed markedly elevated frequency difference thresholds: Weber fractions for frequency direction discrimination (“higher”— “lower” pitch judgments) were about eightfold higher than Weber fractions measured in patients with unilateral lesions of auditory cortex, auditory midbrain, or dorsolateral frontal cortex; Weber fractions for frequency change discrimination (“same”—“different” pitch judgments) were about seven times higher. In contrast, pure-tone detection thresholds, difference thresholds for pure tone duration discrimination centered at 500 ms, difference thresholds for vibrotactile intensity discrimination, and judgments of visual line orientation were within normal limits or only mildly impaired following bilateral auditory cortex lesions. In light of current knowledge about the physiology and anatomy of primate auditory cortex and a review of previous lesion studies, we interpret the present results as evidence that fine-grained frequency processing at the perceptual level relies on the integrity of finely tuned neurons in auditory cortex.
INTRODUCTION
Many neurons in mammalian auditory cortex respond selectively to pure tone frequencies over a narrow range of the audible spectrum, and several anatomical subdivisions of auditory cortex are organized topographically with respect to frequency selectivity (for reviews, see Aitkin et al. 1984; Brugge and Reale 1985; Clarey et al. 1992; de Ribaupierre 1997; Kaas et al. 1999; Phillips et al. 1991; Schreiner 1992). On theoretical grounds, it would seem reasonable to propose Address for reprint requests: M. J. Tramo, MGH EDR-405, 55 Fruit St., Boston, MA 02114-2696 (E-mail:
[email protected]). 122
that neuronal frequency selectivity at the physiological level contributes to frequency discrimination at the perceptual level. However, the functional effects of auditory cortex lesions in animals and humans have been interpreted as evidence against this hypothesis. In their authoritative review of a large number of lesion studies in the Handbook of Sensory Physiology, Neff et al. (1975) concluded, “Frequency discrimination may be learned or relearned after bilateral lesions involving all or nearly all of primary auditory cortex in animals such as the cat and monkey and in human patients.” Similar observations have fueled the claim that “tonotopic organization at the cortical level is not necessary for the perception of tones” (Guttman and Diamond 1963). Still, few analyses of lesion effects have combined measurements of frequency discrimination at psychophysical thresholds and precise definition of pathoanatomical correlates. Moreover, a number of methodological issues hamper straightforward interpretations of lesion effects in cats, the principal source of animal data (for review, see Elliot and Trahiotis 1972). In the present paper, we provide psychophysical and anatomical evidence supporting the hypothesis that sharp frequency tuning in auditory cortex is functionally relevant to fine-grained frequency processing. METHODS
Subjects MHS, a 35-yr-old mixed-handed man, formerly employed as a machinist, suffered ischemic infarcts in the distribution of the right middle cerebral artery in 1980 and the left middle cerebral artery in 1981. Details pertaining to the neurological history and examination, audiological tests, neuropsychometric tests, brain imaging, and electrophysiological studies have been previously published (Mendez and Geehan 1988; Musiek et al. 1994; Tramo et al. 1990). We summarize the auditory, pathoanatomical, and evoked potential findings here. We refer to MHS as “case A1⫹” to designate distribution of his lesions, which involve A1 plus surrounding cortex bilaterally. After the first stroke, case A1⫹ did not complain of any hearing problems. After the second stroke, he was unable to hear anything at all. Brain stem auditory-evoked potentials were within normal limits.
CASE A1⫹.
The costs of publication of this article were defrayed in part by the payment of page charges. The article must therefore be hereby marked ‘‘advertisement’’ in accordance with 18 U.S.C. Section 1734 solely to indicate this fact.
0022-3077/02 $5.00 Copyright © 2002 The American Physiological Society
www.jn.org
AUDITORY CORTEX AND FREQUENCY PROCESSING
Computerized tomography (CT) demonstrated an old right frontotemporoparietal infarct and a new left temporoparietal infarct. Three weeks later, he began to hear sounds as “buzzing noise.” Pure-tone detection thresholds remained markedly elevated and sound localization severely impaired. Two months after the onset of cortical deafness, pure tone and speech detection thresholds were mildly elevated, and he began to recognize some environmental sounds. Three months after onset, he began to recognize some music and, less consistently, speech. Ten months after onset, spondee identification thresholds were moderately elevated in both ears, more so on the left. One year after onset, there were mild deficits in auditory sentence comprehension and visual confrontation naming, but identification of monosyllabic words presented monaurally and diotically via audiotape remained severely impaired. Two years after onset, there were mild-tomoderate deficits involving recognition of environmental sounds, discrimination of voiced versus voiceless consonants, and discrimination of three-element sequences that varied with respect to tone frequency pattern, temporal pattern, or vowel pattern. Eight years after onset, pure-tone detection thresholds were within normal limits but identification of monosyllabic words presented monaurally remained impaired, with greater impairment for left ear stimuli. Sentence repetition was mildly impaired. Identification of harmonic and inharmonic complex tones as “in-tune” or “out-of-tune” was severely impaired, with a response bias in favor of “out-of-tune” judgments. Performance on all subtests of the Seashore Measures of Musical Talents (Seashore et al. 1960) fell below the 20th percentile, with performance on the Timbre, Tonal Memory, and Time subtests below the 5th percentile. Magnetic resonance imaging (MRI) revealed lesions involving the entire right transverse gyrus of Heschl (TG), all or almost all of left TG, all or almost all of the right superior temporal gyrus (STG, 98% by surface area estimation), left posterior STG (20% of surface area), and other structures (Figs. 1–3). Brain stem auditory-evoked potentials were normal, and middle latency and long latency auditoryevoked potentials were abnormal in both hemispheres. At the time of the present experiments, case A1⫹ complained of difficulty understanding words that were spoken or sung, especially over the telephone or in noisy environments. He reported difficulty localizing sounds. He enjoyed listening to music and was able to recognize familiar songs. Signs on neurological examination included impaired speech perception, decreased speech intonation, a spastic left hemiparesis, and left somesthetic loss. Medications were limited to coumadin. He works at home raising two young children with his wife, a grade school teacher. Case A1⫹ has a high school degree, was an avid music listener before his strokes, and briefly took group guitar lessons in high school. Judging from the sequential effects of his strokes, there is left hemisphere dominance for language functions. PATIENT CONTROLS. Four young adults with neurological disease who did not have bilateral lesions of auditory cortex were recruited for paid participation. These patient controls provided a means of assessing nonspecific effects of brain lesions, such as difficulty sustaining concentration, on auditory task performance. We refer to these patient controls as “AC⫾ cases” to designate variable, unilateral involvement of auditory cortex. Further details of each case are provided below. RJC. RJC, a 36-yr-old right-handed man, formerly employed as a school administrator, suffered a small brain contusion secondary to closed head trauma in a 1987 motor vehicle accident. CT demonstrated a small hyperdensity in the dorsolateral midbrain in the region of the right inferior colliculus and rostral lateral lemniscus (Fig. 4). At the time of the present experiments, RJC complained of difficulty localizing sound, balancing stereo headphones and car speakers while listening to music, remembering details, sustaining concentration, and using his right arm because of pain dating back to traumatic injuries of the right clavicle and shoulder. Neurological examination was within normal limits except for decreased light touch sensation and tenderness over the supraclavicular region. Brain stem auditoryevoked potentials showed decreased wave V amplitude following
J Neurophysiol • VOL
123
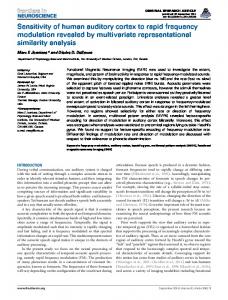
FIG. 1. Case A1⫹. T1-weighted (left) and T2-weighted (right) coronal sections extending anterior-to-posterior (A–C) through the superior temporal gyri (STGs) and transverse gyri of Heschl (TG, arrows). In the right hemisphere, these is extensive damage to the frontotemporoparietal operculum (signal hypointensities in T1-weighted images and hyperintensities in T2weighted images) that includes all of TGs (B, B⬘), all of the anterior STG (A, A⬘), and all or most of the posterior STG (C, C⬘). In the left hemisphere, the extent of the damage is limited to the posterior superior temporal region (C, C⬘), including TG (B, B⬘). These images were obtained 8 years after his 2nd (most recent) stroke. R, right; L, left. Reprinted from Tramo et al. (1990) by permission of MIT Press.
left ear stimulation and a more moderately decreased amplitude following right ear stimulation. Electroencephalography (EEG) was normal. Medications included verapamil, which abolished posttraumatic migraines, and paroxetine, which successfully treated depression. RJC has a college degree and no formal music training; recently he has been trying to teach himself how to play guitar. CASE CTS. CTS, a 27-yr-old left-handed woman, currently employed as an account manager, has a left frontotemporal arachnoid cyst, left congenital deafness, mild cerebellar tonsillar herniation, paroxysmal nocturnal dystonia, left frontal sharp waves and slowing on EEG, and a childhood history of learning difficulties. MRI in 1994 demonstrated absence of normal tissue involving the anterior half of STG, middle
87 • JANUARY 2002 •
www.jn.org
124
M. J. TRAMO, G. D. SHAH, AND L. D. BRAIDA
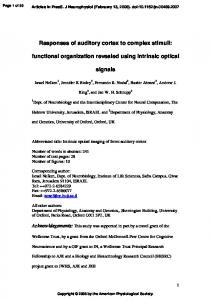
FIG. 2. Flat map of the cortical surface of the right hemisphere in case A1⫹. The spatial extent of the lesion is shown in dark gray. Intrasulcal portions of the cortex are shown in light gray. The central and lateral fissures appear in bold; thin lines represent sulci. Top: lateral schematic of the right hemisphere showing the central (Rolandic) fissure, lateral (Sylvian) fissure, and planes of section (numbered) from which the flat map below is reconstructed. Abbreviations refer to the gyri of the human cerebral cortex. Damaged gyri (g) include: H, the transverse g of Heschl; Ts, Tm, and Ti, superior, middle, and inferior temporal g; Tp, temporal pole; U, uncus; A, amygdala; H, parahippocampal g; Sm, supramarginal g; Ang, angular g; Ps, superior parietal lobule; the anterior and posterior insula; Cp, postcentral g; Ca, precentral gyrus; Fs, superior frontal gyrus; Fm, middle frontal gyrus; Fiop, Fit, and Fiorb, inferior frontal g, pars opercularis, pars triangularis, and pars orbitalis; Or, orbitofrontal g; BF, basal forebrain; Fus, fusiform g. Adapted from Tramo et al. (1990).
temporal, inferior temporal, middle frontal, and inferior frontal gyri, the temporal pole, and portions of the orbitofrontal gyri, precentral gyrus, amygdala, parahippocampal gyrus, hippocampus, and fusiform gyrus (Fig. 5). She came to neurological attention because of common migraine and musculoskeletal headaches that responded to naproxen treatment, treatment of her sleep disorder with carbamazepine, and modification of her diet. Neurological signs included sensorineural deafness of the left ear and moderate end-gaze horizontal nystagmus. J Neurophysiol • VOL
CTS has a high school degree, never took music lessons, and enjoys dancing and listening to music during aerobic exercise. CASE MAH. MAH, a 44-yr-old right-handed man, currently employed as a mail clerk, suffered closed-head trauma during a motor vehicle accident in 1975 that was complicated by cerebral contusions and complex partial seizures that typically begin with unformed auditory hallucinations. CT in 1990 demonstrated three areas of hypodensity involving the following structures: the posterior two-thirds of right
87 • JANUARY 2002 •
www.jn.org
AUDITORY CORTEX AND FREQUENCY PROCESSING
125
FIG. 3. Flat map of the cortical surface of the left hemisphere in case A1⫹. Shading, schematic, and abbreviations as in Fig. 2. Damaged gyri include: H, Ts, Sm, Ang, Ps, Os, and the posterior insula. Adapted from Tramo et al. (1990).
STG, part of right TG, and adjacent portions of middle temporal, inferior temporal, supramarginal, angular, and postcentral gyri; part of the left inferior frontal gyrus and left precentral gyrus; and part of the left superior frontal gyrus (Fig. 6). EEG in 1993 showed right and left temporal lobe sharp waves and slowing. Excellent seizure control has been achieved over the past 2 years with carbamazepine and clorazepate. The neurological history is also notable for a mixed headache disorder (musculoskeletal headaches and common migraine), currently treated with naproxen; depression, currently treated with paroxetine; and past polysubstance abuse, including 5 yr of daily ethanol J Neurophysiol • VOL
ingestion, now in remission for 12 yr. At the time of the present experiments, neurological signs included mild-to-moderate impairments in concentration, spatial orientation, verbal and visual recall, oculomotor control, gait, and distal peripheral nerve sensation. Laboratory data were remarkable for a mild anemia and folate deficiency. MAH has a high school degree, 3 years of college education, and no music training. CASE YPT. YPT, a 28-yr-old right-handed woman, currently employed as bank clerk, suffered a spontaneous intracerebral hemorrhage
87 • JANUARY 2002 •
www.jn.org
126
M. J. TRAMO, G. D. SHAH, AND L. D. BRAIDA
FIG. 4. Patient control RJC. Horizontal computerized tomography (CT) sections extending fromt the rostral pons to the quadrigeminal plate (A–C). Hyperdensity in the right dorsolateral pons and midbrain represents a traumatic intraparenchymal hemorrhage involving the inferior colliculus and rostral lateral lemniscus. Images were obtained on the same day as the closed head trauma. R, right; L, left.
in 1993. MRI demonstrated signal abnormalities involving posterior portions of the right middle and inferior frontal gyri (Fig. 7). At the time of the present experiments, YPT was being treated with carbamazepine for seizure prophylaxis, and neurological signs included a
mild impairment in concentration and mild clumsiness of the left hand. YPT has a college degree and no music training. Eight adults with no active symptoms of neurological or otological disease were recruited for paid participation through advertisements. The age range was 30 –52 yr with a median of 40.5 yr. The normal controls had from 12 to 16 yr of education with a median of 15.5 yr. Four subjects were left-handed, four were right-handed. None of the subjects was formally trained in music or actively performing music.
NORMAL CONTROLS.
Stimulus synthesis and presentation Sinusoids were digitally synthesized using an Ariel DSP-96 board and converted to analog signals at a sampling rate of 11 kHz per channel using a linear-phase digital anti-alias filter with a bandwidth of 4.96 kHz. Analog auditory signals were attenuated using TuckerDavis PA4 programmable attenuators. Vibrotactile stimuli were amplified using a Crown amplifier model D-75. Sinusoidal tones (pure tones) were presented via calibrated TDH-39P headphones with the subject seated in a double-walled, soundproof booth. The method described by Gescheider et al. (1990) for measurement of vibrotactile intensity difference thresholds was adapted to deliver sinusoidal vibrations at the thenar eminence via a custom-built 1.5 ⫻ 2.5 ⫻ 3 cm vibrator secured with an elastic bandage.
Adaptive procedure and experimental tasks
FIG. 5. Patient control CTS. A–C: coronal T1-weighted MRI sections through the frontal and temporal lobes. The decreased signal in the left inferior frontal lobe and anterior temporal lobe represents an arachnoid cyst. D and E: T1-weighted sagittal sections through the left hemisphere. F: T2-weighted horizontal section through the cyst. R, right; L, left; A, anterior; P, posterior.
J Neurophysiol • VOL
A two-interval, two-alternative forced-choice paradigm and an adaptive procedure associated with a 79.4% probability of correct response (Levitt 1970) were used to measure difference thresholds for judging whether: 1) the second of two pure tone bursts was “lower” or “higher” in pitch than the first (frequency direction discrimination); and 2) judging whether the second of two pure tone bursts was the “same” as or “different” from the first (frequency change discrimination). To assess possible nonspecific effects of brain lesions (e.g., impaired level of arousal, general attention, concentration, problemsolving) on the performance of these two tasks, we also measured: 1) difference thresholds for determining the direction of an intensity change between two successive sinusoidal vibrations delivered to the hand (vibrotactile intensity discrimination); and 2) accuracy on a standardized match-to-sample test of visual line orientation perception (Benton et al. 1983). To assess whether the brain lesions affected auditory functions other than frequency discrimination, we also measured: 1) difference thresholds for determining the direction of a duration change between two successive pure tones with a long center duration of 500 ms (duration discrimination); and 2) intensity thresholds for pure tone detection. Difference thresholds measured adaptively are expressed as Weber fractions and reported as percentages. Weber fractions were calculated by averaging the six turnaround points in each run and averaging across runs.
87 • JANUARY 2002 •
www.jn.org
AUDITORY CORTEX AND FREQUENCY PROCESSING
127
FIG. 6. Patient control MAH. Horizontal CT sections extending inferior-to-superior (A–C) through the frontal, temporal, and parietal lobes. A: the hypodensity in the right temporal lobe likely reflects an old contusion that involves Heschl’s gyrus and the superior temporal gyrus. B: the superior continuation of the hypodensity seen in A into the inferior parietal lobule is shown; in addition, there is a small hypodensity in the left frontal operculum. C: there is a hypodensity in left anterior superior frontal cortex. R, right; L, left.
FREQUENCY DIRECTION DISCRIMINATION. Difference thresholds for frequency direction discrimination were measured at center frequencies (Fc’s) of 250, 500, 1,000, and 2,000 Hz. Our method was similar to that used by Moore (1973) to define frequency difference thresholds in his highly practiced subject TC. The trial design is schematized in Fig. 8 and the results of a typical run are illustrated in Fig. 9. Each tone was presented binaurally at 40 dB above the detection threshold at each ear [i.e., 40 dB sensation level (SL)] with a starting phase of 0° and a duration of 500 ms (plateau ⫽ 480 ms, rise time ⫽ 10 ms, fall time ⫽ 10 ms). A 200-ms silent interval separated the two tones. Subjects pressed the space bar on the computer keyboard to begin each trial. Subjects were instructed to press a key labeled “L” if the pitch of the second tone was lower than that of the first tone or an adjacent, rightward key labeled “H” if the pitch of the second tone was higher than that of the first tone. The order of “lower” and “higher” trials was randomized. There was no constraint on response time; subjects were encouraged to respond as soon as they knew the answer and to guess if they were uncertain. If the subject pressed an invalid key, the trial was discarded. The time between trials was controlled by the subject and was typically one to a few seconds. Following three successive correct trials, the frequency difference (⌬F) was halved; after each incorrect trial, ⌬F was doubled. The ⌬F associated with a reversal in the sign of the frequency change (i.e., an increase or decrease in ⌬F) was defined as a turnaround point. A run ended when the 6th turnaround point was reached. The mean of the six turnaround points was defined as the difference threshold for that run. Each subject practiced with feedback for at least three to five runs or, in a few cases, until performance worsened over any two successive runs. After a few minutes rest period, three to five test runs were completed without feedback. The initial value of ⌬F on test runs was set one to two steps above the largest ⌬F on incorrect practice trials so that the initial direction of ⌬F change was downward. The subject’s frequency difference threshold was defined as the mean frequency difference threshold of the test runs.
Difference thresholds for frequency change discrimination were measured at a center frequency of 1,000 Hz. Otherwise, the stimulus parameters, trial design, adaptive procedure, and definition of difference threshold were the same as in the preceding text. Subjects were instructed to press a key labeled “S” if the second tone sounded the same as the first tone or an adjacent, rightward key labeled “D” if the second tone sounded different from the first tone. The order of “same” and “different” trials was randomized.
FREQUENCY CHANGE DISCRIMINATION.
FIG. 7. Patient control YPT. A–C: coronal T1-weighted magnetic resonance imaging (MRI) sections through the frontal lobe and temporal lobes. The decreased signal in the right middle and inferior frontal gyri represents the residuum of a spontaneous intracerebral hemorrhage. D: sagittal view of the right hemisphere showing the lesion in premotor frontal cortex. E and F: horizontal, T2-weighted MRI’s showing hemosiderin (hypointensity) and surrounding necrosis (hyperintensity) in the right frontal lobe. Images were obtained 4 mo (120 days) after the acute bleed. R, right; L, left; A, anterior; P, posterior.
J Neurophysiol • VOL
DURATION DISCRIMINATION. Difference thresholds for duration discrimination were measured at a frequency of 1,000 Hz and a center duration of 500 ms. Stimulus parameters, trial design, adaptive procedure, and definition of the difference threshold were otherwise the same as the preceding text. Subjects were instructed to press a key labeled “S” if the second tone sounded shorter than the first tone or an adjacent, rightward key labeled “L” if the second tone sounded longer
87 • JANUARY 2002 •
www.jn.org
128
M. J. TRAMO, G. D. SHAH, AND L. D. BRAIDA
FIG. 8. Trial design of the 2-interval 2-alternative forced-choice paradigm used to measure difference thresholds. The waveforms of acoustic and vibrotactile stimuli are schematized. SL, sensation level. Rise and fall times for all stimuli were 10 ms. (In the tone duration experiment, the center duration was 500 ms. In the vibrotactile intensity experiment, stimulus intensity was 20 dB SL.)
than the first tone. The order of “shorter” and “longer” trials was randomized. VIBROACTILE INTENSITY (VTI) DISCRIMINATION. Difference thresholds for VTI discrimination were measured separately for each hand at a vibration frequency of 250 Hz and at a center vibration intensity of 20 dB SL. The vibrator was secured at the thenar eminence with an elastic bandage, and the arm was rested in the supinated position on a foam rubber pad with the subject seated. The trial design, adaptive procedure, and calculation of the difference threshold were the same as those used for frequency direction discrimination, frequency change discrimination, and duration discrimination. Because case A1⫹ has a left hemiplegia and thus could not respond manually with the unstimulated hand, all subjects responded by saying “weaker” or “stronger;” the examiner then entered the response on the computer keyboard. The order of “weaker” and “stronger” trials was randomized. Patient control MAH had a peripheral neuropathy, presumably caused by folate deficiency and chronic ethanol exposure in the past, so he was excluded from this control task.
The Judgment of Line Orientation test (Benton et al. 1983) was administered and scored in standard fashion. In this task, subjects match the orientations of two lines to the two corresponding orientations embedded in an array of eleven lines equally spaced from 0 to 180 degrees.
VISUAL LINE ORIENTATION MATCH-TO-SAMPLE TASK.
Puretone and vibrotactile detection thresholds were measured for each ear and hand, respectively, at each test frequency using a one-interval down-up staircase procedure. Subjects were instructed to indicate when the tone was heard or the vibration felt. The examiner silently entered the response on a computer keyboard. All stimuli were 500 ms in duration with 10 ms rise and fall times. Initial intensity was at least 10 dB above thresholds determined in pilot measurements. The intensity was decreased randomly by 1–5 dB at pseudorandom intervals ranging from 1 to a few seconds. The descending threshold was defined as the first intensity at which no response was elicited. The intensity was then decreased by 10 dB, and the intensity stepped up by 1–5 dB. The ascending threshold was defined as the first intensity at which a positive response was elicited. Pure tone detection threshold was defined as the mean of the descending and ascending thresholds.
PURE-TONE AND VIBROTACTILE DETECTION THRESHOLDS.
olds for case A1⫹, AC⫾ cases, and normal subjects on each of the four psychophysical tasks that employed an adaptive procedure (frequency direction discrimination, frequency change discrimination, duration discrimination, and VTI discrimination). In case A1⫹, the mean Weber fraction of the five runs at each Fc ranged from 12.0 to 15.8%, with a mean average across Fc’s of 13.7% (a little over 2 semitones). In AC⫾ cases, the mean Weber fraction ranged from 0.94 to 2.3% [mean ⫾ SE ⫽ 1.7 ⫾ 0.38%]. In normal subjects, the Weber fraction ranged from 0.47 to 1.0% (0.72 ⫾ 0.09%). The Weber fractions of our untrained normal controls were only slightly larger than those previously reported in highly-practiced normals and similarly showed a decrease in Weber fractions with increasing Fc’s in this frequency range (Moore 1973). We carried out a two-way ANOVA to assess the effects of subject class [case A1⫹ vs. AC⫾ cases vs. normal controls] and Fc (250 vs. 500 vs. 1,000 vs. 2,000 Hz) on Weber fractions (the dependent variable). The random factor was runs. As expected from inspection of Figs. 10 and 11, there was a highly significant effect of subject class [F(2,212) ⫽ 434.01; P ⬍ 0.0001]. There was no significant effect of Fc on Weber fractions, indicating that, on average, ⌬F thresholds were proportional to Fc [F(3,212) ⫽ 2.74; P ⫽ 0.044]. There was an interaction between subject class and Fc, indicating that the pattern of performance across Fc’s varied across different subject classes [F(6,212) ⫽ 4.83; P ⫽ 0.0001]. Given the effect of subject class and the interaction between subject class and Fc, we carried out separate ANOVAs on each subject class using Fc as the factor, runs as the random factor, and Weber fractions as the dependent variable. There was no effect of Fc in case A1⫹, indicating no significant variation in Weber fractions across the four Fc’s tested [F(3,16) ⫽ 0.40, P ⫽ 0.76]. However, there was a significant effect of Fc in both AC⫾ cases [F(3,56) ⫽ 7.77, P ⫽ 0.0002] and normal controls [F(3,89) ⫽ 17.42, P ⬍ 0.0001]. Thus in Fig. 10, the progressive decline in mean Weber fractions seen with increasing Fc was significant for these two subject classes. To assess the effect of interindividual variation on Weber fractions within the AC⫾ cases and normal controls, we carried out separate ANOVAs on each population using subject as
RESULTS
Frequency direction discrimination The scatter plot in Fig. 10 shows ⌬F thresholds for frequency direction discrimination. Data for each run and all subjects at all four center frequencies are illustrated. There is a clear separation between case A1⫹ and the other 12 subjects. Figure 11 shows Weber fractions averaged across runs for each subject class. Table 1 summarizes the difference threshJ Neurophysiol • VOL
FIG. 9. Design of the adaptive procedure used to measure the frequency difference threshold for 1 run. The 6 turnaround points are circled. The dashed line shows the mean of the turnaround points. [For the tone duration experiment, the ordinate would be “time” (ms). For the vibrotactile intensity experiment, the ordinate would “intensity” (dBV).]
87 • JANUARY 2002 •
www.jn.org
AUDITORY CORTEX AND FREQUENCY PROCESSING
a factor and runs as the random factor. For AC⫾ cases, there was a significant effect of subject [F(3,56) ⫽ 3.38, P ⫽ 0.024], indicating that Weber fractions varied from patient to patient. For normal controls, there was a highly significant effect of subject [F(7,89) ⫽ 21.13, P ⬍ 0.0001], indicating that Weber fractions varied from individual to individual. Apparently, this within-class variability did not compromise detection of across-class variability on the initial two-way ANOVA. In view of the significant effect of subject class, we also compared Weber fractions between subject groups. Because the number of runs for case A1⫹ and AC⫾ cases was small, and because Weber fractions were not evenly distributed along an interval or ratio scale, we used a nonparametric test, the Mann-Whitney U test, to compare Weber fractions between subject classes. At each Fc, the Weber fraction for case A1⫹ was significantly higher than the mean Weber fraction for AC⫾ cases [Fc ⫽ 250 Hz, U ⫽ 100, P ⫽ 0.0008; Fc ⫽ 500 Hz, U ⫽ 85, P ⫽ 0.001; Fc ⫽ 1,000 Hz, U ⫽ 100, P ⫽ 0.0008; Fc ⫽ 2,000
Hz, U ⫽ 75, P ⫽ 0.0012]. The Weber fraction for case A1⫹ was also significantly higher than the mean Weber fraction for normal controls [Fc ⫽ 250 Hz, U ⫽ 160, P ⫽ 0.0004; Fc ⫽ 500 Hz, U ⫽ 140, P ⫽ 0.0005; Fc ⫽ 1,000 Hz, U ⫽ 165, P ⫽ 0.0004; Fc ⫽ 2,000 Hz, U ⫽ 140, P ⫽ 0.0005]. AC⫾ cases had significantly higher Weber fractions than normal controls for all four Fc’s at the P ⱕ 0.05 level of significance and for one Fc at the P ⱕ 0.01 level [Fc ⫽ 250 Hz, U ⫽ 441, P ⫽ 0.0234; Fc ⫽ 500 Hz, U ⫽ 329, P ⫽ 0.0118; Fc ⫽ 1,000 Hz, U ⫽ 463, P ⫽ 0.0146; Fc ⫽ 2,000 Hz, U ⫽ 316, P ⫽ 0.0072]. For all Fc’s combined, there were highly significant differences between the mean Weber fraction in case A1⫹ and the mean Weber fraction in AC⫾ cases [U ⫽ 433, P ⬍ 0.0001]. Likewise, there were highly significant differences between the mean Weber fraction in case A1⫹ and the mean Weber fraction in normal controls [U ⫽ 2,420, P ⬍ 0.0001]. The mean Weber fraction in AC⫾ cases was also significantly higher than that in normal controls [U ⫽ 2,512, P ⬍ 0.0001].
FIG. 10. Scatter plots showing ⌬F thresholds for frequency direction discrimination. ⌬F thresholds at each center frequency (Fc) are expressed as Weber fractions (Fx) in % [(⌬F/Fc) ⫻ 100]. The results of every run for every participant are plotted. ⫻, case A1⫹. 䊐, AC⫾ cases. E, normal subjects.
J Neurophysiol • VOL
129
87 • JANUARY 2002 •
www.jn.org
130
M. J. TRAMO, G. D. SHAH, AND L. D. BRAIDA
FIG. 11. ⌬F thresholds for frequency direction discrimination averaged across runs for each subject class. Bars ⫽ 1 SE of the mean. The error bars for normal controls are not seen because they are smaller than the radius of the circle.
Frequency change discrimination In case A1⫹, the Weber fraction at Fc ⫽ 1,000 Hz was 6.9% (a little over 1 semitone). In AC⫾ cases, the Weber fraction range ⫽ 0.61–1.4% and the mean ⫾ SE ⫽ 1.0 ⫾ 0.2%. In normal controls, the Weber fraction range ⫽ 0.31–1.5% and the mean ⫾ SE ⫽ 1.1 ⫾ 0.2%. An ANOVA was carried out using subject class as the factor, runs as the random factor, and Weber fractions as the dependent variable. There was a highly significant effect of subject class [F(2,44) ⫽ 55.42; P ⬍ 0.0001]. Case A1⫹ had significantly higher Weber fractions than AC⫾ cases [U ⫽ 40, P ⫽ 0.008]. Case A1⫹ also had higher Weber fractions than normal controls [U ⫽ 90, P ⫽ 0.005]. The Weber fractions of AC⫾ cases and normal controls did not differ significantly [U ⫽ 213.5, P ⫽ 0.93]. We combined Weber fraction data for the 12 participants without bilateral auditory cortex lesions and found a significant difference between their mean Weber fraction (1.05 ⫾ 0.15%) and the Weber fraction in case A1⫹ [U ⫽ 132, P ⫽ 0.0041]. To analyze the variability within the AC⫾ and normal control populations, ANOVAs were run separately on each with individual subjects as the factor, runs as the random factor, and Weber fractions as the dependent variable. For AC⫾ cases, there was an effect of subject [F(3,10) ⫽ 4.65; P ⫽ 0.028], indicating significant variability among the four patients. For the normal controls, there was also an effect of subject [F(7,22) ⫽ 4.05; P ⫽ 0.005].
To consider how task requirements influenced ⌬F thresholds, we compared Weber fractions at Fc ⫽ 1,000 Hz for frequency change discrimination (“same”—“different” judgments) and frequency direction discrimination (“lower”— “higher” judgments; Fig. 12). In case A1⫹, the mean Weber fraction for frequency direction discrimination was larger than the mean Weber fraction for frequency change discrimination by a factor of 1.8. In contrast, for the eight normal controls, the mean Weber fraction for frequency direction discrimination was smaller than that for frequency change discrimination by a factor of 0.7. The ratio in case A1⫹ was thus many SEs above the mean for normal controls (Table 2) [Student’s t(7) ⫽ 12.4, P ⬍ 0.001]. There was also a significant difference between case A1⫹ and AC⫾ cases with respect to the ratio of Weber fractions for frequency direction:change discrimination [t(3) ⫽ 28, P ⬍ 0.001]. The latter ratio for AC⫾ cases did not differ significantly from that for normal subjects [t(10) ⫽ 1.24, P ⫽ 0.30]. This pattern of results indicates a disproportionate ele-
1. Difference thresholds associated with a 79.4% probability of correct response
TABLE
Weber Fractions, %
Case A1⫹ AC⫾ cases Normals
⌬F Direction
⌬F Change
Duration
VTI
13.7 1.7 0.7
6.9 1.1 1.0
34.4 21.9 19.3
37.1 22.5 10.0
Difference thresholds for frequency direction discrimination were averaged across four center frequencies. VTI, vibrotactile intensity. J Neurophysiol • VOL
FIG. 12. Bar graphs comparing ⌬F thresholds for frequency direction discrimination and frequency change discrimination in case A1⫹ vs. the 12 controls. Fx, fraction.
87 • JANUARY 2002 •
www.jn.org
AUDITORY CORTEX AND FREQUENCY PROCESSING TABLE
2. Ratios of Weber fractions, auditory: VTI
Case A1⫹ Normals AC⫾ cases All controls
⌬F Direction: VTI
⌬F Change: VTI
Duration: VT
0.34 0.059 ⫾ 0.015*** 0.051 ⫾ 0.017*** 0.057 ⫾ 0.011***
0.19 0.11 ⫾ 0.02** 0.053 ⫾ 0.021* 0.097 ⫾ 0.019***
0.93 2.0 ⫾ 0.25** 1.1 ⫾ 0.19 1.8 ⫾ 0.23**
P values refer to the results of pair-wise comparisons between case A1⫹ and the other subjects. Abbreviations as in Table 1. n ⫽ 8, 4, and 12 for normals, AC⫾ cases, and all controls, respectively. * P ⬍ 0.05; ** P ⬍ 0.01, *** P ⬍ 0.001.
vation in Weber fractions for frequency direction discrimination compared with frequency change discrimination in case A1⫹. The combined ratio in AC⫾ cases and normal subjects (0.88) was significantly lower than that in case A1⫹ [t(11) ⫽ 3.25, P ⬍ 0.0077]. Duration discrimination In case A1⫹, the Weber fraction for duration discrimination was 34.4%. In AC⫾ cases, the Weber fraction range ⫽ 11.8 – 32.5% (21.9 ⫾ 5.0%). In normal controls, the Weber fraction range ⫽ 11.7–28.06% (19.3 ⫾ 2.9%). An ANOVA with subject class as the factor, runs as the random factor, and Weber fractions as the dependent variable revealed a significant effect of subject class [F(2,48) ⫽ 5.55; P ⫽ 0.0068]. Separate ANOVAs on the AC⫾ and normal control populations revealed significant variability within both subject groups [respectively, F(3,14) ⫽ 10.21; P ⫽ 0.0008; F(7,22) ⫽ 3.02; P ⫽ 0.022]. In case A1⫹, the Weber fraction was significantly higher than that of AC⫾ cases and normal controls (respectively, U ⫽ 48, P ⫽ 0.008; U ⫽ 85, P ⫽ 0.0048). There was no significant difference between the Weber fractions of AC⫾ cases and normal controls (U ⫽ 349; P ⫽ 0.093). The Weber fraction in case A1⫹ was significantly higher than the mean Weber fraction of AC⫾ cases and normal controls combined (combined mean ⫽ 20.2 ⫾ 2.0; U ⫽ 133, P ⫽ 0.015). This pattern of results is qualitatively similar to that observed for ⌬F thresholds and indicates an elevation in difference thresholds for duration direction discrimination around a long center duration of 500 ms in case A1⫹. Vibrotactile intensity (VTI) discrimination In case A1⫹, the Weber fraction in the hand ipsilateral to the lesion of sensorimotor cortex was 37.1%. In AC⫾ cases (excluding MAH), the Weber fraction range in the dominant hand ⫽ 8.60 –32.3% (22.5 ⫾ 8.8%). In normal controls, the Weber fraction range in the dominant hand ⫽ 7.30 –14.8% (10.0 ⫾ 0.91%). An ANOVA with subject class as the factor, runs as the random factor, and Weber fraction as the dependent variable revealed a highly significant effect of subject class [F(2,36) ⫽ 46.86; P ⬍ 0.0001]. A separate ANOVA on the AC⫾ cases revealed significant variability from patient to patient [F(2,4) ⫽ 99.87; P ⫽ 0.0006]. Within the normal control group, there was no significant intersubject variability [F(7,20) ⫽ 2.03; P ⫽ 0.102]. The Weber fraction in case A1⫹ was significantly higher than that in AC⫾ cases (U ⫽ 30, P ⫽ 0.0062). The Weber J Neurophysiol • VOL
131
fraction in case A1⫹ was significantly higher than that of normal controls (U ⫽ 140, P ⫽ 0.0012). There was no significant difference in Weber fractions between AC⫾ cases and normal controls (U ⫽ 111, P ⫽ 0.223). The Weber fraction in case A1⫹ was significantly higher than the mean Weber fraction in AC⫾ cases and normal controls combined [combined mean ⫽ 13.7 ⫾ 2.86%; U ⫽ 185, P ⫽ 0.0004]. This pattern of results is qualitatively similar to those observed for ⌬F thresholds and duration difference thresholds and indicates an elevation in VTI difference thresholds in case A1⫹. Visual line orientation match to sample Case A1⫹ correctly answered 29 of the 30 items on the Judgment of Line Orientation test. This performance is classified as “superior” according to scoring standards based on the distribution of corrected scores in Benton’s normative sample (Benton et al. 1983). The mean scores for AC⫾ cases (22.2) and normal controls (22.8) were in the “average” range. Performance ratios For each adaptive task, a performance ratio was computed as WFA1⫹ divided by WFother, where WFA1⫹ is the Weber fraction for case A1⫹ and WFother the mean Weber fraction for AC⫾ cases and normal controls combined. The results are illustrated in Fig. 13. Performance ratios for frequency direction discrimination (15.4) and frequency change discrimination (6.6) were far higher than the performance ratios for the duration direction discrimination (1.71), and VTI direction discrimination (2.59). To further compare the results among auditory tasks for case A1⫹ and the other subjects, we computed performance ratios using the VTI difference threshold as a reference, since it was obtained in a different sensory modality using the same procedures (Table 2). The ratio of frequency direction discrimination to VTI discrimination was significantly higher in case A1⫹ than in AC⫾ cases [t(2)]⫽ 17.0, P ⬍ 0.01], normal controls [t(7) ⫽ 18.7, P ⬍ 0.001], and AC⫾ cases and normals combined [t(10) ⫽ 25.7, P ⬍ 0.001]. A similar pattern of results was observed for the ratio of frequency change discrimination to VTI discrimination: A1⫹ versus AC⫾, t(2) ⫽ 6.50, P ⬍ 0.05; A1⫹ versus normal controls, t(7) ⫽ 4.00, P ⬍ 0.01; A1⫹ versus AC⫾ and normal controls combined, t(10) ⫽ 4.89, P ⬍ 0.001. In contrast, the ratio of duration discrimination to VTI discrimination was not significantly different in case A1⫹ and AC⫾ cases [t(2) ⫽ 0.89, P ⬎ 0.20]. Moreover, the ratio of duration discrimination to VTI discrimination was significantly lower in case A1⫹ than in normal controls [t(7) ⫽ 4.28, P ⬍ 0.01] and in AC⫾ cases and normal controls combined [t(10) ⫽ 3.78, P ⬍ 0.01]. These results indicate that within the auditory modality, difference thresholds for frequency direction discrimination and frequency change discrimination were elevated more than difference thresholds for duration direction discrimination centered at 500 ms. In addition, they emphasize that the ⌬F threshold elevations in case A1⫹ cannot be attributed to differences related to nonauditory task requirements of the adaptive method.
87 • JANUARY 2002 •
www.jn.org
132
M. J. TRAMO, G. D. SHAH, AND L. D. BRAIDA
FIG. 13. Performance ratios computed as the performance of case A1⫹ divided by the mean performance of the 12 controls on each task. For frequency direction discrimination, Weber fractions (WF) were averaged across the four Fc’s. - - -, performance ratio ⫽ 1.
Pure-tone detection thresholds Figure 14 plots pure-tone detection thresholds at each Fc for case A1⫹ and normal and patient controls combined. “Reference” thresholds correspond to 25 dB hearing level (HL), that is, 25 dB greater than the zero reference level for mean audible pressure recommended by the International Standards Organization (1975). For case A1⫹ as well as controls, detection thresholds were within normal limits for both the left and right ears by clinical standards: the mean of the thresholds at 500, 1,000, and 2,000 Hz was ⬍25 dB HL (AAO-ACO 1979; Yantis 1994). Still, left ear detection thresholds for case A1⫹ were more than 2 SEs higher than those of controls at all four frequencies tested, raising the possibility of mild hearing loss contralateral to his complete or near-complete right auditory cortex lesion.
sured in neurological patients without bilateral lesions of auditory cortex, and they were almost 20-fold higher than Weber fractions measured in normal controls. For frequency change discrimination (same– different pitch judgments), Weber fractions averaged 7% at 1,000 Hz, about sevenfold higher than the Weber fractions observed in the other groups. The pattern of results on other auditory, tactile, and visual tasks indicates that the observed elevations in frequency difference thresholds cannot be attributed to nonspecific lesion effects on task performance or on hearing in general. We interpret the present findings as evidence that finegrained frequency processing at the perceptual level relies on the integrity of finely tuned neurons in A1 and surrounding areas. This interpretation is based on the anatomical localization of the lesions in case A1⫹ and current knowledge about anatomical-physiological correlates in humans and nonhuman primates.
DISCUSSION
To summarize the main results: bilateral auditory cortex lesions involving A1 were associated with elevations in frequency difference thresholds. For frequency direction discrimination (lower– higher pitch judgments), Weber fractions associated with a 79.4% probability of correct response averaged 14% at center frequencies between 250 and 2,000 Hz. These Weber fractions were about eightfold higher than those meaJ Neurophysiol • VOL
Anatomical considerations Deficits in frequency processing in case A1⫹ were associated with chronic, bilateral hemispheric infarcts involving all of the transverse gyrus of Heschl (TG) in the right hemisphere; all or almost all of TG in the left hemisphere; the posterior one-fifth of the left superior temporal gyrus (STG) and adjacent
87 • JANUARY 2002 •
www.jn.org
AUDITORY CORTEX AND FREQUENCY PROCESSING
133
FIG. 14. Pure-tone detection thresholds. ■, case A1⫹; E, patient and normal controls; ‚, reference level corresponding to the upper limits of normal by clinical standards (AAO-ACO 1979; Yantis 1994). Bars, 1 SE for normal and patient controls combined.
inferior parietal lobule; all or almost all of right STG; and portions of right frontal, parietal, medial temporal, and inferior temporal cortex. None of the other four neurological patients, including one with multiple cerebral contusions and right TG and STG damage (case MAH), had a single experimental run in which the frequency difference threshold was higher than the 23 thresholds measured in case A1⫹. TG runs across the middle third of the superior surface of STG deep within the lateral (Sylvian) fissure. Some individuals possess two or more TGs in one or the other hemisphere (Campain and Minckler 1976; Musiek and Reeves 1990), and most have a greater volume of white matter on the left than on the right (Penhune et al. 1996). TG receives the geniculotemporal radiation and contains the highest concentration of neurons and myelinated fibers in all of superior temporal cortex (Brodmann 1909; Campbell 1905; Economo 1929; Galaburda and Sanides 1980; Rademacher et al. 1993). These cytoarchitectural and connectional features, combined with electrophysiological data on minimum response latencies measured with intracortical electrodes (Liegois-Chauvel et al. 1991, 1994, 1995), cortical surface electrodes (Celesia 1976; Celesia and Puletti 1969; Celesia et al. 1968), subdural strip electrodes (Lee et al. 1984), and scalp electrodes (Scherg et al. 1989), indicate that all of A1 resides within TG. However, TG and A1 are not co-extensive: minor portions of TG (and all supernumerary TGs) contain non-koniocortical fields (Rademacher et al. 1993). Whether all of STG may be considered auditory association cortex and whether auditory association cortex extends beyond the boundaries of STG remain uncertain. Cortical depth and surface electrode recordings of click-evoked potentials in humans suggest that all or almost all of auditory cortex lies within the posterior two-thirds of superior temporal cortex (Celesia 1976; Celesia and Puletti 1969; Celesia et al. 1968; Howard et al. 2000; Lee et al. 1984). Likewise, maximal increases in glucose metabolism have been observed in posterior superior temporal cortex during binaural stimulation with combined speech and music (Mazziotta et al. 1982). Oxygen utilization increases from the posterior extreme to almost the anterior extreme of STG during binaural stimulation with speech and J Neurophysiol • VOL
white noise (Binder et al. 1994), and blood flow increases in the middle temporal gyrus as well as STG during binaural stimulation with speech and nonspeech sounds (Belin et al. 2000). In macaques, free-field stimulation with a potpourri of species-specific vocalizations, human voices, and environmental sounds increases glucose metabolism throughout superior temporal cortex, from the posterior end of the lateral fissure anteriorly to the temporal pole (Poremba et al. 1999). It is likely that residual auditory functions in case A1⫹ are subserved by spared auditory association cortex residing in left anterior STG and by subcortical structures. Although inputs to the left auditory association cortex from damaged left A1 and damaged right auditory cortex were interrupted, auditory information may have reached the spared regions via ascending pathways from the dorsal and medial nuclei of the medial geniculate complex, the pulvinar, the posterior nucleus, the suprageniculate nucleus, and/or the limitans nuclei. These parallel ascending inputs to auditory association cortex are well-documented in macaques (Akert et al. 1959; Burton and Jones 1976; Chow 1950; Clark 1936; Clark and Northfield 1937; Hackett et al. 1998; Hashikawa et al. 1992, 1995; Jones and Burton 1976; Locke 1960; Mesulam and Pandya 1973; Molinari et al. 1995; Morel et al. 1993; Pandya and Sanides 1973; Pandya et al. 1994; Poliak 1932; Rauschecker et al. 1997; Siqueira 1965; Walker 1937). In addition, the ventral nucleus of the medial geniculate complex, the main source of afferent input to A1, provides weak inputs to auditory association cortex surrounding A1. Physiological considerations At present, little is known about frequency processing at the cellular level in human auditory cortex. However, a wealth of knowledge is available in the experimental animal literature (for reviews, see Clarey et al. 1992; de Ribaupierre 1997; Kaas et al. 1999). For phylogenetic, anatomical, and functional reasons, knowledge about the single-unit physiology of macaque auditory cortex may be especially relevant to understanding frequency processing in humans. Like humans, macaques house koniocortex within the middle third of the superior surface of superior temporal cortex
87 • JANUARY 2002 •
www.jn.org
134
M. J. TRAMO, G. D. SHAH, AND L. D. BRAIDA
deep within the lateral fissure (Bonin and Bailey 1947; Sanides 1972; Walker 1937). While it is not customary to designate TG in the macaque, several authors have identified a small elevation along the superior surface of STG that stains heavily for Nissl, myelin, cytochrome oxidase, and parvalbumin (Bonin and Bailey 1947; Jones et al. 1995; Merzenich and Brugge 1973; Pandya and Sanides 1973; Tramo 1998). Bonin and Bailey (1947) remarked that the superior surface of STG in Macaca mulatta “bears a very slight elevation, recognizable when one is acquainted with Heschl’s [transverse] gyrus in man, but easily overlooked otherwise” (p. 17). In M. fuscata, Jones et al. (1995) identified a similarly situated “annectant” gyrus as the gross anatomical correlate of koniocortex and high-density parvalbumin staining. These observations indicate that macaques have a rudimentary gross morphological homologue of human TG which houses histologically-defined A1. For heuristic purposes, it might be advantageous to refer to this structure as the “transverse gyrus” in macaques as well as humans. Microelectrode mapping studies of A1 and other “core area” fields in anesthetized macaques have demonstrated frequencyselective neurons that are topographically organized with respect to “best frequency”—the pure tone frequency associated with maximal firing at a given intensity (Kosaki et al. 1997; Merzenich and Brugge 1973; Morel et al. 1993; Pfingst and O’Connor 1981; Rauschecker et al. 1997). In addition, several fields in the “belt area” of auditory association cortex surrounding A1 contain neurons that are frequency-selective and topographically organized. In general, neurons in these belt fields are less sharply tuned than neurons in core fields (Kosaki et al. 1997; Rauschecker 1995, 1997). In alert rhesus monkeys, 500-ms and 50-ms pure tones presented at frequencies and intensities similar to those used in the present experiment evoke responses in individual core area neurons over bandwidths ranging from approximately 0.02 octaves (about a quarter of a semitone) to 5 octaves (60 semitones); the majority of cells respond over 0.1 octaves (about a semitone) or more (Recanzone et al. 2000; Tramo 1998; Tramo et al. 1999). Macaques can discriminate 50-ms pure tones differing in frequency by about 3% (half a semitone) at 500 Hz and 60 dB SPL (Sinnott and Brown 1993). Thus there may exist individual neurons with frequency selectivity sufficient to support frequency discrimination at the difference thresholds observed in our control subjects. Still, the overwhelming majority of core area neurons in macaques respond over bandwidths greater than a semitone. The results of microelectrode recordings in anesthetized owl monkeys who had been trained on a frequency-change discrimination task indicate that perceptual acuity correlates with the number of A1 neurons tuned to frequencies used in the task (Recanzone et al. 1993). In human auditory cortex, extracranial recordings of local field potentials and functional imaging techniques have provided evidence of frequency selectivity. Butler (1968) showed that the peak-to-peak amplitude of the N100 potential recorded at the vertex is sensitive to the frequency difference between successive sinusoidal tones (monaural stimulation at 70 dB SL, duration ⫽ 600 ms, ISI ⫽ 4.4 s, probability of occurrence standard tone:deviant tone ⫽ 3:1). The larger the frequency difference between tones, the larger the amplitude. Butler attributed the correlation between frequency difference and N100 amplitude to frequency-dependent refractoriness and difJ Neurophysiol • VOL
ferences in the amount of overlap between frequency-selective neuron populations. The effect of frequency difference on N100 amplitude is independent of the harmonic relationship between the standard and deviant tones (Kussmaul et al. 1992). The amplitude and latency of tone-evoked magnetic potentials peaking around 100 ms poststimulus (N100m) vary monotonically with the width of surrounding notched noise (Sams and Salmelin 1994). N100 and N100m amplitude differences can be elicited only at or above frequency difference thresholds for same-different discriminations (Cse´ pe et al. 1992; Sams et al. 1985). These findings suggest that neural mechanisms underlying the sensitivity of N100/N100m amplitude to frequency differences are relevant to frequency resolution at the perceptual level. The location of frequency-selective neurons generating the N100 and other potentials has been extensively investigated using dipole source analyses of scalp-recorded electrical fields (Giard et al. 1994; Scherg and Cramon 1985; Scherg et al. 1989) and magnetic fields (Gallen et al. 1993; Hari et al. 1984; Kuriki et al. 1995; Lavikainen et al. 1995; Nakasato et al. 1995; Reite et al. 1994; Tiitinen et al. 1993). To summarize the main results: most or all neural generators of lateral scalp potentials peaking between 18 and 200 ms after acoustic stimulation lie within TG or close by along the superior surface of STG, and some potentials peaking between 150 and 300 ms may originate within the lateral surface of STG, dorsolateral prefrontal cortex, and parietal cortex. In general, the effects of focal lesions on extracranial electrical field potentials (Aaltonen et al. 1993; Graham et al. 1980; Kileny et al. 1987; Knight et al. 1988; Kraus et al. 1982; Praamstra et al. 1993) and magnetic field potentials (Makela 1993; Makela and Hari 1992) support the notion that neurons in TG and adjacent STG are the major contributors to evoked potentials peaking after about 13 ms and before 200 ms poststimulus onset. In our case A1⫹, middleand long-latency auditory-evoked potentials are grossly abnormal (Musiek et al. 1994). Evidence that neurons within human auditory cortex are topographically organized with respect to frequency selectivity was first obtained using magnetoencephalography (MEG). Some authors reported a low- to high-frequency gradient of the N100m potential along the anterior to posterior axis of posterior superior temporal cortex (Elberling et al. 1982; Pantev et al. 1988). Others reported a low- to high-frequency gradient along its lateral to medial axis (Huotilainen et al. 1995; Romani et al. 1982a,b; Yamamoto et al. 1992), consistent with early claims based on lesion effects (Economo 1929). One octave is represented by approximately 2–3 mm of cortical surface. Analyses of scalp-recorded electrical potentials also suggest that posterior superior temporal cortex contains a topographic organization of frequency-selective neurons, with the lowfrequency representation anteriorly and slightly lateral to the high-frequency representation (Scherg et al. 1989). Functional imaging studies have provided converging evidence of frequency selectivity and a low- to high-, anterolateral-to-posteromedial frequency representation in and around TG, albeit with considerable intersubject variability (Lauter et al. 1985; Strainer et al. 1997; Wessinger et al. 1997). Conspicuously missing from some human studies is the multiplicity of topographically organized fields one would expect on the basis of microelectrode mapping experiments in macaques. Over the past several years, several MEG studies have reported evidence
87 • JANUARY 2002 •
www.jn.org
AUDITORY CORTEX AND FREQUENCY PROCESSING
for two frequency representations in posterior superior temporal cortex (Cansino et al. 1994; Pantev et al. 1995; Tiitinen et al. 1993; Verkindt et al. 1995). Recent functional MRI results obtained by Talavage and colleagues (2000) via stimulation with high- and low-pass filtered music and band-limited, amplitude-modulated noise show four separate high-frequency regions and four separate low-frequency regions. Among the most significant pieces of evidence that human auditory cortex contains frequency-selective neurons is the microelectrode study of an epilepsy patient by Howard and colleagues (1996). Of 26 neurons encountered in three penetration sites spanning 8 mm of TG, 19 were judged to be sharply tuned. In summary, on the basis of the gross topography of the lesions observed in case A1⫹, physiological-anatomical correlates in macaques, and electrophysiological data in humans, case A1⫹ likely had complete loss of frequency-selective neurons in right A1 and surrounding areas, complete or nearcomplete loss in left A1, and sparing of some frequencyselective neurons in left belt areas anterior and adjacent to A1. Thus the fact that his ability to resolve frequencies was coarsened but not abolished may be attributable to preservation of neurons in the belt areas of left STG. Functional effects of auditory cortex lesions in primates Perhaps the most influential experiments contributing to the belief that primate auditory cortex plays no role in frequency discrimination were carried out by Evarts (1952a,b). Two young M. mulatta learned an operant conditioning task that required differential responses to 350 Hz (“go”) and 3500 Hz (“no-go”) tones. Correct responses were rewarded with food, and incorrect responses were punished by electric shock. The intensity of the tones was approximately 50 dB SL re: human detection thresholds. After they reached the response criterion of 80% correct, all but a small portion of anterior superior temporal cortex was aspirated in the left and right hemispheres. Part of the insula was also taken. The extent of the lesions was confirmed postmortem, and near-complete retrograde degeneration of the parvocellular portion of the medial geniculate nucleus was observed. Ten days post-ablation, both monkeys performed well in their initial training session and quickly re-achieved the preoperative performance criterion. Two additional macaques were trained an unspecified amount of time after surgeries that had been carried out for a previous experiment. One macaque had near-complete bilateral lesions of superior temporal cortex and one had a near-complete lesion on the right and a partial lesion on the left that spared a large part of the superior surface of posterior superior temporal cortex. Both of these previously lesioned macaques learned the task as quickly as the first two macaques had learned it before their surgeries. Evarts interpreted these findings as evidence that near-complete bilateral lesions of auditory cortex do not impair the initial learning or post-lesion retention of frequency discrimination. He found the results “difficult to reconcile with the strict tonotopic organization” found in primate auditory cortex and speculated that small remnants of remaining auditory cortex were “of great functional importance.” Inasmuch as Evarts’ task incorporated a frequency difference threshold corresponding to a Weber fraction of 164%, these experiments simply did not assess the role of auditory cortex in fine-grained frequency discrimination. J Neurophysiol • VOL
135
On the basis of animal lesion experiments on pure tone frequency discrimination and his demonstration of impaired virtual pitch perception following unilateral right anterior temporal lobectomy in patients with intractable epilepsy, Zatorre (1988) argued that “simple frequency discrimination (i.e., with pure tones, or with complex tones when the fundamental [frequency] is present) is not permanently disrupted even by large bilateral lesions of auditory cortex.” However, patients who committed more than 25% errors on a control task, in which complex tone fundamental frequencies (F0’s) were present, were excluded from the missing F0 task. In addition, the F0 differences tested by the method of constant stimuli (Weber fraction ⫽ 40%) were well above normal threshold (cf. Patterson 1973). Using a dichotic-diotic match-to-sample recognition task, Sidtis and Volpe (1988) found impaired complex pitch perception with F0 present in a population of right hemisphere stroke patients; they did not use pure tone stimuli nor did they report which gyri were lesioned. Robin et al. (1990) subsequently demonstrated elevations in the F0 difference threshold averaged across five stroke patients with lesions involving right TG and/or STG (mean Weber fraction approximately 14%); five patients with similar left-sided lesions had normal thresholds (mean Weber fraction, less than 1%). Among studies of bilateral auditory cortex lesion effects in humans, the two cases reported by Jerger and colleagues (1969, 1972) are some of the best studied psychoacoustically and most often cited. The first concerned a 21-yr-old ambidextrous man with successive left then right hemispheric strokes diagnosed on the basis of clinical history, examination, technetium brain scan, EEG, and cerebral arteriography. (CT and MRI were not yet available for routine clinical use.) Following the initial stroke, there was a mild language deficit, mild right facial weakness, and mild right-sided somesthetic loss. Following the second stroke seven months later, he became deaf. Within three months, pure-tone detection thresholds returned to near-normal levels. Abnormalities on technetium brain scan showed increased uptake in the left temporal and right temporoparietal regions. Although the resolution of nuclear brain scans does not permit precise localization of the lesions, the combination of sudden, transient deafness and these uptake abnormalities is consistent with bilateral lesions involving TG and surrounding cortex. Three months after the second stroke, a series of audiological tests and psychoacoustic experiments were carried out. The method of constant stimuli and a two-interval, twoalternative forced-choice paradigm were employed to assess the patient’s ability to determine whether the first of two pure tones was higher or lower in pitch than the second tone (Fc ⫽ 500 Hz, intensity ⫽ 80 dB SL, duration ⫽ 1,000 ms, presentations binaural and monaural). The frequency difference was fixed at a Weber fraction of 40% and the interstimulus interval (ISI) was parametrically varied. The patient was able to achieve the criterion performance of 75% accuracy at ISIs approximately equal to that employed in the present experiment. Thus Jerger et al. tested frequency direction discrimination approximately 40 times above the normal threshold we measured in our control group; case A1⫹ would have been able to reach criterion at this generous frequency difference. Jerger’s second case concerned a 62-yr-old man with impaired speech recognition and normal pure-tone detection thresholds in whom bilateral lesions of TG, posterior STG, and adjacent structures were subsequently documented at autopsy. Fre-
87 • JANUARY 2002 •
www.jn.org
136
M. J. TRAMO, G. D. SHAH, AND L. D. BRAIDA
quency direction discrimination was tested using the same paradigm, except the frequency difference was even greater (Weber fraction ⫽ 164%). As we would expect, this patient met the response criterion of 75% at ISIs similar to those used in the present experiments. The emphasis of Jerger’s experiments was on the effect of ISI manipulations on frequency discrimination; indeed, he found that frequency discrimination, even at this large frequency separation, was severely impaired at short ISIs. The observations of Efron (1963), Albert et al. (1972), and Tallal and colleagues (Tallal 1976, 1980; Tallal and Piercy 1974, 1975) indicate that left auditory cortex is specialized to process rapidly occurring spectral events; this may account, at least in part, for the auditory comprehension deficits observed in patients with sensory (Wernicke’s) aphasia and pure word deafness (Phillips and Farmer 1990; Selnes et al. 1983). The present results indicate that neural mechanisms within the auditory cortex are essential to fine-grained resolution in the spectral domain as well as the time domain. There is some precedent in the macaque and human literature to suggest that auditory cortex lesions coarsen frequency resolution. Massopust et al. (1967) measured frequency difference thresholds near 500 Hz in rhesus monkeys by stepping down Weber fractions from 164 to 0.6% as criterion performance (75% correct) was reached. Preoperatively, all macaques were able to reach criterion at Weber fractions of 3% or lower (about a semitone or less). Five macaques had partial, bilateral ablations of involving a third or more of superior temporal cortex with extension into the insula and/or pericentral operculum. Postoperatively, frequency difference thresholds increased in the range of 7–25 Hz from preoperative thresholds (Weber fractions increased between 1.4 and 4.9%), and the size of the increase correlated with the size of the lesion. Harrington et al. (2001) reported that two Japanese macaques with near-complete bilateral lesions of superior temporal cortex had pure tone frequency difference thresholds that were over twice those of two monkeys without lesions (center frequency near 625 Hz). The average Weber fraction associated with discrimination scores less than 0.80 [hit rate ⫺ (hit rate ⫻ false alarm rate)] was 5.8% compared with 2.4% in monkeys without superior temporal lesions. Divenyi and Robinson (1989) reported a mean Weber fraction of approximately 11% for frequency change discrimination in four right hemisphere stroke patients; the mean Weber fraction was about 3% in left hemisphere stroke patients and about 1% in eight normal controls. The anatomical location of the lesions with respect to TG and STG was not given. Tramo (1990) previously presented evidence of impaired frequency direction discrimination in case A1⫹ on the Seashore Measures of Musical Talents Pitch Discrimination subtest (Seashore et al. 1960). Poor performance was attributable to a high error rate in trials where the ⌬F between pure tones was smallest. Subsequently, preliminary studies employing an adaptive procedure showed elevated difference thresholds for frequency direction discrimination (Tramo et al. 1994). Kazui et al. (1990) measured frequency difference thresholds required to discriminate a change in the frequency of a continuous pure tone in a patient with bilateral temporal lobe lesions. Pure-tone detection thresholds for left ear stimulation were “abnormally high”; the method and criteria used to measure detection thresholds were not defined. Findings on CT and MRI were said to be consistent with acute “right temporal” and old “left J Neurophysiol • VOL
temporal stem and left parietal subcortex” ischemic infarcts. Our review of the six published MRI scans (3 sections in 2 planes) finds evidence of lesions involving left TG and STG as well as the white matter underlying right TG. Weber fractions for pure tones at 500, 1,000, and 2,000 Hz ranged from 6.5 to 14.5% in the left ear and 5.5 to 8.5% in the right ear. The range of threshold elevations observed by Kazui et al. overlapped that observed in case A1⫹ for frequency change discrimination in the present study (7% at 1,000 Hz). Recently, Johnsrude et al. (2000) reported that seven of eight patients with right anterior temporal lobectomies extending into right TG had elevated difference thresholds for frequency direction discrimination around 1 kHz. Weber fractions (mean ⫽ 10.8%) were approximately three times higher than those of left anterior temporal lobectomy patients and two times higher than those of right temporal lobectomy patients without TG involvement. Unlike Divenyi and Robinson’s right hemisphere stroke patients, Johnsrude’s patients with right TG and anterior STG excisions did not differ from normal controls and the other patient groups in a frequency change discrimination task. Taken together, these observations suggest that damage of right TG and STG in case A1⫹ is principally responsible for his deficit in frequency direction discrimination, and they raise the possibility that his impairment in frequency change discrimination is attributable to additive effects of right and left primary auditory cortex lesions. Impaired tonal consonance perception has previously been reported in case A1⫹ (Tramo et al. 1990). The elevations in frequency difference thresholds observed in the present study, combined with evidence of normal or near-normal roughness perception (Tramo et al. 2001), support the hypothesis that his bias to hear well-tuned musical chords as out of tune is attributable to a deficit in the fine-grained analysis of chord frequency components and, consequently, an inability to extract their harmonic relationships. Concluding remarks It is difficult to reconcile our experimental results and review of the literature with the traditional view that neuronal frequency selectivity in auditory cortex plays no role in frequency discrimination at the perceptual level. The auditory cortex, especially A1 and other subdivisions populated by sharplytuned neurons, makes an essential contribution to fine-grained frequency discrimination, akin to the contribution of somatosensory cortex to two-point tactile discrimination (Adams et al. 1997; Head and Holmes 1911; Mountcastle and Darian-Smith 1968). This basic aspect of auditory cortex function supports the perception of music, voice, speech, environmental sounds, and auditory objects in general. The authors gratefully acknowledge the contributions of A. Grant, D. Lemay, D. Lum, and W. Rabinowitz to the design and development of the experimental apparatus, A. Dix to subject recruitment and data collection, and B. Delgutte, M. C. Liberman, and D. Phillips for helpful comments on an earlier version of the manuscript. This work was supported by National Institute on Deafness and Other Communication Disorders Grants DC-03382 and DC-00071 (M. J. Tramo) and DC-00117 (L. D. Braida), by the McDonnell-Pew Program in Cognitive
87 • JANUARY 2002 •
www.jn.org
AUDITORY CORTEX AND FREQUENCY PROCESSING Neuroscience (M. J. Tramo), and by the Henry Ellis Warren Fund at MIT (L. D. Braida).
REFERENCES AALTONEN O, TUOMAINEN J, LAINE M, AND NIEMI P. Discrimination of speech and non-speech sounds by brain-damaged subjects: electrophysiological evidence for distinct sensory processes. Brain Lang 44: 139 –152, 1993. ADAMS RA, VICTOR M, AND ROPPER AH. Principles of Neurology (6th ed.). New York: McGraw-Hill, 1997. AITKIN LM, IRVINE DRF, AND WEBSTER WR. Central neural mechanisms of hearing. In: Handbook of Physiology. The Nervous System. Sensory Processes. Bethesda, MD: Am. Physiol. Soc., 1984, sect. 1, vol. III, part 2, p. 675–737. AKERT K, WOOLSEY CN, DIAMOND IT, AND NEFF WD. The cortical projection area of the posterior pole of the medial geniculate body in macaca mulatta. Anat Rec 133: 242, 1959. ALBERT ML, SPARKS R, STOCKERT TV, AND SAX D. A case study of auditory agnosia: linguistic and non-linguistic processing. Cortex 8: 427– 443, 1972. AAO-ACO (AMERICAN ACADEMY OF OTOLARYNGOLOGY AND AMERICAN COUNCIL OF OTOLARYNGOLOGY). Guide for evaluation of hearing handicap. JAMA 241: 2055–2059, 1979. BELIN P, ZATORRE RJ, LAFAILLE P, AHAD P, AND PIKE B. Voice-selective areas in human auditory cortex. Nature 403: 309 –312, 2000. BENTON AL, HAMSHER KD, VARNEY NR, AND SPREEN O. Judgment of Line Orientation. Form H. New York: Oxford, 1983. BINDER JR, RAO SM, HAMMEKE TA, YETKIN FZ, JESMANOWICZ A, BANDETTINI PA, WONG EC, ESTKOWSKI LD, GOLDSTEIN MD, HAUGHTON VM, AND HYDE JS. Functional magnetic resonance imaging of human auditory cortex. Ann Neurol 35: 662– 672, 1994. BONIN G AND BAILEY P. The Neocortex of Macaca mulata. Urbana, IL: University of Illinois Press, 1947. BRODMANN K. Vergleichende Lokalisationslehre der Groshirnrinde. Leipzig, Germany: Verlag von Johann Ambrosius Barth, 1909. BRUGGE JF AND REALE RA. Auditory cortex. In: The Cerebral Cortex, Auditory and Association Cortices, edited by Peters A and Jones EG. New York: Plenum, 1985, vol. 4, p. 229 –271. BURTON H AND JONES EG. The posterior thalamic region and its cortical projection in new world and old world monkeys. J Comp Neurol 168: 249 –302, 1976. BUTLER RA. Effect of changes in stimulus frequency and intensity on habituation of the human vertex potential. J Acoust Soc Am 44: 945–950, 1968. CAMPAIN R AND MINCKLER J. A note on the gross configurations of the human auditory cortex. Brain Lang 3: 318 –323, 1976. CAMPBELL AW. Histological Studies on the Localization of Cerebral Function. Cambridge, UK: University Press, 1905. CANSINO S, WILLIAMSON SJ, AND KARRON D. Tonotopic organization of human auditory association cortex. Brain Res 663: 38 –50, 1994. CELESIA GG. Organization of auditory cortical areas in man. Brain 99: 403– 414, 1976. CELESIA GG, BROUGHTON RJ, RASMUSSEN T, AND BRANCH C. Auditory evoked responses from the exposed human cortex. Electroencephalogr Clin Neurophysiol 24: 458 – 466, 1968. CELESIA GG AND PULETTI F. Auditory cortical areas of man. Neurology 19: 211–220, 1969. CHOW KL. A retrograde cell degeneration study of the cortical projection field of the pulvinar in the monkey. J Comp Neurol 93: 313–340, 1950. CLAREY JC, BARONE P, AND IMIG TJ. Physiology of thalamus and cortex. In: The Mammalian Auditory Pathway: Neurophysiology, edited by Popper AN and Fay RR. New York: Springer, 1992, p. 232–334. CLARK WELG. The thalamic connections of the temporal lobe of the brain in the monkey. Anatomy 70: 447– 464, 1936. CLARK WELG AND NORTHFIELD DWC. The cortical projection of the pulvinar in the macaque monkey. Brain 60: 126 –142, 1937. CSE´ PE V, PANTEV C, HOKE M, HAMPSON S, AND ROSS B. Evoked magnetic responses of the human auditory cortex to minor pitch changes: localization of the mismatch field. Electroencephalogr Clin Neurophysiol 84: 538 –548, 1992. DE RIBAUPIERRE F. Acoustical information processing in the auditory thalamus and cerebral cortex. In: The Central Auditory System, edited by Ehret G and Romand R. New York: Oxford Univ. Press, 1997, p. 317–397. DIVENYI PL AND ROBINSON AJ. Nonlinguistic auditory capabilities in aphasia. Brain Lang 37: 290 –326, 1989. J Neurophysiol • VOL
137
ECONOMO C. The Cytoarchitectonics of the Human Cerebral Cortex. Edinburg, UK: Humphrey Milford, Oxford Univ. Press, 1929. EFRON R. Temporal perception, aphasia, and deja vu. Brain 86: 403– 424, 1963. ELBERLING C, BAK C, KOFOED B, LEBECH J, AND SAERMARK K. Auditory magnetic fields: source location and “tonotopical organization” in the right hemisphere of the human brain. Scan Audiol 11: 61– 65, 1982. ELLIOT DN AND TRAHIOTIS C. Cortical lesions and auditory discrimination. Psychol Bull 77: 198 –222, 1972. EVARTS EV. Effect of auditory cortex ablation on auditory-visual association in monkey. J Neurophysiol 15: 435– 441, 1952a. EVARTS EV. Effect of auditory cortex ablation on frequency discrimination in monkey. J Neurophysiol 15: 443– 448, 1952b. GALABURDA A AND SANIDES F. Cytoarchitectonic organization of the human auditory cortex. J Comp Neurol 190: 597– 610, 1980. GALLEN CC, SOBEL DF, LEWINE JD, SANDERS JA, HART BL, DAVIS LE, AND ORRISON WW JR. Neuromagnetic mapping of brain function. Radiology 187: 863– 867, 1993. GESHEIDER GA, BOLANOSKI SJ JR, VERRILLO RT, ARPAJIAN DJ, AND RYAN TF. Vibrotactile intensity discrimination measured by three methods. J Acoust Soc Am 87: 330 –338, 1990. GIARD MH, PERRIN F, ECHALLIER JF, THEVENET M, FROMENT JC, AND PERNIER J. Dissociation of temporal and frontal components in the human auditory N1 wave: a scalp current density and dipole model analysis. Electroencephalogr Clin Neurophysiol 92: 238 –252, 1994. GRAHAM J, GREENWOOD R, AND LECKY B. Cortical deafness. J Neurolog Sci 48: 35– 49, 1980. GUTTMAN N AND DIAMOND IT. Unpublished experiments. 1963. Cited by Neff et al. (1975). HACKETT TA, STEPNIEWSKA I, AND KAAS JH. Subdivisions of auditory cortex and ipsilateral cortical connections of the parabelt auditory cortex in macaque monkeys. J Comp Neurol 394: 475– 495, 1998. HARI R, HAMALAINEN M, ILMONIEMI R, KAUKORANTA E, REINKAINEN K, ¨ ANEN ¨ SALMINEN J, ALHO K, NA¨ AT R, AND SAMS M. Responses of the primary auditory cortex to pitch changes in a sequence of tone pips: neuromagnetic recordings in man. Neurosci Lett 50: 127–132, 1984. HARRINGTON IA, HEFFNER RS, AND HEFFNER HE. An investigation of sensory deficits underlying the aphasia-like behavior of macaques with auditory cortex lesions. Neuroreport 12: 1217–1221, 2001. HASHIKAWA T, MOLINARI M, RAUSELL E, AND JONES EG. Patchy and laminar terminations of medial geniculate axons in monkey auditory cortex. J Comp Neurol 362: 195–208, 1995. HASHIKAWA T, OJIMA H, AND JONES EG. Differential cortical projections from subnuclei of monkey medial geniculate complex revealed by anterograde transport of PHA-L. Soc Neurosci Abstr 18: 1038, 1992. HEAD H AND HOLMES G. Sensory disturbances from cerebral lesions. Brain 34: 120 –254, 1911. HOWARD MA, VOLKOV IO, ABBAS PJ, DAMASIO H, OLLENDIECK MC, AND GRANNER MA. A chronic microelectrode investigation of the tonotopic organization of human auditory cortex. Brain Res 724: 260 –264, 1996. HOWARD MA, VOLKOV IO, MIRSKY R, GARELL PC, NOH MD, GRANNER M, DAMASIO H, STEINSCHNEIDER M, REALE RA, HIND JE, AND BRUGGE JF. Auditory cortex on the human posterior superior temporal gyrus. J Comp Neurol 416: 79 –92, 2000. HUOTILAINEN M, TIITINEN H, LAVIKAINEN J, ILMONIEMI RJ, PEKKONEN E, SINKKONEN J, LAINE P, AND NAATANEN R. Sustained fields of tones and glides reflect tonotopy of the auditory cortex. Neuroreport 6: 841– 844, 1995. INTERNATIONAL STANDARDS ORGANIZATION. Standard Reference Zero for the Calibration of Pure-Tone Audiometers 389. NY: ISO, 1975. JERGER J, LOVERING L, AND WERTZ M. Auditory disorder following bilateral temporal lobe insult: report of a case. J Speech Hear Disorders 37: 523–535, 1972. JERGER J, WEIKERS NJ, SHARBROUGH FW, AND JERGER S. Bilateral lesions of the temporal lobe: a case study. Acta Otolaryngol Suppl 258: 1–51, 1969. JOHNSRUDE IS, PENHUNE VB, AND ZATORRE RJ. Functional specificity of in the right human auditory cortex for perceiving pitch direction. Brain 123: 155–163, 2000. JONES EG AND BURTON H. AreaI differences in the laminar distribution of thalamic afferents in cortical fields of the insular, parietal and temporal regions of primates. J Comp Neurol 168: 197–248, 1976. JONES EG, DELL’ANNA E, MOLINARI M, RAUSELL E, AND HASHIKAWA T. Subdivisions of macaque monkey auditory cortex revealed by calcium binding protein immunoreactivity. J Comp Neurol 362: 1–19, 1995.
87 • JANUARY 2002 •
www.jn.org
138
M. J. TRAMO, G. D. SHAH, AND L. D. BRAIDA
KAAS JH, HACKET TA, AND TRAMO MJ. Auditory processing in primate cerebral cortex. Curr Opin Neurobiol 9: 164 –170, 1999. KAZUI S, NARITOMI H, SAWADA T, AND INOUE N. Subcortical auditory agnosia. Brain Lang 38: 476 – 487, 1990. KILENY P, PACCIORETTI D, AND WILSON AF. Effects of cortical lesions on middle-latency auditory evoked responses. Electroencephalogr Clin Neurophysiol 66: 108 –120, 1987. KNIGHT RT, SCABINI D, WOODS DL, AND CLAYWORTH C. The effects of lesions of superior temporal gyrus and inferior parietal lobe on temporal and vertex component of the human AEP. Electroencephalogr Clin Neurophysiol 70: 499 –509, 1988. KOSAKI H, HASHIKAWA T, HE J, AND JONES EG. Tonotopic organization of auditory cortical fields delineated by parvalbumin immunoreactivity in Macaque monkeys. J Comp Neurol 386: 304 –316, 1997. KRAUS N, OZDAMAR O, HIER D, AND STEIN L. Auditory middle latency responses (MLRs) in patients with cortical lesions. Electroencephalogr Clin Neurophysiol 54: 275–287, 1982. KURIKI S, OKITA Y, AND HIRATA Y. Source analysis of magnetic field responses from the human auditory cortex elicited by short speech sounds. Exp Brain Res 104: 144 –152, 1995. KUSSMAUL CL, TRAMO MJ, AND MANGUN GR. Investigation of harmonic relationships on auditory ERPS to successive pure tones (Abstract). Psychophysiology 29: S47, 1992. LAUTER JL, HERSCOVITCH P, FORMBY C, AND RAICHLE ME. Tonotopic organization in human auditory cortex revealed by positron emission tomography. Hear Res 2: 199 –205, 1985. LAVIKAINEN J, HUOTILAINEN M, ILMONIEMI RJ, SIMOLA JT, AND NAATANEN R. Pitch change of a continuous tone activates two distinct processes in human auditory cortex: a study with whole-head magnetometer. Electroencephalogr Clin Neurophysiol 96: 93–96, 1995. LEE YS, LUEDERS H, DINNER DS, LESSER RP, HAHN J, AND KLEM G. Recording of auditory evoked potentials in man using chronic sudural electrodes. Brain 107: 115–131, 1984. LEVITT H. Transformed up-down methods in psychoacoustics. J Acoust Soc Am 49: 467– 477, 1970. LIE´ GOIS-CHAUVEL C, LAGUITTON V, BADIER JM, SCHWARTZ D, AND CHAUVEL P. E´ tude des m´ecanismes corticaux de la perception auditive chez l’homme: apporte des potentiels intrac´er´ebraux et des chams magn´etiques e´ voqu´es par les stimulations auditives. Rev Neurol 151: 495–504, 1995. LIE´ GOIS-CHAUVEL C, MUSOLINO A, BADIER JM, MARQUIS P, AND CHAUVEL P. Evoked potentials recorded from the auditory cortex in man: evaluation and topography. Electroencephalogr Clin Neurophysiol 92: 204 –214, 1994. LIE´ GOIS-CHAUVEL C, MUSOLINO A, AND CHAUVEL P. Localization of the primary auditory area in man. Brain 114: 139 –153, 1991. LOCKE S. The projection of the medial pulvinar of the macaque. J Comp Neurol 115: 155–170, 1960. MAKELA JP. Auditory evoked magnetic fields in stroke. Physiol Measure 14: A51–A54, 1993. MAKELA JP AND HARI R. Neuromagnetic auditory evoked responses after a stroke in the right temporal lobe. Neuroreport 3: 94 –96, 1992. MASSOPUST JLC, WOLIN LR, MEDER R, AND FROST V. Changes in auditory frequency discrimination thresholds after temporal cortex ablations. Exp Neurol 19: 245–255, 1967. MAZZIOTTA JC, PHELPS ME, CARSON RE, AND KUHL DE. Tomographic mapping of human cerebral metabolism: auditory stimulation. Neurology 32: 921–937, 1982. MENDEZ MF AND GEEHAN GR. Cortical auditory disorders: clinical and psychoacoustic features. J Neurol Neurosurg Psychiatry 51: 1–9, 1988. MERZENICH MM AND BRUGGE JF. Representation of the cochlear partition on the superior temporal plane of the macaque monkey. Brain Res 50: 275–296, 1973. MESULAM M AND PANDYA D. The projections of the medial geniculate complex within the sylvian fissure of the rhesus monkey. Brain Res 60: 315–333, 1973. MOLINARI M, DELL’ANNA ME, RAUSELL E, LEGGIO MG, HASHIKAWA T, AND JONES EG. Auditory thalamocortical pathways defined in monkeys by calcium-binding protein immunoreactivity. J Comp Neurol 362: 171–194, 1995. MOORE BCJ. Frequency difference limens for short-duration tones. J Acoust Soc Am 54: 610 – 619, 1973. MOREL A, GARRAGHTY PE, AND KAAS JH. Tonotopic organization, architectonic fields, and connections of auditory cortex in macaque monkeys. J Comp Neurol 335: 437– 459, 1993. J Neurophysiol • VOL
MOUNTCASTLE VB AND DARIAN-SMITH I. Neural mechanisms in somesthesia. In: Medical Physiology (12th ed.), edited by Mountcastle VB. St. Louis, MO: Mosby, 1968, vol. II, p. 1372–1423. MUSIEK FE, BARAN JA, AND PINHEIRO ML. Neuroaudiology Case Studies. San Diego, CA: Singular Publishing Group, 1994. MUSIEK FE AND REEVES AG. Asymmetries of the auditory areas of the cerebrum. J Am Acad Audiol 1: 240 –245, 1990. NAKASATO N, FUJITA S, SEKI K, KAWAMURA T, MATANI A, TAMURA I, FUJIWARA S, AND YOSHIMOTO T. Functional localization of bilateral auditory cortices using an MRI-linked whole head magnetoencephalography (MEG) system. Electroencephalogr Clin Neurophysiol 94: 181–190, 1995. NEFF WD, DIAMOND IT, AND CASSEDAY JH. Behavioral Studies of Auditory Discrimination: Central Nervous System. Berlin: Springer-Verlag, 1975, p. 307– 400. PANDYA DN, ROSENE DL, AND DOOLITTLE AM. Corticothalamic connections of auditory-related areas of the temporal lobe in the rhesus monkey. J Comp Neurol 345: 447– 471, 1994. PANDYA DN AND SANIDES F. Architectonic parcellation of the temporal operculum in rhesus monkey and its projection pattern. Z Anat Entwicklungsgesch 139: 127–161, 1973. PANDYA DN AND YETERIAN EH. Architecture and connections of cortical association areas. In: The Cerebral Cortex. Auditory and Association Cortices, edited by Peters A and Jones EG. New York: Plenum, 1985, vol. 4, p. 3– 61. PANTEV C, BERTRAND O, EULITZ C, VERKINDT C, HAMPSON S, SHCUIERER G, AND ELBERT T. Specific tonotopic organizations of different areas of the human auditory cortex revealed by simultaneous magnetic and electric recordings. Electroencephalogr Clin Neurophysiol 94: 26 – 40, 1995. PANTEV C, HOKE M, LEHNERTZ K, LUTKENHONER B, ANOGIANAKIS G, AND WITTOWSKI W. Tonotopic organization of the human auditory cortex revealed by transient auditory evoked magnetic fields. Electroencephalogr Clin Neurophysiol 69: 160 –170, 1988. PATTERSON RD. The effects of relative phase and the number of components on residue pitch. J Acoust Soc Am 53: 1555–1572, 1973. PENHUNE VB, ZATORRE RJ, MACDONALD JD, AND EVANS AC. Interhemispheric anatomical differences in human primary auditory cortex: probabilistic mapping and volume measurement from MR scans. Cereb Cortex 6: 661– 672, 1996. PFINGST BE AND O’CONNOR TA. Characteristics of neurons in auditory cortex of monkeys performing a simple auditory task. J Neurophysiol 45: 16 –34, 1981. PHILLIPS DP AND FARMER ME. Acquired word deafness, and the temporal grain of sound representation in the primary auditory cortex. Behav Brain Res 40: 85–94, 1990. PHILLIPS DP, REALE RA, AND BRUGGE JF. Stimulus processing in the auditory cortex. In: Neurobiology of Hearing: The Central Auditory System, edited by Altschuler RA, Bobbin RP, Clopton BM, and Hoffman DW. New York: Raven, 1991, p. 335–365. POLIAK S. The Main Afferent Fiber Systems of the Cerebral Cortex in Primates. Berkeley, CA: University of California, 1932. POREMBA A, SAUNDERS RC, CRANE AM, ALITTO HJ, COOK M, SOKOLOFF L, 14 AND MISHKIN M. Mapping the primate auditory system with ( C)2-deoxyglucose. Soc Neurosci Abstr 25: 1420, 1999. PRAAMSTRA P, STEGEMAN DF, KOOIJMAN S, AND MOLEMAN J. Evoked potential measures of auditory cortical function and auditory comprehension in aphasia. J Neurolog Sci 115: 32– 46, 1993. RADEMACHER J, CAVINESS VS, STEINMETZ H, AND GALABURDA AM. Topographical variation of the primary cortices: implications for neuroimaging, brain mapping, and neurobiology. Cereb Cortex 3: 313–329, 1993. RAUSCHECKER JF, TIAN B, AND HAUSER MD. Processing of complex sounds in the macaque nonprimary auditory cortex. Science 268: 111–114, 1995. RAUSCHECKER JP, TIAN B, PONS T, AND MISHKIN M. Serial and parallel processing in rhesus monkey auditory cortex. J Comp Neurol 382: 89 –103, 1997. RECANZONE GH, GUARD DC, AND PHAN ML. Frequency and intensity response properties of single neurons in the auditory cortex of the behaving macaque monkey. J Neurophysiol 83: 2315–2331, 2000. RECANZONE GH, SCHREINER CE, AND MERZENICH MM. Plasticity in the frequency representation of primary auditory cortex following discrimination training in adult owl monkeys. J Neurosci 13: 87–103, 1993. REITE M, ADAMS M, SIMON J, TEALE P, SHEEDER J, RICHARDSON D, AND GRABBE R. Auditory M100 component. I. Relationship to Heschl’s gyri. Cognit Brain Res 2: 13–20, 1994.
87 • JANUARY 2002 •
www.jn.org
AUDITORY CORTEX AND FREQUENCY PROCESSING ROBIN DA, TRANEL D, AND DAMASIO H. Auditory perception of temporal and spectral events in patients with focal left and right cerebral lesions. Brain Lang 39: 539 –555, 1990. ROMANI GL, WILLIAMSON SJ, AND KAUFMAN L. Tonotopic organization of the human auditory cortex. Science 216: 1339 –1340, 1982a. ROMANI GL, WILLIAMSON SJ, KAUFMAN L, AND BRENNER D. Characterization of the human auditory cortex by the neuromagnetic method. Exp Brain Res 47: 381–393, 1982b. SAMS M, PAAVILAINEN P, ALHO K, AND NAATANEN R. Auditory frequency discrimination and event-related potentials. Electroencephalogr Clin Neurophysiol 62: 437– 448, 1985. SAMS M AND SALMELIN R. Evidence of sharp frequency tuning in the human auditory cortex. Hear Res 75: 67–74, 1994. SAMSON S AND ZATORRE RJ. Contribution of the right temporal lobe to musical timbre discrimination. Neuropsychologia 32: 231–240, 1994. SANIDES F. Representation in the Cerebral Cortex and Its Areal Lamination Pattern. New York: Academic, 1972, p. 329 – 453. SCHERG M AND CRAMON DV. Two bilateral sources of the late AEP as identified by a spatio-temporal dipole model. Electroencephalogr Clin Neurophysiol 62: 32– 44, 1985. SCHERG M, VAJSAR J, AND PICTON TW. A source analysis of the late human auditory evoked potentials. J Cognit Neurosci 1: 336 –355, 1989. SCHREINER CE. Fuctional organization of the auditory cortex: maps and mechanisms. Curr Opin Neurobiol 2: 516 –521, 1992. SEASHORE CE, LEWIS D, AND SAETVEIT J. Seashore Measures of Musical Talent (Revised). New York: Psychological Corporation, 1960. SELNES OA, KOPMAN DS, NICCUM N, RUBENS AB, AND LARSON D. Computed tomographic scan correlates of auditory comprehension deficits in aphasia: a prospective recovery study. Ann Neurol 13: 558 –566, 1983. SIDTIS JJ AND VOLPE BT. Selective loss of complex pitch or speech discrimination after unilateral lesion. Brain Lang 34: 235–245, 1988. SINNOT JM AND BROWN CH. Effects of varying signal duration on pure-tone frequency discrimination in humans and monkeys. J Acoust Soc Am 93L: 1541–1546, 1993. SIQUEIRA EB. The temporo-pulvinar connections in the rhesus monkey. Arch Neurol 13: 321–330, 1965. STRAINER JC, ULMER JL, YETKIN FZ, HAUGHTON VM, DANIELS DL, AND MILLEN SJ. Functional MR of the primary auditory cortex: an analysis of pure tone activation and tone discrimination. Am J Neuroradiol 18: 601– 610, 1997. TALAVAGE TM, LEDDEN PJ, BENSON RR, ROSEN BR, AND MELCHER JR. Frequency-dependent responses exhibited by multiple regions in human auditory cortex. Hear Res 150: 225–244, 2000. TALLAL P. Rapid auditory processing in normal and disordered language development. J Speech Hear Res 3: 561–571, 1976. TALLAL P. Auditory temporal perception, phonics, and reading disabilities in children. Brain Lang 9: 182–198, 1980.
J Neurophysiol • VOL
139
TALLAL P AND PIERCY M. Developmental aphasia: rate of auditory processing and selective impairment of consonant perception. Neuropsychologia 12: 83–93, 1974. TALLAL P AND PIERCY M. Developmental aphasia: the perception of brief vowels and extended stop consonants. Neuropsychologia 13: 69 –74, 1975. TIITINEN H, ALHO K, HUOTILAINEN M, ILMONIEMI RJ, SIMOLA J, AND NAATANEN R. Tonotopic auditory cortex and the magnetoencephalographic (MEG) equivalent of mismatch negativity. Psychophysiology 30: 537–540, 1993. TRAMO MJ. Impaired perception of relative pure tone pitch following bilateral lesions of auditory cortex in man. Soc Neurosci Abstr 16: 580, 1990. TRAMO MJ. Neural Representations of Acoustic Information in Relation to Music and Voice Perception (PhD dissertation). Cambridge, MA: Harvard Univ. Press, 1998. TRAMO MJ, BHARUCHA JJ, AND MUSIEK FE. Music perception and cognition following bilateral lesions of auditory cortex. J Cognit Neurosci 2: 195–212, 1990. TRAMO MJ, CARIANI PA, AND MORARU D. Spectrotemporal response properties of auditory cortex neurons in the alert macaque. Assoc Res Otolaryngol Abstracts, 116 –117, 1999. TRAMO MJ, CARIANI PA, DELGUTTE B, AND BRAIDA LD. Neurobiological foundations for the theory of harmony in western tonal music. Ann NY Acad Sci 930: 92–116, 2001. TRAMO MJ, GRANT A, AND BRAIDA LD. Psychophysical measurements of frequency difference limens for relative pitch discrimination reveal a deficit following bilateral lesions of auditory cortex. Soc Neurosci Abstr 20: 325, 1994. VERKINDT C, BERTRAND O, PERRIN F, ECHALLIER J, AND PERNIER J. Tonotopic organization of the human auditory cortex: N100 topography and multiple dipole model analysis. Electroencephalogr Clin Neurophysiol 96: 143–156, 1995. WALKER AE. The projection of the medial geniculate body to the cerebral cortex in the macaque monkey. J Anat 71: 319 –331, 1937. WESSINGER CM, BUONOCORE MH, KUSSMAUL CL, AND MANGUN GR. Tonotopy in human auditory cortex examined with functional magenetic resonance imaging. Hum Brain Map 5: 18 –25, 1997. WESSINGER CM, VANMETER J, TIAN B, VAN LARE J, PEKAR J, AND RAUSCHECKER JP. Hierarchical organization of the human auditory cortex revealed by functional magnetic resonance imaging. J Cognit Neurosci 13: 1–7, 2001. YAMAMOTO T, UEMURA T, AND LLINAS R. Tonotopic organization of human auditory cortex revealed by multi-channel SQUID system. Acta Otolaryngol 112: 201–204, 1992. YANTIS PA. Puretone air-conduction threshold testing. In: Handbook of Clinical Audiology, edited by Katz J, Gabbay WL, Gold S, Medwetsky L, and Ruth RA. Baltimore, MD: Williams and Wilkins, 1994, p. 97–108. ZATORRE RJ. Pitch perception of complex tones and human temporal-lobe function. J Acoust Soc Am 84: 566 –572, 1988.
87 • JANUARY 2002 •
www.jn.org