previously evaluated on standalone devices with good results [1-2]. However, most ... discrete steps such that a current signature is generated. Philips Semiconductors1 ... A wireless device consists of a digital baseband part, and the radio part ...
Functional vs. Multi-VDD Testing of RF Circuits Estella Silva1, José Pineda de Gyvez2, Guido Gronthoud2 Philips Semiconductors1 CTO - Design Technology Group 1120 Ringwood Ct. San Jose CA, 95131-1706 Abstract. In this paper we present a comparison of the results obtained between functional testing and applying the multi-VDD approach on an RF circuit. The multi-VDD approach incorporates both VDD ramp and DC ramp techniques. The VDD ramp technique has been previously evaluated on standalone devices with good results [1-2]. However, most of the work has been accomplished in the Lab. Here we present results obtained by applying the concepts in a production environment. Correlations between the functional and the multi-VDD methodologies are shown. The studies are conducted using a WLAN 802.11a transceiver.
1. Introduction Functional testing checks for the product’s performance against its specifications. The functional test requirements of RF circuits often include complex instrumentation, procedures and algorithms [1]. There is also the so-called “black-book-of-RF-secrets” which emphasizes that even if functional test methods and descriptions are known, experience still plays a huge factor in quick test development. The conventional test flow of an RF device, where functional tests are predominant, is significant in increasing the RF device’s test complexity, and overall test cost. Methodologies that offer less complicated techniques and equipment, that entail less development time, and that achieve the same or even better results, in terms of test coverage, are continuously being evaluated to challenge the current approach to RF device testing [2]. Structural testing of RF devices is one such approach [3-6]. The multi VDD technique is an example of a structural test approach that is further evaluated here on a complex RF device [7]. The difference between functional testing and structural testing is that the ATPG in structural testing is derived from the circuit implementation rather than from the circuit specification. The VDD ramp method is a form of a quiescent current test technique [8]. It consists of selecting multiple power supply points and observing the corresponding Paper 17.2
Philips Research Labs2 5656 AA Eindhoven, The Netherlands
quiescent current signatures. In prior related work [910] this method of structural testing was found to yield fault coverage results comparable to functional tests which makes it a potential and attractive alternative for production wafer testing, mainly due to its low cost, low test times and low frequency requirements. The DC ramp method is similar in concept, except that the focus is not only on supply voltages and currents, nor are the measurements done only at quiescent conditions. In this technique, a voltage or current is swept and the I/V signatures at the same points in the circuit or at the circuit output are observed. In previous work we examined the effectiveness of the multi-VDD approach on simple devices, namely, and LNA and a PLL [9-10]. In this paper, evaluations of the DC ramp method is conducted using an RF transceiver to assess the effectiveness of the approach on a more complex, highly integrated device.
Vdd
subthreshold linear saturation
Idd B
time
C
A Vdd
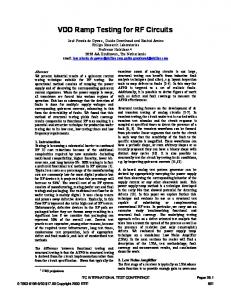
Figure 1. Power supply ramp with corresponding quiescent current signature
2. VDD ramp prior art [9-10] The VDD ramp technique is illustrated in Figure 1. It basically consists of ramping up the power supply in discrete steps such that a current signature is generated.
INTERNATIONAL TEST CONFERENCE 0-7803-9039-3/$20.00 © 2005 IEEE
1
When the power supply is discretely ramped up, all transistors in the circuit pass through several regions of operation, e.g. subthreshold (region A), linear (region B), and saturation (region C). The advantage of a transition from region to region is that defects can be detected with distinct accuracy in each of the operating regions, e.g. a bridge drains a distinct current depending upon whether the transistors are saturated or in the linear region. This method provides, thus, multiple observation points. It is simple; it is not a functional test and can easily be implemented in any tester. Observe that the typical current signature of an analog circuit follows a tanh function. It is expected that a defective device will present an abnormal current signature, e.g. a signature that deviates from the golden tanh form. Hence, a simple pass/fail test procedure can be put in place by comparing signatures. If fault diagnosis is desired, a fault dictionary database can be built and then the tested current signatures can be matched against signatures in this database.
oscillator. The PLL is a very useful building block in communication systems and represents a blend of digital and analog techniques all in one package. It contains a phase detector, an amplifier, and a VCO. The following illustration presents the VDD ramp signatures obtained from a PLL.
Prior evaluations of this technique have been performed on an LNA[9] and a PLL[10]. An LNA is the first stage of a receiver whose main function is to provide enough gain to overcome the noise of subsequent stages (such as a mixer). Results of this study indicated a fault coverage for bridges of 88% using only the power supply ramp test method compared to 75% if only the LNA's voltage gain is measured, or to 83% if the LNA's Noise Figure is observed. If a combined functional gain and noise-figure test was carried out then the corresponding fault coverage was about 86%, while the combined structural test of the power supply ramp and the dc-voltage test gave a better coverage of 94%. The following illustration presents the VDD ramp signatures obtained from an LNA.
Figure 3. Measured PLL signature. Traces correspond to power supply and to voltage drop across a power pin resistor [10].
350 300 LNA1
IDDq [uA]
250
LNA2 LNA4
200
LNA5 LNA6 LNA7
150
LNA8
Power supply voltage
Voltage drop
The main idea to test the PLL was to provide a sawtooth signal to the power supply pin VDD with a steady frequency related to the nominal reference clock frequency. Therefore the IDD current signature and the CCO’s control output voltage, VOSC, are measured by sampling the respective signatures at different established test points. Obtained results concerning the cumulative fault coverage of the three main tests with reference to the sampling points gave a very high coverage of 86.0% and 88.75%
3. Circuit under Test: WLAN transceiver A transceiver, as the name implies, is composed of both the transmitter and receiver in a single chip. It applies to wireless communications devices such as cellular telephones, cordless telephone sets, handheld two-way radios, and mobile two-way radios. In some instances, it can also reference transmitter/receiver devices in cable or optical fiber systems. In this report, the focus is more on wireless communication devices.
LNA9
100
LNA10 LNA11
50 0 0
0.2
0.4
0.6
0.8
1
1.2
1.4
1.6
1.8
2
Power supply [V]
Figure 2. Measured LNA signatures [9] A Phase-Locked Loop (PLL) is basically a closed loop frequency control system, whose function is based on the phase sensitive detection of phase difference between the input and output signals of a controlled Paper 17.2
A wireless device consists of a digital baseband part, and the radio part - which includes the RF front-end and RF analog blocks. The transceiver is the fundamental element that makes up the radio part. The two types of transceivers are: half-duplex and full duplex. In a halfduplex type transceiver, the receiver is turned off while transmitting, and vice versa. Transmission and reception often, but not always, are done on the same frequency. A full duplex type allows reception of signals during transmission periods, but requires that
INTERNATIONAL TEST CONFERENCE
2
the transmitter and receiver operate on substantially different frequencies so the transmitted signal does not interfere with reception. Cellular and cordless telephone sets use this mode. Transceiver architectures also vary, but the particular transceiver used for the study, is a fully integrated, direct conversion type for 2.45 GHz wireless LAN (802.11b WLAN) applications. The WLAN standard refers to a family of specifications developed by the IEEE for wireless LAN technology. 802.11 specifies an over-the-air interface between a wireless client and a base station or between two wireless clients. The different specifications in the 802.11 family are: 802.11 - which provides 1 or 2 Mbps transmission in the 2.4 GHz band using either frequency hopping spread spectrum (FHSS) or direct sequence spread spectrum (DSSS), 802.11a – which is an extension to 802.11 provides up to 54 Mbps in the 5GHz band, using orthogonal frequency division multiplexing (OFDM) encoding scheme, 802.11b (also referred to as 802.11 High Rate or Wi-Fi) is an extension to 802.11 that provides 11 Mbps transmission in the 2.4 GHz band using only DSSS, and 802.11g which provides 20+ Mbps in the 2.4 GHz band.
channel 1 uses the frequency range from 2.401 GHz to 2.423 GHz, channel 6 uses the frequency range from 2.426 GHz to 2.448 GHz, and channel 11 uses the frequency range from 2.451 GHz to 2.473 GHz. For example, when an antenna receives a signal on channel 1, it passes to the receiver through a transmit/receive (T/R) switch, is filtered by a dielectric bandpass filter, and enters the transceiver via a matching network to the on-chip front-end low-noise amplifier (LNA). The transmitter inputs of the WLAN transceiver may be driven in analog mode, as differential I and Q input current signals or in digital mode, as single-ended binary data inputs. The receiver path input stage of the transceiver, the RF LNA, has differential inputs, and in case of single-ended operation, an external balun is needed. A balun joins a balanced line (one that has two conductors, with equal currents in opposite directions) to an unbalanced line (one that has just one conductor and a ground. A three line bi-directional bus is used to program the circuit by running appropriate digital patterns.
4. Functional Testing of the RF Transceiver Specifically for the WLAN transceiver functional test, the transmit chain (TX), receive chain (RX), as well as the synthesizer, which is the local oscillator for both TX and RX, are measured against specifications. Usually, the TX and RX response against specifications already gives an indication of the functionality of the subblocks that comprise both TX and RX chains. In the case of the synthesizer, the essential components are checked block per block. For the WLAN transceiver, test modes are defined to enable block specific testing, which can be programmed into the device through the Three Wire Bus (3WB) serial interface. The following outlines some of the important tests of the WLAN transceiver.
Figure 4. Block Diagram of the WLAN transceiver
The block diagram of the WLAN transceiver under study [11] is shown in Figure 4. It integrates a complete receiver and transmitter, complete channel filtering in the Rx, spectrum conditioning filtering in the Tx, a 1.25-GHz fractional- N synthesizer, a fully integrated VCO and doubler, a predriver amplifier with +5-dBm output power, and calibration loops that reduce the LO leakage in the transmitter that set the gain in the Rx. Both IEEE 802.11 and IEEE 802.11b use three 22MHz-wide channels in the 2.40-to-2.45-GHz industrialscientific-medical (ISM) band. These channels are centered at 2.412, 2.437, and 2.462 GHz. Therefore, Paper 17.2
Synthesis Tests: This test targets the Crystal Oscillator (XO), Charge Pump (CP), and Voltage Controlled Oscillator (VCO) blocks. Measurements are done while the device is in WAIT mode. Part of the test flow checks the Reference Clock output power, which is checked by sourcing a 44MHz/0dBm signal to the crystal and measuring the power level at the reference clock out pin using a power meter. Dividers are then checked. This is done by programming the divider to the required state, then applying an analog signal of specified frequency at the input, and the output frequency is measured. The divider ratio (output over input) is then calculated. The charge pump (CP) gain, variation and matching are measured by setting the device to charge pump test
INTERNATIONAL TEST CONFERENCE
3
mode, and forcing a range of voltages (low, mid, high) to the CP input & measuring the resulting currents. When testing the VCO, its frequency range, bandwidth and overlap are measured by forcing a tuning voltage level at the voltage control pin of the VCO and measuring the frequency at the observation pin. For the WLAN transceiver, this is the lock pin. The VCO settings are adjusted to test all bands. VCO calibration and VCO frequency are checked by setting the voltage control at a particular voltage point (V1), driving an input signal of specified frequency and power, programming the dividers for the required frequency and then measuring the output frequency (F1) of the VCO. The same measurement is done for a second voltage point (V2 and F2). The VCO calibration factor is the ratio of the deltas in frequency over the deltas in voltage (KVCO = (F2- F1)/(V2 – V1). These measurements are done while the device is set to VCO calibration (VCO CALIB) mode. Transmitter (TX) Tests: The modulation characteristics (EVM), output power (IP3, ACPR), output spectrum (Spectral Mask) and power control (Gain Tests) of the transmitter are verified here. The functionality of the transmitter subcircuits, the transmit and frequency generation parts, are indirectly being checked by performing these tests. Generally, the inputs of the transmit DACs and the relevant control signals for transmit / receive switching, and other required subcircuit states are stimulated with dedicated test patterns. The synthesizer is programmed over the serial bus to set an RF frequency at which to observe the RF output of the device. Receiver(RX) Tests: The RX Gain stage (Gain), RX output power (1dB compression point), Harmonic contribution (THD), RX signal strength (RSSI), RX chain Imbalance (IQ amplitude and phase Imbalance), RF filters as well as the LO leakage to the antenna are verified here. System tests, such as Bit Error Rate (BER) / Packet Error Rate (PER) can optionally be done to check for total system performance. Generally, the RF input of the device and the relevant control signals are stimulated with dedicated test signals. The synthesizer is programmed over the serial bus to set an RF frequency which correlates with the frequency of the RF signal presented to the device. The low-frequency bit stream outputs of the device are observed.
5. Description of Structural Test Experiments In this section, the setup of the experiments performed on the WLAN transceiver are described further. Several techniques were evaluated to investigate the possibility of achieving high test coverage by testing the circuits at Paper 17.2
multiple VDD points. It is assumed that the most effective VDD points at which to test the device will be identified through the analysis of the circuit response in these setups. The WLAN transceiver samples used for the measurements includes 45 good unit samples from three diffusion batches: PH3RX, PH01J, PH11U. One hundred reject samples were also collected to represent each reject category, as well as specific failure modes. The summary of the reject samples is shown in Table 1. Table 1. Description of Reject Samples Bin
Description
Bin 14 Bin 17 Bin 20 Bin 29
ADC tests Fails RX AGC Low Vdd Fails RX AGC tests Fails TX tests Fails
Bin 30
PLL tests Fails
Bin 31
RX tests Fails
Mix
VCO tests Fails Filter tests Fails AGC (temp failures) TX_RF tests
Mix Mix Mix
PLL Phase Noise RX AGC RSSI RX AGC Gain
Diffusion Batch PH3HY PH3HY, PH3WG PH3WG PH3WG, PH3T7 PH3WG, PH3T7 PH3WG, PH3T7 P0YMA P0VK8 212701 P0Y6Y, P0WXX P0WXX P0WXX P0WXX, P0Y6Y
No. of samples 10 10 10 10 10 10 10 10 10 6 1 1 2
The measurement equipment used in the experiments is the AP (Analog Pin) resource of the LTX Synchro AC tester which is capable of performing analog parametric testing. The Automated Test Equipment (ATE) is connected to the analog device pins through an AP matrix bus and connections on the application hardware. The AP V/I sources are fully Kelvin and capable of sourcing and measuring voltage up to +64V and currents up to +31.25ma. It has a high accuracy mode which improves the accuracy of voltage measurements, and for currents less than 1.9ua, current is measured by integration (through an integrating amplifier). Figure 5 illustrates the measurement setup.
LTX Synchro AC
AP
AP matrix Bus
Load Board DUT
Figure 5. Measurement Setup
INTERNATIONAL TEST CONFERENCE
4
Method 2: VDD ramp on selective supplies In this part of the experiment, individual VDD’s are ramped from 3.3V to 2.6V while keeping the others at nominal (3.3V). This was performed at power on, sleep, TX and RX modes, which was achieved by programming the 3WB. Due to the presence of protective circuitries between the supplies in the WLAN transceiver, the voltage difference between any two supplies must never be greater than 0.7 V. Due to this limitation, the ramp up of the individual supplies, while maintaining the others at nominal, was not performed. Another possible set-up, which was also not tried out, would be to keep all supplies at zero and then individually ramp each supply from 0 to 0.7V. Method 3: DC ramp on TX terminals Transmit I & Q: In this setup, the digital, analog, VCO, and PLL supplies are powered on and set to nominal (3.3V). The differential I & Q inputs of the transceiver are setup such that the positive terminal (Ip/Qp) is connected to a voltage source that is stepped from 0V to 3.3V, at 100mV steps, while maintaining the negative terminal (Im/Qm) at 0V. The voltage steps up after every 5msec. The corresponding differential I and Q currents are measured. The resulting voltage at the I&Q outputs are also observed. The measurements are done while the chip is in sleep and power on modes programmed through the 3WB. TX outputs: The same setup is implemented on the TX outputs and the resulting currents at the same points are observed. Method 4: DC ramp on RX input (LNA inputs) In this setup, the digital, analog, VCO, and PLL supplies are powered on and set to nominal (3.3V). The positive LNA input terminal is ramped from 0 to 3.3V, at 100mV intervals happening every 5ms. The negative Paper 17.2
terminal is kept at 0V. The device is set to power on mode through the 3WB. The supply currents are observed.
6. Signatures and Results of Correlations The results that will be presented here are from the setups that generated the best comparison between a good and bad signature. Then, the current signatures obtained at different test modes are correlated with functional test results. For instance, TX and RX mode signatures are correlated with TX and RX functional tests respectively. Current signatures from the VCO, LNA, and digital supplies are correlated with the corresponding block-specific functional test. The analog supply current signatures are associated with analog tests results and the total transceiver currents to system test results. 900 800 700
IDD [uA]
Method 1: VDD Ramp The WLAN transceiver has dedicated terminals for the analog, digital, VCO and PLL supplies. In this part of the experiment, these VDD’s are stepped up together and the current signatures at each VDD terminal are observed at four different device modes: power-on, sleep, transmit (TX) , and receive (RX) modes. The total transceiver current at these modes are also calculated and plotted. The VDDs are ramped from 0.0V to the nominal operating voltage of 3.3V. The steps of the ramp are uniformly incremented by 100mV after every 5ms for power-on and sleep modes, and after every 20ms for transmit and receive modes. The chip is set to the wanted mode by digitally programming the Three Wire Bus (3WB) serial interface. This also achieves the setting of the other important subcircuits to the required states.
600 500 400 300 200 100 0 0
0.4
0.8
1.2
1.6
2
2.4
2.8
3.2
3.6
VDD [V] Figure 6. Total transceiver currents at sleep mode 6.1 VDD Ramp: Power-on and Sleep Mode Currents In power-on and sleep modes, observing the currents of individual VDD’s did not generate clear distinctions between good and bad devices. This is due to the narrow margins that separate their responses. However, the total IDD at power-on and sleep modes are more successful. Figure 6 shows the total transceiver currents at sleep mode. Compared with power-on mode, where the distinction between good and bad signatures can be distinguished across a range of voltage points, at sleep mode, only one or two power supply points, 1.3V and 1.4V, can be selected to observe and compare the total IDD signatures of the good and reject units. Figure 7 presents the zoom-in between 1.3V and 1.4V of Figure 6. Now, we proceed to correlate functional and structural tests. Correlation matching is established by counting how many of the rejects can be classified as rejects using the structural approach. Measuring the total Sleep IDD of all 145 samples, the computed matching for
INTERNATIONAL TEST CONFERENCE
5
testing at the two previously mentioned supply points is 68%. A separate analysis of the 32% that “escaped” test is covered later on in the paper. The matching per bin is summarized in Table 2.
IDD at TX, 0dBm mode, the correlation matching achieved is 99%. Figure 10 zooms in on the TX currents at 2.2V. Zooming in on the points at 2.2V, it can be seen that there is clear distinction between good and bad devices.
800 120
defective 100
600 IDD in RX mode [mA]
500 good
400
Decision line
300 1.3
1.4
80 60 40 20
VDD [V]
0 0
Figure 7. Total Sleep current at 1.3V and 1.4V
0.6
0.9
1.2
1.5
1.8
2.1
2.4
2.7
3
3.3
VDD [V]
Figure 9. Analog IDD at RX Mode 43 42
good
41 40
IDD [mA]
Table 2. Reject matching in sleep mode Fail / Fail Bin % Matching Bin 14 100% Bin 17 30% Bin 20 50% Bin 29 70% Bin 30 40% Bin 31 60% VCO Fails 90% AGC (temp) Fails 100% Filter Fails 100% Mix Fails 40%
0.3
defective
IDD [uA]
700
39 38 37 36 35 2.1
2.2
2.3
VDD [V]
Total RX_ICC Signatures
mixfail7
vcofail6
filterfail8
bin31fail9
bin30fail1
bin30fail1
bin29fail2
bin20fail3
agcfail6
bin17fail4
20
bin14fail5
30
good_37
good_1
40
good_28
50
good_19
60
140 120 100 80 60 40 20 0
good_10
70
IDD [mA]
Figure 10. Zoom in of IDD when TX_0dbm at 2.2V
ICC [mA]
6.2 VDD Ramp: TX and RX mode currents In these modes, observing individual VDDs, particularly the analog VDD at transmit, low power mode produced the most distinctive signatures for the WLAN transceiver. Figure 8 and Figure 9 show the current signatures, as a function of the power supply voltage, in TX and RX modes, respectively.
Device Binning
10
Figure 11. Analog IDD at RX mode 3.3
3
2.7
2.4
2.1
1.8
1.5
1.2
0.9
0.6
0
0.3
0 VDD [V]
Figure 8. Analog IDD at TX_0dBm mode Testing all samples at 2.2V, and monitoring the analog
Paper 17.2
Oscillations present at RX mode prevents a straightforward analysis. A better way to examine the currents at this mode is by plotting all the currents at a specific voltage step and observing the differences. This is
INTERNATIONAL TEST CONFERENCE
6
shown in Figure 11. The good devices are grouped on the left side of the figure. Each line corresponds to the current at a voltage step. The topmost signature corresponds to currents at VDD = 3.0V. Observe that some faulty devices such as the ones from bin 14 are easily detectable. 6.3 VDD Ramp on Selective Supplies Ramping down and observing the quiescent current of individual supplies does not give either more characteristic results or improved matching, as compared with the previous methods. This may be attributed to the limitations present in the design for this approach. 6.4 DC Ramp on TX IQ terminals Using the procedure described in method 3, the signature differences between the good units and the rejects are distinctly observed at voltage points 2.3V and 2.4V. Adding a third point for observation, 3.1V, increases matching by 3%. The total matching by applying this technique and observing three voltage points is 47%. The production test results is also supporting data regarding the correlation and matching of each technique. Reversing this setup by maintaining the positive terminal at 0.0V and then ramping down the negative terminal, was not allowed by the test system. Doing this caused hardware alarms. The matching per bin is summarized in the following Table 3. Table 3. DC ramp (TX IQ terminals) matching
Monitoring the resulting output voltages at TX output terminals also showed that only the low output terminal gives a better picture of the output voltage range. Signatures of some faulty devices can be distinguished from good signatures, but no significant improvement in matching or characterization was seen from this technique. 6.5 DC Ramp on RX Inputs The results obtained here are inconclusive primarily due to the incorporated DC blocking circuits in the RX Paper 17.2
chain which limit the application of the approaches used in the transmit chain. 6.6 Results of Functional Test vs. Signature Based Testing Results Generally speaking, we have experimentally explored the scope of dc-transient testing by ramping various supplies as was previously explained. Table 4 summarizes and depicts which technique best captures a functional test failure. The following describes which methods did we use. • Power-on sleep mode. Analog supply current at power and sleep mode, all supplies ramped up • TX/RX terminals. Power supply fixed while ramping TX/RX input terminals • A_tx0dbm_IDD. Analog supply current at TX mode with output levels set to 0dbm, all supplies ramped up • A_tx5dbm_IDD Analog supply current at TX mode with output levels set to 5dbm, all supplies ramped up • A_tx0dbm_IDDdn Analog supply current at TX mode with output levels set at 0dbm, with analog supply ramped down to 2.7V • A_tx5dbm_IDDdn. Analog supply current at TX mode with output levels set at 5dbm, with analog supply ramped down to 2.7V • A_rx_IDD. Analog supply current at RX mode, all supplied ramped up • A_rx_IDDdn. Analog supply current at RX mode, with analog supply ramped down to 2.7V • total_tx0dbm_IDD. Total IDD at TX mode with output levels set to 0dbm, all supplies ramped up • total_tx5dbm_IDD. Total IDD at TX mode with output levels set to 5dbm, all supplies ramped up • total_rx_IDD. Total IDD at RX mode, all supplies ramped up • total_rx_IDDdn. Total IDD at RX mode, with analog supply ramped down to 2.7V • total_tx0dbm_IDDdn. Total IDD at TX mode with output levels set to 0dbm and analog supply ramped down to 2.7V • total_tx5dbm_IDDdn. Total IDD at TX mode with output levels set to 5dbm and analog supply ramped down to 2.7V Observe that the Power-on sleep mode method is very effective for testing the VCO, AGC and filter circuits. Table 4 shows a correlation matching 90-100%. Similarly we can observe that A_tx0dbm_IDD method has an overall good effectiveness while total_tx5dbm_IDDdn and total_rx_IDDdn have excellent matching for testing the VCO. Also, bear in mind that only a few points of the whole signature are needed for effective pass/fail diagnosis.
INTERNATIONAL TEST CONFERENCE
7
Bin
Power-on sleep mode
TX/RX terminals
TX Out voltage
A_tx0dbm_IDD
A_tx5dbm_IDD
A_rx_IDD
total_tx0dbm_IDD
total_tx5dbm_IDD
total_rx_IDD
total_tx0dbm_IDDdn
total_tx5dbm_IDDdn
total_rx_IDDdn
A_tx0dbm_IDDdn
A_tx5dbm_IDDdn
A_rx_IDDdn
Table 4. Correlation matching in percentage between multi-VDD and functional testing
14
10
40
40
100
50
50
90
100
90
90
90
80
40
40
60
17
30
20
60
80
10
10
20
20
20
10
10
10
0
0
10
20
50
30
30
100
10
0
10
20
10
20
10
10
10
10
0
29
70
50
30
100
10
10
30
40
0
10
30
00
10
10
0
30
40
10
10
60
20
0
10
10
0
10
10
10
10
0
10
31
60
50
30
80
10
20
10
30
20
20
20
20
0
0
0
vco
90
50
50
100
30
40
60
50
70
50
100
100
20
20
30
agc
100
100
50
100
30
30
30
40
30
30
20
10
20
10
20
filter
100
100
80
100
0
0
0
10
0
20
30
10
0
0
20
mix
40
80
60
90
0
0
20
10
20
10
20
10
0
0
0
7. Conclusions
Acknowledgements
This paper evaluated the effectiveness of multi-VDD versus functional testing in a complex device. MultiVDD testing is attractive because it allows us to test RF devices using dc techniques only. We used a WLAN transceiver as a vehicle of study. For the WLAN transceiver, we found that measuring the total Sleep IDD at 1.3V and 1.4V, measuring input terminal currents and the TX_out_low voltage at 2.3V, 2.4V and 3.1V gives a total correlation matching of 88%. The 12% undetected failures are mostly receiver-related, or failed difficult RF tests such as PLL phase noise, and transmit IQ offset. In Active mode, testing the analog IDD at 2.2V, TX 0dBm mode, provides 99% matching. In principle this device could be tested using only signature based testing techniques. Similar as to what was found in earlier work it is not necessary to measure at all VDD points, only a small selection is needed to reach the total matching [9]. Other studies are currently going on to further verify the multi-VDD approach. Some RF measurements at final test are still needed to ensure RF products meet customer and standard requirements, but the value of the DC ramp approach for production wafer test comes in the form of low cost, minimum equipment requirements and low test time.
The authors wish to acknowledge the following colleagues who contributed their time and knowledge in completing this study: Sofiane Ellouz (ICRF), Khoi Tran (BLC–SJ), Hongbin Tong (BLC–SJ), Anton Daanen (BLC-SJ), Hamid Mohavedi (BLC-SJ), Julius Mantes (ATO PSC), Randy Handugan (ATO PSC), and Ryan Ignacio (ATO PSC). We also like to thank Sultan Sabuktagin (BLC-SJ), Jose Santiago (DTG-Test SJ), Amir Zjajo (PRLe), and Leon van de Logt (PRLe) for providing their feedback.
Paper 17.2
References [1] J. Pineda de Gyvez, G. Gronthoud, and E. Silva, “RF Test Best Practices,” RF/Multi-GigaHertz Test Workshop in DATE’04, Paris, Feb. 2004 [2] S. Ozev, A. Orailoglu, “A.System-level test synthesis for mixed-signal designs,” IEEE Transactions on Circuits and Systems II, Volume: 48 Issue: 6 June 2001, pp. 588 –599 [3] A.M. Brosa and J. Figueras, “Digital signature proposal for mixed-signal circuits,” 2000 Int. Test Conference, pp 1041 –1050, 2000 [4] P.N. Variyam and A. Chatterjee, “Test Generation for Comprehensive Testing of Linear Analog Circuits using transient response sampling,” Int.
INTERNATIONAL TEST CONFERENCE
8
Conference on Computer Aided Design, pp. 382385, 1997 [5] P.N. Variyam and A. Chatterjee, “SpecificationDriven Test Generation for Analog Circuits,” IEEE Transactions on Computer-Aided Design of Integrated Circuits and Systems,” vol. 19, no. 10, pp. 1189-1201, October 2000. [6] M. Bekheit, D. Hamilton, B. Stimpson, “Testing Analog Circuits with Binary Sequences: A Feasibility Study,” 8th IEEE Int. Mixed Signal Testing Workshop, pp. 83-87, 2002. [7] S. Somayayula, E. Sanchez-Sinencio and J. Pineda de Gyvez, “Analog Fault Diagnosis based on Ramping Power Supply Current Signature,” IEEE Trans. On Circuits and Systems-II, vol. 43, no. 10, pp. 703-712, October 1996. [8] H. Manhaeve, J. Verfaillie, B. Straka, J.P. Cornil, “Application of supply current testing to analogue
Paper 17.2
circuits, towards a structural analogue test methodology,” Proceedings European Test Workshop, 1999, pp. 51 –56 [9] J. Pineda de Gyvez, G. Gronthoud and R. Amine, “VDD Ramp Testing for RF Circuits,” IEEE Int. Test Conference, pp. 651-658, Oct. 2003 [10] J. Pineda de Gyvez, G. Gronthoud, C. Cenci, M. Bosch, T. Burger, M. Koller, “Power Supply Ramping for Quasistatic Testing of PLLs” IEEE International Test Conference, pp. 980-987, Charlotte, N.C. Oct. 2004 [11] “Data Sheet: SA2400A Single chip transceiver for 2.45 GHz ISM” Philips Semiconductors, July 25, 2003
INTERNATIONAL TEST CONFERENCE
9