2009 Fourth International Conference on Internet Monitoring and Protection
FUZZY HEURISTIC DESIGN FOR DIAGNOSIS OF WEB-BASED VULNERABILITIES Deepak Subramanian, Ha Thanh, Le and Peter, Kok Keong, Loh School of Computer Engineering Nanyang Technological University Nanyang Avenue, Singapore 639798 Email:
[email protected]
AbstractThe Common Vulnerability Scoring System (CVSS) provides an open, standardized method for rating vulnerabilities. CVSS provides base-level metrics for vulnerability classification that can be used with other strategies such as Intrusion Detection Classification [14] to form a complete diagnostic system. This emphasizes focus on defining and representing the various strategies that can be employed to provide a formal and more practical approach to vulnerabilities assessment. The various parameters that are defined have been derived from a set of five assertions and the initial fuzzy scanner metrics (The pre-defined scanner parameters). The fuzziness of the scanner metrics allows for a greater manipulation of results before a complete diagnosis can be presented. The confidence reports (1st and 2nd degree) could be used to provide information aiding the initiation of suitable steps to be taken.
the research work done in designing heuristics that will support the scoring and identification of web-based vulnerabilities via a rule-based framework to diagnose webbased software vulnerabilities. The paper is organized as follows: Section I gives the background and motivation of the research, Section II defines the scanner metrics, Section III comprises of the set of five assertions, Section IV describes the framework components, Section V provides the detailed methodology to calculate the 1st and 2nd degree confidence reports and Section VI provides an illustrative example to describe the working of the framework. II. SCANNER METRICS Every scanner has its own output data organization. It must be noted that the data generated by the scanners largely depends on the algorithm being used by the specific scanner. Some scanners having large databases are equipped to detect more classes of vulnerabilities, others comprising lightweight computational modules provide basic diagnoses while several lie somewhere in between [Example: IBM AppScan and HP WebInspect are scanners with huge databases while NStalker has a relatively smaller database]. It is hence necessary to first analyze and understand the scanning process as well as various scanners in order to design the rule framework. Let the scanner truth values be represented by { STP , STN, SFP, SFN }. These are also known as the general truthvalues of the scanner, {True Positive, True Negative, False Positive and False Negative}, respectively (see Figure 1). These values form an important measure of the vulnerability detection ability of the scanner and are used to define various metrics derived from the Common Vulnerability Scoring System (CVSS). The CVSS has been modified to suit the needs of this project. Without loss of generality, some metrics have been omitted to clarify the presentation of the proposed theory.
I. INTRODUCTION Software vulnerabilities have been regularly detected in many popular IT applications, constituting an ever growing source of threat to system integrity. The continuous and rapid expansion of the Internet has further exacerbated this, reducing the security of e-business systems and web-based applications. The detection and identification of software vulnerabilities is thus a very important task for the user. Scanner programs, both commercial and public domain, have been developed to support users in the detection process. However, the detection capabilities of existing scanners vary greatly. There are often significant differences in the output content, interpretation and complexity of different scanners. Furthermore, the format and organization of scanned outputs are not consistent with each other and increases the difficulty of standardization. A prior approach has been adopted [10][11][12] to achieve standardization of scanner outputs. Standardized scanner outputs act as an enabler for the exploitation of a scanner suite as detection front-end. In such a scanner suite, newer and more powerful scanners can replace or work hand-in-hand with older ones in a “plug-and-play” manner. Together with a suitable set of rules, standardized scanner outputs can be evaluated to give more comprehensive and user-friendly diagnoses. Such a rule-based framework also has the potential to support the realization of a languageindependent vulnerability detection tool that is scalable to different scanners as well as web-based systems that are implemented in an arbitrary technology. This paper presents 978-0-7695-3612-5/09 $25.00 © 2009 IEEE DOI 10.1109/ICIMP.2009.25
Fuzzy truth-values have been used as the scanner’s metrics as they have been proven effective against intrusion detection [14]. Since the vulnerability detection and the intrusion detection are related, it is safe to say that a use of fuzzy approach in the scanner metrics can be justified.
103
0.7
III. Assertions made The following states the assertions on which the rule framework design is based:
0.6
0.5
0.4
Assertion 1: “Some vulnerabilities are harder to exploit than others”.
0.3
0.2
It is safe to state that not all vulnerabilities are equally susceptible to exploitation and the potential damage that can be caused will also not be the same. Hence, a ‘vulnerability grade system’ needs to be present to achieve a better diagnosis of the various vulnerabilities that are detected by the web application scanners.
0.1
0
0
0.2
0.4
0.6
0.8
1
Figure 1: Fuzzy Logic Diagram
Scanner
Truth
Values
Assertion 2: Web-based vulnerabilities can be classified into 3 types: i. Evolved Vulnerability: If there is recorded detection for the vulnerability and there also exists at least one recorded exploitation methodology that is still usable. ii. Relatively-new /Dormant Vulnerabilities: a. If there is no recorded automated detection and there exists at-least one recorded exploitation methodology. b. If all the recorded exploitation methodologies can no longer be used. iii. New vulnerabilities: If there is no recorded detection or exploitation methodology for the vulnerability.
False
Positive
True
Negative
False
Negative
Figure 2: Scanner Metrics
Assertion 3: “The difficulty of detection of an evolved vulnerability is directly proportional to the difficulty of exploiting it”
,
,Where
means
The above assertion is influenced intuitively by the notion that if a complex algorithm and/or extended process is needed to detect the vulnerability, a proportionate effort would be required in effectively exploiting it. In other words, if the vulnerability can be easily detected or observable then the skill level / effort needed for exploitation is correspondingly less. Given the above assertions and the fact that not all scanners can deal with a particular vulnerability with the same degree of effectiveness, scanning capability must be ranked. The ability of a scanner to effectively detect a vulnerability is represented by an index allocated to it known as SGRADE (Scanner Grade). A scanner with a higher grade is then better suited to detect the vulnerability than one with a lower SGRADE.
the
vulnerability is absent.
where,
means the vulnerability is absent. predicted(x)={1 if x is present in report|| 0 if not} p is the no. of instances where vulnerability was present. n is the no. of instances where the vulnerability was absent. Figure 1 shows the general representation of the fuzzy logic for the scanner. The region R1 represents the true positive STP , the region R2 represents the true negative STN and the region R3 is the combined space of false positive and false negative SFP and SFN.
Assertion 4: “The impact level of a vulnerability (vulnerabilityexploitability measure) is likely to vary with varying instances of detection and at varying locations”
104
Assertion 5: “Existence of one vulnerability may influence the prevalence of another”
(Samples (Samples are set of sites which have been custom made for a particular vulnerability to be present or absent) where vulnerability is known to be present)
Steps are usually taken to avoid some vulnerabilities in a system. Some other vulnerabilities may, however, still exist. These existing vulnerabilities may directly or indirectly enable the other vulnerabilities to bypass the system’s avoidance schemes. An illustrative example is that of crosssite request forgery (XSRF) and cross-site scripting (XSS) [2]. If the cross-site request forgery has been avoided by non-usage of JavaScript and secret tokens at each level (which is quite an effective methodology), the website is virtually protected from XSRF and typical scanner programs will also declare the same. However if XSS has not been avoided, it can be used to get the tokens ahead of time and a hybrid use of XSRF can be accomplished which cannot be detected by the scanner programs.
Let nn Number of negative vulnerability samples taken (Samples where vulnerability is known to be absent) Let Np(s)Number of positive vulnerabilities detected positive as by scanner s (i.e. vulnerability is known to be present and was detected as present by the scanner) Let Nn(s)Number of negative vulnerabilities detected as negative by scanner s (i.e. vulnerability is known to be absent and was detected as absent by the scanner) Let Ts = {1 if Vulnerability detected || 0 if Vulnerability not detected}
Hence, a relationship constant R (V1)(V2) is defined where R (V1) is the likelihood of occurrence of vulnerability V1 when vulnerability V2 has occurred
Let there be Wp positive vulnerability website locations, Wn negative vulnerability website locations, Ip positive vulnerability instances for the target website location, and In negative vulnerability instances for that website location.
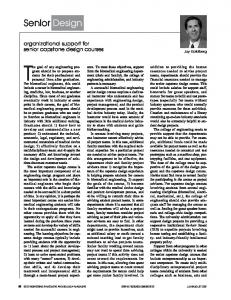
IV. GRADING SYSTEMS A. The Vulnerability grade system: From Assertion 1, it was mentioned that there is a need to grade the various vulnerabilities with a vulnerability grade system. This system would use the list of vulnerabilities from the vulnerability database [6] (a list of all known vulnerabilities with their ranking as given by Assertion 2) and use additional information exploitability (which gives the possible list of attacks for the vulnerability) and remediation level (which gives the various fixes and workarounds). A positive vulnerability means that the vulnerability is present in the website location at that instant and there is evidence to support it. A negative vulnerability means that the vulnerability is not present in the website and can be proved to a satisfactory level.
The instance is said to be the same if there is no change in scanner algorithm or scanned website or vulnerability definition. Then, we have: (1)
(2) where
With Assertion 3, we define the difficulty in detection of vulnerability V, (D(v)). Example: TABLE 1: DETECTION EXAMPLE 1 Vulnerabilit Scanner Scanner Scanner y 1 2 3 Vul1 YES YES YES Vul2 YES NO YES Vul3 NO NO NO Vul4 YES NO NO From the above table we can conclude that the DVul3>DVul4>DVul2>DVul1 Calculation for difficulty using Assertion 4:
(3)
(4)
The difficulty of detection of the vulnerability (v) is given by D(v) where S is the number of scanners used.
Let np Number of positive vulnerability samples taken
105
(5)
The Likelihood Ratio is the ratio of the likelihood that a particular vulnerability would be predicted when it matches the ground truth to the likelihood that it would be predicted erroneously. This ratio can be computed for both true positive and true negative results (6)
B. Scanner Grade System: The scanner grade system is useful to elicit a ranking amongst various scanners and support a dynamically changing system with regards to the possible updates that are made to the scanner algorithm over time. The scanner grade system is related to the scanner database, which is a database of all scanners whose reports are being converted to a structured format, as well as the vulnerability database [6]. The SGRADE is calculated for all vulnerabilities listed in the vulnerability database. The scanner has two types of metrics (Fuzzy Truth values):
(7)
The sensitivity and the specificity metrics can also be used to find the scanner characteristics. Sensitivity, which is also referred to as recall, corresponds to the correct detection rate relative to ground truth. It is the percentage of correctly detected activities out of all true instances of a particular class, averaged over all activities. Specificity can be thought of as the recognizer’s sensitivity to the negative class. It measures the proportion of correctly identified negative occurrences to all true negative occurrences.
a. The general metric, which specifies the overall STP, STN, SFP and SFN values. b. The Vulnerability Specific metrics: VTP, VTN, VFP & VFN. The vulnerability specific metric is very useful when there is a discrepancy in finding the vulnerability in the system. The vulnerability with a higher TP value can be used to determine the certainty of the vulnerability being present and the high TN can be used to ensure if the vulnerability is certainly not present.
(8)
(9)
The fuzzy truth representation has been shown in the Figure 1a. The diagram of representation for the vulnerability specific truth-value is also similar to Figure 1a. The use of the fuzzy values however allows the use of the various fuzzy evaluation metrics [15]. The most useful among these is that of likelihood ratio. Vulnerability
Database
Scanner
Database
V. REPORT CONFIDENCE COMPUTATION While it is important for the use to be able to infer from various diagnostic reports, it is also important to identify the confidence with which we share the report with the enduser. The confidence level is required to ascertain if the report can be trusted. There needs to be a confidence level on every vulnerability detected by the various scanners. The scanner grade system, which gives the vulnerability specific truth-value, is used in the calculation of the confidence of the report.
Vulnerability
Grading
System
a. Info
about
Vulnerability
b. Difficulty
of
detection
c. Exploitability
d. Remediation
Level
It must be noted that all scanners do not agree in the reports generated. Some scanners’ algorithm may be better suited to tackle some forms of vulnerability and they are effective against these but the same algorithm may be the reason for their weak performance against other vulnerabilities. Some scanners have a very comprehensive database while others suffer from inadequate ones. Hence, using the SGRADE we can specify the performance of the scanner against that particular vulnerability. When all scanners agree, the confidence on the report is higher than the confidence from an individual scanner. This factor is also moderated when scanners have a conflict in reports.
Scanner
Grading
System
a. General
b. Vulnerability
Specific
c. Confidence
1st
and
2nd
degree.
Figure 3: Framework of the Grading Systems
106
Confidence covers the fact that one vulnerability can have a relationship to the existence of another.
The methodology for calculating the confidence is given below.
Let there be n related vulnerabilities for the vulnerability v. This list includes both the ones that directly related and those that are related to the ones that are related till a complete set of related vulnerabilities is formed.
To find 1st Degree Confidence. Positive index: 1. Create the set A 2. A contains the respective Vulnerability specific VTP or VTN values depending on whether the scanner detects the vulnerability or not. 3. a0={largest ETP value in A} If there are no VTP values calculate negative index. 4. A=A-a0 5. Rearrange the remaining elements in descending order. 6. a=a0±a1(1-a0)±(a2(1-(a0±a1(1-a0)))±………….(an(1(an-1(…(1-a2(1-(a0±a1(1-a0))))…)))) where
Let the a0(v) be the 1st degree confidence of vulnerability v. All a0 values can either be the positive indices or 0. In other words, all negative indices are represented as 0. (10)
7. If ax is an ETP value, it is added otherwise, it is subtracted. If a≤0 calculate negative index. 8. The resultant value will give the confidence level for the vulnerability being present from the reports obtained.
Using the above equation, the a1(v) is calculated for the entire set of related vulnerabilities. TABLE 2: S-V TABLE s1 Instance 1
Negative index: 1. Create the set A 2. A contains the respective Vulnerability specific VTP or VTN values depending on whether the scanner detects the vulnerability or not. 3. a0={largest VTN value in A} 4. A=A-a0 5. Rearrange the remaining elements in descending order. 6. a=a0±a1(1-a0)±(a2(1-(a0±a1(1-a0)))±………….(an(1(an-1(…(1-a2(1-(a0±a1(1-a0))))…)))) where
s2 Instance
2
1
s3 Instance
2
1
2
v1 Y Y Y Y Y Y v2 Y Y Y Y Y N v3 Y Y N N Y Y v4 Y Y Y N N N v5 Y N N N N Y Then the same is repeated for a2(v) replacing all a0(v) with a1(v). It is repeated till an(v) is calculated. This gives the 2nd degree confidence level. TABLE 3: S-!V TABLE s1 Instance
7. If ax is a VTN value, it is added otherwise, it is subtracted. 8. The resultant value will give the confidence level for the vulnerability being absent from the reports obtained.
1
s2 Instance
2
1
s3 Instance
2
1
2
!
N
N
N
N
N
N
!
N
N
N
N
N
Y
!
N
N
Y
Y
N
N
!
N
N
N
Y
Y
Y
!
N
Y
Y
Y
Y
Y
v1 v2
The computational logic behind the confidence reports relies on the fact that the confidence can never be greater than 1. If the value goes below 0, the index changes from positive to negative. Every scanner result is taken and the indices are formed as a result of a collaborated value. Since scanners and vulnerabilities are graded prior to the confidence report computation, the value produced is more reliable than that of direct scanner output. To find 2nd Degree Confidence.
v3 v4 v5 VI. ILLUSTRATIVE EXAMPLE Let there be 3 scanners s1, s2, s3. Hence S=3. Let there be 5 vulnerabilities in the database v1 v2 v3 v4 v5. Table 1 shows the detection for instances where the vulnerability is known to be present. Table 2 shows the detection where the vulnerability is known to be absent.
The 1st degree confidence report covers the direct existence of any vulnerability. However, a 2nd degree report is necessary to cover Assertion 5. The 2nd Degree
107
D(v1)=1-(6/6)=0 D(v2)=1-(5/6)=1/6=0.1667 D(v3)=1-(2/3)=1/3=0.3333 D(v4)=1-(1/2)=1/2=0.5 D(v5)=1-(1/4)=3/4=0.75 Hence D(v5)>D(v4)>D(v3)>D(v2)>D(v1)
confident the user can be about the generate reports based on the various scanner outputs. The various assertions help further in this aspect as well. A very important criterion that had not been taken into account by other algorithms is covered by Assertion 5 and its application in the form of a 2nd degree confidence report to enhance the user’s view on the projected data as one vulnerability can be used to breach the defenses against another. Thus, the above analysis is a model that could be used practically and given the bias provided by the assertions, be subsequently extended to the architecture of a rule-based framework for web-based vulnerability diagnosis. The future of the model also includes an inference system, which can make use of the confidentiality and difficulty values to aid in complete diagnosis of the problem.
TABLE 4: SCANNER METRICS s1 s2 s3
v1 {.9 .9 .1 .1} {.8 .7 .2 .3} {.7 .6 .3 .4}
v2 {.92 .8 .1 .2} {.7 .6 .3 .4} {.8 .71 .2 .3}
v3 {.8 .7 .2 .3} {.7 .6 .3 .4} {.6 .6 .4 .4}
v4 {.8 .7 .2 .3} {.6 .6 .4 .4} {.9 .8 .1 .2}
v5 {.7 .6 .3 .4} {.5 .5 .5 .5} {.7 .6 .3 .4}
1st degree confidence: In this example let us consider the 2nd instance of v2 from the Table 1. The results from the 3 scanners are {Y Y N}. Hence A={.92 .71 .7}, a0=.92 and A={.71 .7}, a=.92-(.08(.71))+(1-.(92-(.08(.71))))(.7)=0.95896
REFERENCES [1] P. Mell, K. Scarfone, and S. Romanosky, "A Complete Guide to the Common Vulnerability Scoring System Version 2.0," 2007. [2] Larry Suto, “Analyzing the Effectiveness and Coverage of Web Application Security Scanners”, October 2007. [3] CERT/CC Statistics 1988 – 2006, http://www.cert.org/stats/ [4] National Vulnerability Database (NVD) Statistics, http://nvd.nist.gov/statistics.cfm [5] DHS National Security Division, NIST, “Web Application Vulnerability Scanners”, https://samate.nist.gov/index.php/Web_Application_Vulnerability_Scanner s [6] Common Vulnerabilities and Exposures (CVE), http://cve.mitre.org/ [7] Jeremiah Grossman, “WhiteHat Website Security Statistics Report”, October 2007 [8] Jeremiah Grossman, “WhiteHat Website Security Statistics Report”, August 2008 [9] Jeremiah Grossman, “WhiteHat presentation on XSRF”,https://whitehatsec.webex.com/whitehatsec/nbrshared.php?action= playback&recordID=21578512&recordKey=2E8BF7FFE53556F277FD70 6294A7E3ED86F81580F46B5A0DDC7345881C9B224C [10] H. T. Le and P. K. K. Loh, "Unified Approach to Vulnerability Analysis of Web Applications," in The International e-Conference on Computer Science (IeCCS 2007), T. E. Simos, Ed., 2007. [11] H.-T. Le and P. K. K. Loh, "Realizing Web Application Vulnerability Analysis via AVDL," in 10th International Conf on Enterprise Information Systems (ICEIS 2008), Barcelona, Spain, 2008, pp. 259-265. [12] H. T. Le and P. K. K. Loh, "Evaluating AVDL Descriptions for Web Application Vulnerability Analysis," in IEEE International Conference on Intelligence and Security Informatics 2008 (IEEE ISI 2008), Taipei, Taiwan, 2008, pp. 279-281. [13] Quals, “Vulnerability Management for Dummies”, Copyright © 2008 by John Wiley & Sons Ltd, Chichester, West Sussex, England. [14] Jonatan Gomez and Dipankar Dasgupta, “Evolving Fuzzy Classifiers for Intrusion Detection”, Proceedings of the 2002 IEEE, Workshop on Information Assurance, United States Military Academy, West Point, NY June 2001 [15] David Minnen, Tracy Westeyn, Thad Starner, Jamie A. Ward and Paul Lukowicz, “Performance Metrics and Evaluation Issues for Continuous Activity Recognition”, 2006
That is, we can be 95.896% certain that the result is True. This could mean there is high need to rectify the error. 2nd degree confidence: TABLE 5: R-V TABLE v1 v2 v3 Rv1 Rv2 .08 Rv3 Rv4 Rv5 .1
v4 .05 -
v5 .04 .09 -
The Table 5 shows the relationship between the various vulnerabilities and the suitable Relationship constant values. Let us consider the 2nd instance in the Table 1 and calculate the confidence for vulnerability v2. Since only v1 is related to v2 (There are no indirect relations as v1 is not related to any other vulnerability) a0(v1)=.987 a0(v)=.95896 a1(v)=.95896+.040506=.9994 Hence the 2nd degree confidence report would suggest a possibility of 99.94% for the vulnerability’s occurrence. Since a1(v)>a0(v) other factors are also involved hence other vulnerabilities are also present and must be rectified to rectify this vulnerability. VII.CONCLUSION The heuristics that have been defined are well suited to provide the user with a broader perspective of the discovered vulnerability including details as to how
108