commensurate with the way professionals use Windows Explorer. Keywords: ..... the sub-networks, whereas across the entire graph, the false alarm rate is necessarily less than 0.093%. ... Facebook tries to correct these false negatives by.
TH
14 INTERNATIONAL DEPENDENCY AND STRUCTURE MODELLING CONFERENCE, DSM’12 KYOTO, JAPAN, SEPTEMBER 13 – 14, 2012
GENERATING A NETWORK OF INFORMATION DEPENDENCIES AUTOMATICALLY Reid R. Senescu1, Austen W. Head2, Martin Steinert1 and Martin A. Fischer3 1
Stanford University, Center for Design Research Stanford University, Statistics Department 3 Stanford University, Center for Integrated Facility Engineering 2
ABSTRACT Creating design structure matrices (DSM) requires hours of up front effort. Though previous research demonstrated a return on investment for applying DSM methods to project planning and control, widespread industry adoption remains elusive. Even without improved workflow plans, revealing information dependencies has been shown to improve collaboration within teams and process sharing between teams. This paper contributes the proof-of-concept Automatic Information Dependency Algorithm (AIDA) which infers a network of information dependence in real-time by capturing how professionals interact with files. Though not yet able to predict dependencies well enough for industry adoption, we aim to lay the foundation for embedding DSM methods in projects at a level commensurate with the way professionals use Windows Explorer. Keywords: Automated, Information, Dependencies, Network Inference 1 INTRODUCTION Since Steward (1981) first developed the Design Structure Matrix (DSM), researchers have been contributing methods to improve the planning and control of assembly and information workflows. Yet, DSM remains a complementary tool used by a small fraction of industry projects and by a small fraction of the people on the projects in which it is used. DSM’s lack of prevalence is not due to the lack of value it provides, but rather the up-front implementation effort. Professionals can more easily apply DSM methods to manual processes (construction or manufacturing) as their non-iterative nature is more amenable to planning and control. The iterative nature of information work makes application for planning and control more rewarding but more difficult. The return on investment for applying DSM to information work is positive, but difficult to quantify due to the opacity of information workflows. Through a method for automatic generation of information dependencies (represented as a sparse directed network), this paper lays the foundation for embedding DSM methods in projects at a level similar to the way professionals use Windows Explorer. We envision an office environment with files structured in both a network of information dependencies and a hierarchy of folders. Our goal is not another a priori process modelling or optimization method, but a method for real-time visualization of workflows via information dependence. By enabling improved understanding of workflows, we aim to catalyze widespread application of DSM methods that lay foundation for workflow improvement. Section 2 briefly reviews DSM and discusses prior efforts to capture information dependencies. Section 3 contributes a proof-of-concept for the Automated Information Dependency Algorithm (AIDA) which generates DSM’s in real-time with trivial effort. Section 4 describes the AIDA validation method. Section 5 describes results, limitations, and next steps. 2 POINTS OF DEPARTURE FOR IMPROVING WORKFLOWS Workflow improvements demonstrated by DSM research and the Process Integration Platform motivated us to develop methods that automatically generate a network of information dependencies. 2.1 Design Structure Matrix: Planning and Control Originally, Steward (1981) invented DSM to model task dependencies. Eppinger et al. (1991a; 1991b) applied DSM to manufacturing and extended DSM to include different degrees of dependency. Extending DSM beyond task modelling, Austin and Baldwin (1996) used Data Flow Diagrams to Accepted Manuscript. Not Copyedited.
model information dependencies via the Design Product Model (DPM). Based on DPM, the Analytical Design Planning Technique (ADePT) is a tool that when combined with Last Planner enabled not just process planning, but also control (Choo et al. 2004). The resulting DePlan provided a comprehensive method for design process management. Yet, implementing DePlan still required developing a DSM which cost hours of effort invested early in the project (Austin et al. 1999; Austin et al. 2000). Despite the benefits of implementing DePlan, “it is difficult to describe the relationship between the process plan and the process that actually occurs… hardly any company goes to the trouble of comparing the [process] model with the process that actually exists” (Clarkson and Eckert 2005). This paper aims to lay the foundation for making this comparison effortless. 2.2 Process Integration Platform: Workflow Transparency DSM research often focuses on improving the planning of information workflows. Researchers place relatively less emphasis on the stand-alone value of revealing the network structure of information or task dependencies during workflow execution. Yet, simply bringing transparency to workflows enables improved collaboration within teams and process sharing between teams (Senescu 2011). For example, the Process Integration Platform (PIP) enabled teams to visualize and exchange digital files as nodes in an information dependency network that teams created as they worked (Senescu et al. 2010). As digital files are frequently the core deliverable of professionals, revealing the dependencies between files also revealed workflows. This work built on DPM’s establishment of a relationship between information and tasks in that PIP enabled teams to tie mere descriptions of information with the actual files. Also, since files are professionals’ deliverables, the representation of file dependencies is a type of component-based DSM that documents information interactions where each component is a file (Browning 2001). Both PIP and ADePT’s operationalization of information dependency matrices required that professionals manually define the dependency network. The remainder of this paper focuses on developing a method to automate the generation of a file-based dependency network by unobtrusively capturing how professionals open (read) and create/edit (write) digital files. 3 DEVELOPING AUTOMATIC INFORMATION DEPENDENCY GENERATION Consistent with the information processing view of an organization (Weber 1947; March and Simon 1958; Galbraith 1977; Jin and Levitt 1996), we observed that professionals frequently view information (files, website, e-mails, etc.) that they or someone else created. Within a specified amount of time, t*, the professionals used that input information to create or edit another piece of output information. We developed a file-based model of project workflows where files and dependencies were represented as vertices and directed edges, respectively, in a network. Thus, we created a fileprocessing view of a project team. Treating the DSM as the adjacency matrix of a network allowed us to use concepts from network analysis and network inference in predicting file dependencies. We developed the Automatic Information Dependency Algorithm (AIDA) to infer file dependencies based on data logs typically available in information management tools such as Bentley ProjectWise. A file dependency is the creation or editing of a file j (writing to j) that required information taken from a file i (reading i). The time between writing file j and reading file i is t. If t is large (e.g., one year), it is unlikely that file j depends on file i. As t decreases to zero, the likelihood of dependency increases because the team member was working with the two files simultaneously. Somewhere between these extreme values for t, we assumed the existence of a time, t*, where the modelled dependency network most correctly represents the true dependency network. In this model, a dependency exists as a directed edge from i to j when a team member reads a file i and then writes a file j in time t < t*. The weight of this edge, w(i,j,t*), is based in part on the number of times the workflow is repeated (times i is read and j is written within time t*). Thus, w(i,j,t*) represents a level of confidence that a dependency exists from i to j. We define w* as the weight threshold. Thus, AIDA predicts file j depends on file i if w(i,j,t*) > w*. 4 VALIDATING AUTOMATIC INFORMATION DEPENDENCY ALGORITHM This section describes how we validated the network constructed by AIDA in a case study project. 4.1 Case Study for Implementing AIDA We worked with a team designing a new US$1 billion, 46,400 m2 hospital in California. The team had already adopted a cloud-based information management tool called Bentley ProjectWise. ProjectWise DSM’12
Accepted Manuscript. Not Copyedited.
2
enabled the 53 companies and 246 team members working on the project to store and exchange files in a common location. During the hospital design phase (April 2010 to February 2012), ProjectWise logged 625,808 interactions with 28,376 files. We considered interactions that created or checked in (with changes) files to be writing; viewing or exporting files to be reading. That is, a user read information from one file (output) to write information to another file (input). Using this data, we applied AIDA to calculate dependency matrices for 24 different values of t* from 1 second to 21 days. 4.2 Survey for Validation We then tested AIDA by gathering information about the true dependency matrix from an independent sample of file interactions. To determine the true matrix, we created a survey that asked: 1. Think of a time in 2012 you used information from one file to create or edit another file. Please paste a link (i.e., file path) to the file that you created or edited in 2012: 2. Please paste a link (i.e., file path) to a file from which you used information to create or edit this file [filename from 1. inserted here] 3. Now, please paste a link (i.e., file path) to a file you created/edited that you did NOT use to create/edit this file [filename from 1. inserted here]. Note: There may be many files to choose from (This is not a trick question). This format enabled conservative assessment of AIDA’s accuracy (See Section 5.4). The following sections refer to surveyee responses and AIDA results as true and predicted relationships, respectively. 4.3 Defining a Validation Metric – ROC Curve To validate AIDA, surveyees stated whether or not file j truly depends on file i. Four possibilities exist: 1. True Positive (TP): AIDA predicted dependent, suveyee reported dependent 2. False Positive (FP): AIDA predicted dependent, surveyee reported independent 3. True Negative (TN): AIDA predicted independent, surveyee reported independent 4. False Negative (FN): AIDA predicted independent, surveyee reported dependent The hit rate (also called the sensitivity or true positive rate and defined as TP/(TP+FN) ) indicates AIDA’s ability to accurately predict true dependencies. The false alarm rate (also called the false positive rate or 1 - specificity and defined as FP/(FP+TN)) indicates occurrences where AIDA incorrectly predicts file dependencies when the files are actually independent. Using AIDA, we predict file j depends on file i if w(i,j,t*) ≥ w*. If the weight threshold is 0 (w* = 0), then we predict every file depends on every other file. Hence, hit rate = 100%, but false alarm rate = 100%. If w* is greater than the maximum calculated w for a particular set of file interactions, then we predict zero file dependencies. Hence false alarm rate = 0, but hit rate = 0. As w* varies between those extremes, tradeoffs exist between false alarm rate and hit rate. A receiver operating characteristic (ROC) curve is a graphical representation of this tradeoff. If w(i,j,t*) is unrelated to the true file structure, the hit rate would equal the false alarm rate, so the ROC curve would follow the 45 degree line in Figure 1(a). We can treat this possibility that w(i,j,t*) is unrelated to the true file relationships as a null hypothesis from which we can calculate a p-value (Mason and Graham 2002). Area under the curve (AUC) is also a useful measure as random guessing would result in AUC=0.5 whereas a perfect prediction would result in AUC=1. The next section discusses the results from constructing an ROC curve that compares the surveyees’ report of file pair dependencies (or independencies) with AIDA’s predictions. 5
RESULTS AND DISCUSSION
5.1 Collect Read/Write Data Out of the 28,376 x 28,376 theoretically possible dependencies, executing AIDA resulted in a prediction of 746,092 dependencies for t* =7 days and w*=0.014 (Section 5.3 explains the logic behind selecting this point on the ROC curve). As shown in Table 1, these predicted dependencies were not distributed normally across pairs of files. According to AIDA, half of all the files with at least one input had eight or fewer files on which the file depended. Half of all files with at least one output were used by other files 14 times or less. These input/output numbers are sufficiently small such that if accurate, they could prove useful to project teams attempting to better understanding their workflows. DSM’12
Accepted Manuscript. Not Copyedited.
3
According to AIDA, 6,815 files neither depended on other files nor were used to create/edit other files (i.e., 6,815 files were isolated from the dependency network). Some outliers suggested potential flaws in AIDA as AIDA predicted that 14 files had over 1000 other files dependent on each of them. Table 1. Number of inputs/outputs to/from files with a minimum of one input/output for w*(i,j,t*)=0.014.
Quantile # of Inputs to a File # of Outputs to a File
Min. # Included 1 1
25% 3 3
50% 8 14
75% 25 56
95% 184 322
100% 1843 2253
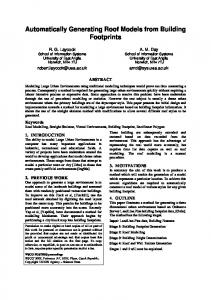
5.2 Survey Results During eight days in February 2012, 19 surveyees responded from eight companies and named 40 dependent file pairs and 83 independent file pairs. Surveyees represented diverse roles including the Building Information Modelling Coordinator, Electrical Engineering Designer, Mechanical Subcontractor, Project Manager, Drywall Modeller, Project Architect, Low Voltage Designer, etc. 5.3 Measuring AIDA’s Success – ROC Curve To evaluate the success of AIDA, we reviewed the ROC curve for every value of t*. We chose to investigate the t* and w* pair that gave the highest hit rate while maintaining a false alarm rate < 0.1. This selection criteria resulted in t*=7 days and w* = 0.014. As shown by the thin line in Figure 1(a), at w*=0.014, hit rate = 0.48 and false alarm rate = 0.07. The ROC curve has an AUC of 0.71, and a p-value = 1.07x10⁻⁶. The AUC and p-value indicate it is extremely unlikely that AIDA is unrelated to true file dependencies. Yet, the hit rate is too low to be practically useful. With a lower threshold (e.g., w*=0.002) at t*=21 days, we obtain a higher hit rate (0.65) and higher AUC (0.75), but at the cost of a false alarm rate = 0.17. That is, on that ROC curve (not shown) 17% of the file pairs AIDA predicts to be dependent are actually independent. This finding reiterates the importance of the ROC curve itself, since this tradeoff for a higher hit rate results in a false alarm rate too great to be practically useful. Looking into the misses, we noticed that some surveyees used ProjectWise infrequently while certain power users used ProjectWise multiple times per day. Discussions with team member provided anecdotal evidence that these infrequent users used other tools for exchanging information. Thus, we hypothesized that we only captured a small percentage of the total quantity of file exchange. To test this hypothesis, we reran the ROC analysis considering only the seven surveyees that were in the top ten of all ProjectWise users. Supporting our hypothesis, at w*=0.014 the hit rate jumped to 71% and the false alarm rate declined to 5% (see bold line in Figure 1(a)). Furthermore, the AUC increased to
Figure 1.(a) The shifting of the ROC curve toward the top left for power users indicates AIDA is consistent with the hypothesis that AIDA is more accurate when a larger percentage of total communication is captured. (b) By applying a threshold of w*=0.014, the majority of potential pairs (0≤w(i,j,t*=7 days)95%) with a tiny (perhaps