Generic Feature Extraction for Classification using Fuzzy C - Means Clustering #Srinivasa K G 1, Amrinder Singh 2, A O Thomas 3, Venugopal K R 1 and L M Patnaik 4 1
Department of CSE, University Visvesvaraya College of Engineering, Bangalore University, Bangalore – 560001, India. 2 Dept. of CSE, Virginia Tech, USA. 3Dept. of CSE, State University of New York at Buffalo, USA.
[email protected],
[email protected],
[email protected],
[email protected] 4 Microprocessor Applications Laboratory, Indian Institute of Science, Bangalore.
[email protected]
Abstract Knowledge Discovery and Data Mining(KDD) process includes preprocessing, transformation, data mining and knowledge extraction. The two important tasks of data mining are clustering and classification. In this paper, we propose a generic feature extraction for classification using Fuzzy CMeans(FCM) clustering. The raw data is preprocessed, normalized and then data points are clustered using fuzzy cmeans technique. Feature vectors for all the classes are generated by extracting the most relevant features from the corresponding clusters and used for further classification. Artificial Neural Network and Support Vector Machines are used to perform the classification task. Experiments are conducted on four datasets and the accuracy obtained by performing specific feature extraction for a particular data set is compared with generic feature extraction scheme. The algorithm performs relatively well with respect to classification results when compared with the specific feature extraction technique.
1.
INTRODUCTION
Data mining is the process of extraction of hidden, predictive information from large databases. The overall Knowledge Discovery and Data Mining (KDD) process deals with turning low level data into high level knowledge. The process of data mining begins with the understanding of the application domain. This includes relevant prior knowledge as well as the goals of the system. First, data cleaning and pre-processing is carried out on the raw data for removal of noise and handling of missing data. Next, data reduction and projection are performed to find the minimal set features to represent the data. An appropriate data mining model is used to extract the patterns for classification. Finally, the knowledge obtained is incorporated into the performance system. The four important steps in data mining are pre-processing, clustering, feature extraction and classification. Preprocessing involves the transformation of raw data into a form in which it can be more useful. Two important steps in pre-processing are noise-removal and handling missing data.
0-7803-9588-3/05/$20.00 ©2005 IEEE 33
Pre-processing is specific to the problem in question. However, certain accepted techniques of pre-processing are transforms (Fourier, Wavelet, etc.) and data normalization. Clustering is a form of unsupervised learning, i.e., the data available is not labelled and the output is a set of clusters containing the similar points. Commonly used techniques for clustering are k-means and k-medoids. Feature extraction handles the problem of high dimensionality and using a classifier for such problems directly, becomes infeasible. Various techniques used for feature extraction are principal component analysis, independent component analysis, edge detection in case of images, etc. Classification maps the data into predefined groups or classes. The main function of the classification system is learning. Some of the tools used in classification are Artificial Neural Networks and Support Vector Machines. 2.
RELATED WORK
A survey on soft computing approaches to data mining is presented in [1]. The compression of waves using wavelets and their performance evaluation is discussed in [2]. A Neuro-Fuzzy system with Invariant Wavelets is used to classify EEG spikes in [3], however, the system cannot be extended to a more general system. In [4], a new feature extraction process for time series data using DWT (Discrete Wavelet Transform) and DFT (Discrete Fourier Transform) has been employed but it can be used only for a specific purpose. Michail Vlachos et.al, [5] present a novel anytime kmeans clustering to evaluate feature extraction. Kohenen’s SOM (Self-Organizing Map) is used to provide additional dimensionality reduction for clustering in [6]. In [7], Wavelet transforms are used to handle high dimensional data, but the system cannot be generalized. In [8], a manual application of pre-processing techniques depending on sample characteristics using Fuzzy C-Means clustering is discussed, but this defeats the aim of automating the process of data mining. Nello Cristianini et.al, [9] describe the performance of a new SVM (Support Vector Machine) for classification. The potential of conceptual clustering for feature selection is presented in [10].
3.
be tested with various datasets so as to check the generic nature of the feature extraction process.
PROPOSED SYSTEM
Problem Formulation: The aim of this paper is to develop a generic system, which takes its input as raw data. The most important aspect in developing a generic system is feature extraction. The input to the system is in the form of instances {xi, ti}, where xi is the set of attributes and ti is the label of the instance. The aim is to select a set of attributes yi, which are the subset of xi, such that the set yi represents the instance completely and useful for classification. The parameter involved in the selection of yi, is the accuracy of classification, i.e., using yi the classifier must be able to match with ti. The steps involved in the system are given below. {Input: Raw Data} {Output: Classification results} 1. PreprocessData ( ); 2. ClusterData ( ); {Generates cluster centres for each cluster based on the number of classes.} 3. ExtractFeatures ( ); {Uses the cluster centres to choose the attributes, which contribute most towards differentiating the classes.} 4. ClassifyData ( ); {Classifies data based on the features selected.} Raw Data
Pre Processing (Data Norm alizati on)
Preprocessed Data
Clustering using FCM
Cluster centers
Pre-processed Data
Classific ation Results
Classifica tion using NN or SVM
Fe atures
PreprocessData ( ): The pre-processing stage is performed to convert all attributes of the data into a numeric form that can be used by the clustering process. If the data is available in the form of waves, as in the case of ECG and EEG signals, wavelets can be used to compress the wave into a single point. The Haar wavelet is generally used for compression. Using Haar Wavelet transforms, the whole wave can be compressed into a pre-defined number of points that represent the complete signal. This is extremely useful for reduction in dimension of the dataset. Another form of pre-processing is normalization. It may so happen that the values of some attributes may vary in different ranges and to reduce the effect of such attributes, all values of the attributes are normalized to lie in some common range, like [0, 1]. ClusterData ( ): The clustering is an important step, as it is an essential precursor to the feature extraction. The input for feature extraction is the pre-processed data, wherein the labels are stripped off. Clustering is a form of unsupervised learning that helps to find the inherent structure in the data. Using clustering, it is possible to find the similar points without actually knowing the labels and hence those attributes may be found that contribute to the points being similar to others as well as those which make it dissimilar from others. Many clustering algorithms have been developed and studied; for example, k-means and the fuzzy c-means (FCM) clustering algorithms. The FCM technique is proved to be more general and useful in case of overlapping clusters, a common scenario that exist in some real datasets. A brief description of the FCM algorithm is given below. The two conditions required to be fulfilled by the FCM algorithm are,
where each data point must be distributed according to the following criteria,
Generic Feature Extraction
Figure 1: Proposed System System Architecture: The system consists of four modules, pre-processing, clustering, feature extraction and classification. The overall system architecture is shown in Figure 1. The raw data is passed through the system. This can be in the form of any numerical data or in the form of waves. Appropriate techniques are applied to get the pre-processed data. Next, the data is passed through the clustering phase, which returns the cluster centres. Feature extraction is then performed to obtain the attributes that can completely represent a given instance. The features selected along with the pre-processed data are then passed through the classifier for testing. The quality of features extracted improves with the increase in accuracy of the classification. The system can
34
and there are no empty partitions. Here the c is the number of clusters, N is the number of data points, Ai is the ith attribute and k is the number of dimensions. Algorithm I: FCM( ) Begin k←0 Initialize membership matrix U(0) while (true) Calculate centers vi according to Update partition P(k+1) if || U(k) – U(k+1) || < ε break; end while End
The centers of each cluster are calculated using the following equation
After calculating the centroids of each cluster, the partitions (clusters) are updated by the following equation.
where, µ represents the fuzzy membership value, xi represents the data point, vi represents the cluster centre and m > 1. The FCM is based on minimization of an objective function. The algorithm starts with selecting the number of clusters as defined in the problem and initializing the membership matrix U. This matrix contains the membership value for all points for each cluster. The initialization of U is done randomly and the cluster centers are computed using the membership matrix U. The cluster centers are calculated such that the centre is closer to the points having a greater membership value to one cluster. In other words, the membership values act as weights while calculating the centers. Once the cluster centers have been computed, the membership matrix is updated according to the location of the cluster centers. To calculate the new membership value of a point with respect to a particular cluster, the distance of that point from that cluster centre as well as the distance of the point from all other cluster centers is taken into account. The change in membership matrix is computed. If this change is lower than a predefined threshold, then the process is stopped, otherwise, new cluster centers are calculated and membership matrix are updated with respect to the new cluster centers. The iteration continues till the change in the membership matrix is minimized. ExtractFeatures ( ): The important step in building a generic data mining system is the process of feature extraction that can be applied to different datasets. A generic feature extraction process should be built that does not involve the nature of the attributes, but just the attribute values. It is evident from FCM that, even though the cluster centers are obtained in k – dimensional space, where k is the number of attributes, the nature of the attributes do not contribute to cluster centers. Hence, these cluster centers can be used to choose the attributes that can be used to distinguish between dissimilar points. Consider an n-class problem with k attributes. Let (c1, c2 … cn) be the n cluster centers and each cluster centre is expressed in k dimensions as ci = [ci1, ci2 … cik].
35
Intuitively, attributes with the cluster centers that are far apart are suited for classification since the classes are better defined in those dimensions. Now, let us consider the case for n = 2 and there exist just two centers. The distance between the cluster centers can be calculated as disti = | c1i – c2i |. Let dist be a vector containing the elements disti for all the dimensions. Then, the number of attributes needed to pass through classifier is chosen. Let i1, i2 … ij be the attributes selected where, j is the number of attributes. The representative attributes for each cluster are obtained as follows, i1 = max (dist) im = max (dist – disti (m-1)) , for m=2, 3 … j ; However, for a multi-class problem, the feature selection is not trivial. It is difficult to choose the cluster centers in the computation of disti in higher dimensions, i.e., in case of n > 2. One solution is to choose two cluster centers whose distance is minimum. There are n * (n – 1) / 2 distances to be considered to obtain the minimum distance between the two centers and is computed as follows, Distijl = | cij – cil | for all j and l such that j ≠ l disti = min (distijl ) for all j, l Once disti is calculated, the features can be extracted in the same way as in any other two-class problem and the algorithm is given below, Algorithm II: Extract Features ( ) Begin n ← Number of clusters; k ← Number of attributes dist← φ; mindist ← φ; Attr ← φ for i = 1 to k for j = 1 to n - 1 for l = j to n dist ← dist U | centrej – centrel | endfor endfor mindist ← mindist U min (dist) endfor for i = 1 to k Attr ← Attr U max (mindist) endfor End The algorithm finally generates a list of attributes, namely Attr that contains the attributes in the order of their relevance. The most relevant features are at the beginning of the Attr while the least relevant features are at the end of Attr. To perform classification, the most relevant k features are selected. ClassifyData(): After the feature extraction phase, the quality of features extracted is quantified to evaluate the accuracy of the classifier. The quality of the extracted features is dependent on the accuracy of the classifier. In our work, two
classifiers namely Artificial Neural Networks(ANN) and Support Vector Machines(SVM) are used for classification task. The classifiers are decided upon the number of instances in the database. The ANN classifier is used for large databases, while the SVM is used for smaller databases. Artificial Neural Network: A simple neural network has a feed forward structure, the signals flow from inputs, propagates through any hidden units, and eventually reaching the output units. Such a structure has stable behaviour. A typical feed forward network has neurons arranged in a distinct layered topology. The input layer serves to introduce the values of the input variables. The hidden and output layer neurons are connected to all the units in the preceding layer and this type of networks are applicable in most of the applications. Initially, the variable values are placed in the input units, and then the hidden and output layer units are progressively executed. Each of them calculate its activation value by taking the weighted sum of the outputs of the units in the preceding layer, and subtracting the threshold. The activation value is passed through the corresponding activation function to produce the output of the neuron.
with each record contains the letter "R" if the object is a rock and "M" if it is a mine (metal cylinder). The dermatology dataset is an example of a 6-class problem. This dataset contains 34 attributes, 33 of which are linear valued and one of them is nominal. The Waveform Generator dataset contains 5000 instances each with 40 attributes. It is a three-class problem with each of the classes equally distributed. Each class is generated from a combination of 2 of 3 base waves. Each instance is generated by adding noise to each attribute. The ANN is used as a classifier for Physics dataset, whereas the SVM is used as a classifier for sonar dataset, dermatology dataset and the waveform generator dataset. Ideally any feature extraction system strives to extract a minimum number of required features to classify the data into various classes with minimal classification error. The parameters such as the number of features in the feature vector as well as the parameter of the kernel function are varied. The features extracted are varied over a range of 10 to 25. The parameter Gamma for RBF kernel function in SVM is varied in the range between 0.01 and 10.
Support Vector Machine: The following steps are performed during the training / testing phase of SVM.
85
Accuracy
1. Prepare the pattern matrix. 2. Select the kernel function to use.{The Radial Basis Function (RBF)is used as Kernel function} 3. Select the parameter of the kernel function.{γ in case of RBF} 4. Execute the training algorithm and train the SVM on the training data. 5. Unseen data can be classified using the trained SVM.
90
80 75 70 65 60 55 10
15
20
25
Features
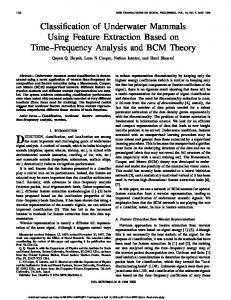
Figure 2: Classification Accuracy and varying Number of Features in case of Sonar Dataset
To test the system for accuracy of the classifier, four datasets are chosen that are high dimensional in nature. The first dataset is the Physics dataset that is obtained from KDD archives and the other three (Sonar dataset, Dermatology dataset and the Waveform Generator dataset) are obtained from the UCI Machine Learning Repository. The Physics data set is used in the KDD Cup 2004 data mining competition. The training data is from high-energy collision experiments. There are 50,000 instances, describing the measurements taken in experiments where two different types of particle are observed. Each training example has 78 numerical attributes. The sonar data set contains 111 patterns obtained by bouncing sonar signals off a metal cylinder at various angles and under various conditions. The sonar rock file contains 97 patterns obtained from rocks under similar conditions. The transmitted sonar signal is a frequencymodulated chirp, rising in frequency. Each numerical value represents the energy within a particular frequency band, integrated over a certain period of time. The label associated
36
85 80
Accuracy
4. PERFORMANCE ANALYSIS
75 70 65 60 55 50 45 0.01
0.1
1
3
10
Gamma
Figure 3: Classification Accuracy and Varying Gamma in case of Sonar Dataset The classification accuracy computed for varying number of features for Sonar dataset in shown in Figure 2. It is observed that the classification accuracy increases with the number of features initially, but as the number of features goes beyond 25, the degree of accuracy is reduced. This is on account of choosing the most relevant attributes in the beginning.
Similarly, the classification accuracy is computed for varying number of features for waveform generator dataset, as shown in Figure 4. The number of features varies from 10 to 20 and the maximum accuracy of 86% is obtained. In the case of the sonar dataset, we observe that the accuracy of classification increases with the increase in the number of features. 86 85
86.5 86 85.5 85 84.5 84 83.5 83 82.5 82 0.01
83 82 81 80
1
10
Gamma
Figure 6: Classification Accuracy and Varying Gamma in case of Waveform Dataset
79
84
78 10
15
82
20
Accuracy
Features
Figure 4: Classification Accuracy and varying Number of Features in case of Waveform Dataset Figure 5 shows the variation in accuracy as the number of features is changed for the dermatology dataset. The number of features is varied from 5 to 15. The accuracy remains constant when the number of features are increased beyond 10. This is case, where the most relevant features are extracted in the beginning itself and the later attributes do not contribute much to the accuracy of the classification. Figure 6 and Figure 7 represent the variation of accuracy by changing the value of Gamma. In all these cases, it has been observed that the accuracy reaches a maximum value for a particular value of Gamma and thereafter, it starts decreasing. 84 83 82 81 80 79 78 77 76 75 74 5
10
15
Features
Figure 5: Classification Accuracy and varying Number of Features in case of Dermatology Dataset
80 78 76 74 72 0.01
0.1
Gamma
1
10
Figure 7: Classification Accuracy and Varying Gamma in case of Dermatology Dataset In the next set of experiments, the classification accuracy is computed for varying the least relevant features as shown in Figure 9 and Figure 10 for Waveform generator dataset and Dermatology datasets. The results of Figure 9 and Figure 4 for the same number of features shows that the accuracy obtained by choosing the most relevant features is higher than accuracy obtained by choosing the least relevant features.
Accuracy
Accuracy
0.1
Finally, the classification accuracy is computed for varying number of features for Physics dataset as shown in Figure 8 and the graph shows a similar trend, i.e., the classification accuracy increases with the increase in the number of features chosen for classification.
84
Accuracy
Accuracy
In RBF kernel function of SVM, Gamma(γ) is an important parameter, which defines the decision boundary between any two classes. The classification accuracy is computed for varying Gamma values for Sonar dataset as shown in Figure 3. The SVM gives highest classification accuracy at Gamma value 3 and accuracy detoriates for higher values of Gamma.
72 70 68 66 64 62 60 58 56 54 20
23
27
Features
Figure 8: Classification Accuracy and varying Number of Features in case of Physics Dataset
37
problem specific feature extraction and generic feature extraction is minimal. Hence generic feature extraction using Fuzzy C-Means clustering can be easily adopted for data mining applications.
76
Accuracy
74 72 70
5. CONCLUSIONS
68 66 64 10
15 Features
20
Accuracy
Figure 9: Classification Accuracy and varying Least Relevant Features in case of Waveform Generator Dataset 73 72 71 70 69 68 67 66 65 64
REFERENCES
5
10 Features
15
Figure 10: Classification Accuracy and varying Least Relevant Features in case of Dermatology Dataset Table 1: Comparison of Classification Accuracy
Accuracy
Technique
Accuracy obtained from Generic Feature Extraction (FCM)
Physics Dataset
73%
SVM
70%
Sonar Dataset
90.5%
ANN
88%
Dermatology Dataset
85%
ANN
83.3%
Waveform Generator Dataset
86%
BC
Dataset
In this paper, we have examined the issue of generic feature extraction using Fuzzy C-Means clustering on various datasets. An important observation is that the classification accuracy obtained using Fuzzy C-Means clustering for generic feature extraction is very close to the accuracy of classification obtained by using problem-specific feature extraction such as, ANN, SVM, BC, etc. Hence, a standard simpler, general feature extraction system can be built, which can take raw data and perform transformations and feature extraction independent of the datasets that results in reasonably high classification accuracy.
Problem Specific Feature Extraction
85.6%
Table 1 gives the comparison of classification accuracy obtained from a problem specific feature extraction and generic feature extraction(FCM). The accuracy obtained from generic feature extraction on physics dataset is 70% and 73% when SVM is used. Similarly, for the Sonar dataset, the generic feature extraction results in classification accuracy of 88%, while the classification accuracy of 90.5% is obtained by using problem specific ANN. The results are very close to each other. In case of Dermatology dataset, 85% classification accuracy is obtained using problem specific ANN, while the generic feature extraction technique results in accuracy of 83.3%. The results obtained using Bayesian Classification (BC) technique and generic feature extraction results in 86% and 85.6% respectively. It can be observed from Table 1, that the difference in the classification accuracies obtained when a
38
1. Sushmita Mitra, Sankar K. Pal and Pabitra Mitra, “Data Mining in Soft Computing Framework: A Survey”, in IEEE Transactions on Neural Networks, Vol. 13, No. 1, January 2002. 2. Robert S. H. Istepanian, Leontios J. Hadjileontiadis, and Stavros M. Panas, “ECG Data Compression Using Wavelets and Higher Order Statistics Methods”, IEEE Transactions on Information Technology In Biomedicine, Vol. 5, No. 2, June 2001. 3. A. Akhbardeh, Dr. M. Farrokhi and A. Vahabian Tehrani, “EEG Features Extraction using Neuro-Fuzzy Systems and ShiftInvariant Wavelet Transforms for epileptic Seizures Diagnosing”, in Proceedings of the 26th Annual International Conference of the IEEE EMBS San Francisco, CA, USA, September 1-5, 2004. 4. Fabian Morchen, “Time series feature extraction for data mining using DWT and DFT”, October 2003. 5. Michail Vlachos, Jessica Lin, Eamonn Keogh and Dimitrios Gunopulos “A Wavelet-Based Anytime Algorithm for K-Means Clustering of Time Series”, 3rd SIAM International Conference on Data Mining. San Francisco, CA. May 1-3, 2003, Workshop on Clustering High Dimensionality Data and Its Applications. 6. Xiaozhe Wang, Kate A. Smith, Rob Hyndman and Damminda Alahakoon, “A Scalable Method for Time Series Clustering,” Tech Report, Department of Econometrics and Business Statistics Monash University, Victoria, Australia, 2004. 7. Ivan Popivanov and Renee J. Miller, “Similarity Search Over Time-Series Data Using Wavelets”, in Proceedings of the 18th International Conference on Data Engineering (ICDE.02), 10636382/02. 8. Xiao Ying Wang, Jon Garibaldi and Turhan Ozen, “Application of the Fuzzy C-Means Clustering Method on the Analysis of nonPreprocessed FTIR Data for Cancer Diagnosis”, in Proceedings of the 8th Australian and New Zealand Conference on Intelligent Information Systems (ANZIIS 2003), Sydney, Australia, 10-12 December 2003. 9. Nello Cristianini, Colin Campbell and John Shawe-Taylor, “A Multiplicative Updating Algorithm for Training Support Vector Machines”, in Proceedings of ESANN'1999 - European Symposium on Artificial Neural Networks, Belgium, April 1999, D-Facto public, ISBN 2-600049-9-X, pp. 189-194. 10. Mark Devaney and Ashwin Ram, “Efficient Feature Selection in Conceptual Clustering”, in Proceedings of Machine Learning: Proceedings of the Fourteenth International Conference, Nashville, TN, July 1997.