14th PSCC, Sevilla, 24-28 June 2002
Session 37, Paper 4, Page 1
GEOMETRICALLY-BASED HYPOTHESIS TESTING FOR TOPOLOGY ERROR IDENTIFICATION Elizete Lourenço 1 Federal University of Santa Catarina Florianópolis, Brazil
[email protected]
Kevin Clements
Abstract - This paper presents a topology error identification algorithm capable of processing networks modeled at substation level. The methodology is based on hypothesis testing, which assumes that the set of switching devices is partitioned into suspect and true subsets by examining the magnitude of normalized Lagrange multipliers. To improve the efficiency of the method, a cosine test based on the geometric interpretation of the Lagrange multipliers is developed and included in the algorithm. The proposed geometrically-based test proves to be instrumental to ensure good performance of the identification method, as confirmed by several simulations conducted on the IEEE 30-bus network.
1 Introduction EAL -time power system security assessment relies on a correct model of the electric power network topology, determined from switch and breaker status data. Errors on those data result in network topology errors, which reflect themselves on the performance of network based applications, such as state estimation, contingency analysis, and on–line power flow. Therefore, it is important that efficient tools for topology error identification be available in real-time operation. Until the mid nineties, most proposed algorithms for topology error identification were essentially heuristic. Since then, new developments related to the representation of zero-impedance branches [1] have brought about a renewed interest on analytical approaches. As a consequence, a new generation of state estimation [2] and topology error identification [3], [4], [5], [6], [7] algorithms have been recently proposed. Most of them model selected regions of the network at the bus section level with the explicit representation of switching devices. Despite those efforts, topology error identification remains a challenging problem in power systems real time modeling that requires further research work. This paper builds on a topology error identification method based on normalized Lagrange multipliers [3] and hypothesis tests using Bayes’ theorem [4], [8]. Prior to applying hypothesis testing, the proposed approach assumes that the set of modeled switching devices is partitioned into suspect and true subsets, in accordance with the magnitude of the corresponding Lagrange multipliers. This strategy is similar to hypothesis testing to identify multiple analog bad data [9]. As in the analog bad data case, performance relies strongly on all devices with wrong status being included in
R
1 On
leave from Federal University of Paraná.
Antonio Simões Costa
Worcester Polytechnic Institute Massachussets, USA
[email protected]
Federal University of Santa Catarina Florianópolis, Brazil
[email protected]
the suspect set. To ensure that, this paper proposes a geometric test based on the orthogonal projection of the Lagrange multipliers onto the range space of the suspect Lagrange multiplier covariance matrix. This approach is an extension of the geometric method presented in [10], and yields a very simple test which conclusively decides if all wrongly modeled switching devices are included in the suspect set. The imbedding of the geometric test into the hypothesis testing identification method based on normalized Lagrange multipliers and Bayes’ theorem considerably improves the overall performance without adding any significant complexity to the procedure. The result is an efficient tool for detecting and identifying single and multiple topology errors which does not requires costly state re-estimations. Although the geometric approach has been originally devised as an accessory tool to hypothesis testing identification, it can be directly employed to conceive a topology error processing algorithm. Both applications are discussed in this paper, preceded by a detailed description of the geometric approach. The IEEE 30-bus test system is used to assess the performance of the proposed algorithm. 2 Constrained State Estimation HE proposed topology error identification method considers that suspect parts of the network are modeled at the bus section level. Hence, a generalized approach of the state estimation is required. In this paper, generalized state estimation is treated as an optimization problem, as proposed in [3]. Switching branches are modeled as zero impedance branches by considering the power flows through them as new states, in addition to the conventional nodal voltages [11]. The generalized state vector is then given by the vector of bus voltage magnitudes augmented by the power flows through switching devices. The information made available by the explicit representation of switching devices are included into the state estimation problem as equality constraints. If a circuit breaker between nodes i and j is closed, then the voltage drop and the voltage angle difference across this switching branch are zero, i.e. vi − vj = 0 and δ i − δ j = 0. On the other hand, if the circuit breaker is open then the active and reactive power flows through it are zero, i.e. tij = 0 and uij = 0. These constraints are referred to as operational constraints (ho (.)) . Zero injections at bus sections and reference bus angles are also included in the state estimation problem as
T
14th PSCC, Sevilla, 24-28 June 2002
Session 37, Paper 4, Page 2
equality constraints. The latter are called structural constraints (hs (.)). Consider an N -bus power network monitored by m measurements and let n be the total number of generalized states. The state estimation problem formulated as an optimization problem subject to the above constraints and the measurement model equation is represented by: M in s.t.
1 T −1 2 rm Rm rm x) zm − hm (ˆ
hs (ˆ x) = 0 ho (ˆ x) = 0
− rm = 0
(1)
where zm , rm , hm (.) are the (m × 1) measurement vector, residual vector and vector of measured quantities, respectively; Rm is the (m × m) measurement error covariance matrix; and x ˆ is the (n × 1) state estimated vector. This constrained problem can be solved using Hachtel’s sparse tableau algorithm. By this method, the state estimate is computed by solving in each iteration the linear system: µ ¶µ ¶ µ ¶ 0 x ∆ˆ 0 HT (2) = H R λ ∆z (k) where:
Hm (ˆ Rm 0 0 xk ) xk ) R = 0 0 0 (3) H = Hs (ˆ 0 0 0 xk ) Ho (ˆ zm − hm (xk ) λm (4) λ = λs ∆z (k) = −hs (xk ) λo −ho (xk )
The state estimate is updated via x x and ˆ(k+1) = x ˆ(k) + ∆ˆ the iterations proceed until convergence. Vector λ contains the Lagrange multipliers associated with the constraints imposed by the measurements, and the structural and operational constraints. The values of the Lagrange multipliers represent the sensitivities of the objective function of the problem (1) with respect to its constraints [12].
where is the (extended) measurement error vector. If there are no structural or operational modeling errors, then: = where: m
RRORS in the estimated state can arise from analog bad data or structural and operational constraint modeling errors. The state estimation error vector, x ˜, is defined by [3]: x (5) ˜=x ˆ−x
where x is the true state vector. The first-order Taylor’s serie expansion of the measurement/constraint vector about x ˆ yields: hm (ˆ x) x) ≈ h(x) + H x h(ˆ x) = hs (ˆ (6) ˜ ho (ˆ x)
The corresponding incremental measurement vector ∆z is defined as: (7) ∆z = − H x ˜
T m
0 0
¢T
(8)
(9)
= zm − hm (x)
It can be seen from equation (2) that when the state estimation solution is achieved the following conditions are satisfied [3]: (10) (11)
Rλ = ∆z HT λ = 0
When expression (7) is substituted into (10) and (11) we obtain: ¶µ ¶ µ ¶ µ x ˜ 0 0 HT (12) = H R λ Then, the Lagrange multipliers vector and the state error vector are related to the measurement/constraint error vector by: µ where
µ
x ˜ λ
=
µ
−Σ C T C V
−Σ C T C V 
=
µ
0 H
¶µ
(13)
¶−1
(14)
0
HT R
The Lagrange multipliers are thus given by: λ=V
(15)
If the measurement errors are zero mean random variables with covariance matrix Rm and there are no structural or operational modeling errors, then it is easily established that :
3 Normalized Lagrange Multipliers
E
¡
E{λ} = 0 x} = 0 E{˜
(16) (17)
E{λλT } = V RV T = V E{˜ xx ˜T } = Σ E{˜ xλT } = 0
(18) (19) (20)
and
Therefore, λ is a zero mean random vector with covariance V and can be normalized by [3]: λi λN i = √ vii where vii is the i’th diagonal element of V .
(21)
14th PSCC, Sevilla, 24-28 June 2002
4 Bad Data Analysis 4.1 Topology Error Detection Assuming the absence of gross errors among the analog measurements and the absence of errors among the structural and operational constraints, the normalized Lagrange multipliers defined by equation (21) are zero mean random variables with unit variance. Therefore, large normalized Lagrange multipliers indicate inconsistences in the mathematical model. In this paper we exploit this feature by using the normalized Lagrange multipliers to detect topology errors and to select suspect sets of switching branches. The constrained state estimation solution generates real valued variables as the entries of vector λo , which are associated with the status of each circuit breaker represented in the network model. The corresponding normalized vector, λN o , is computed and topology errors are detected by monitoring the magnitude of its entries. If the largest absolute value in λN o is found to be larger than a pre-specified threshold λt , it is concluded that topology errors have occurred [3]. A typical value for λt is 3.0. In case a topology error is detected, the absolute values of λN o entries are used to select the switching branches which are suspect to be erroneously modeled [8], as described in the next subsection. 4.2 Suspect Sets of Switching Branches In this paper, we perform topology error processing in two steps, as proposed in [2] and [7]. The results obtained in the first stage, which is conducted at the bus/branch level, are employed to narrow down the anomaly region. Topology error identification is then conducted on a reduced system where a few substations are represented at the substation level. Normalized Lagrange multipliers associated to the operational constraints are then used to select the switching branches whose status are suspect of being erroneously modeled. If the magnitude of λN o,i is larger than the threshold λt , the switching branches related to the corresponding operational constraints are selected as suspect. This procedure leads to the partition of the modeled switching branch set into suspect and true subsets. Hypothesis testing will be performed only on the suspect switching branch subset, instead of the entire switching branch set. As is also the case in multiple analog bad data processing [9], the performance of the hypothesis testing for topology error identification also depends on the inclusion of all erroneously switching branches in the suspect set. Thus, the need arises of a tool to verify if the suspect set contains all switching branches possibly involved in network topology errors. A cosine test based on a geometric interpretation of the Lagrange multipliers is developed in this paper which fulfills this need, as shown next. 5 Geometric Interpretation of the Lagrange Multipliers
Session 37, Paper 4, Page 3
has an error as:
j.
In this case, equation (15) can be written λ = vj
j
(22)
where vj is the j’th column of the Lagrange multiplier covariance matrix, V . Equation (22) shows that for a single error the Lagrange multipliers will be collinear with vj . The collinearity of λ and each column of V can be tested in order to find which information has the bias error. Therefore, it is possible to calculate the cosine of the angle between λ and the columns of V to determine which column or columns are nearly collinear with λ. For computational reasons, we choose not to test the collinearity of λ and vi but rather, we will test for the collinearity between R1/2 λ and R1/2 vi . Let θi be the angle between R1/2 λ and R1/2 vi , then: λT Rvi cos θi = r³ ´¡ ¢ λT Rλ viT Rvi
(23)
When equation (15) is substituted into equation (23), we have: T T V RV ei (24) cos θi = r³ ´¡ ¢ T T λ Rλ vi Rvi where ei is the i’th column of the identity matrix. Using the identity shown in equation (18) and equation (21) , one can easily conclude from equation (24) that: λN i cos θi = ³ ´1/2 T λ Rλ
(25)
5.2 The Cosine-Test for Multiple Bad Data Consider now the occurrence of multiple errors in measurements and/or constraints of the power system. To develop a cosine-test for multiple bad data, we partition the covariance matrix into columns corresponding to suspected and trusted bad data, so that: ¡ ¢ V = VS VT (26)
where S denotes the column set associated to the suspect information and T denotes the column set associated to the information which are free of bias. Suppose that all measurements in T are perfect and all constraints in T correctly represents the network model. In this case the error vector can be written as: µ ¶ S (27) = 0
5.1 The Cosine-Test for Single Bad Data
When equations (26) and (27) are substituted in (15) , we have: (28) λ = VS S
Consider the case where the network is correctly modeled by the constraints and all measurements are perfect except for information (measurement or constraint) j, which
The above equation shows that in the case all erroneous information are included in the suspect set, vector λ will lie in the range space of VS .
14th PSCC, Sevilla, 24-28 June 2002
Session 37, Paper 4, Page 4
As in the single bad data case, for computational convenience we will perform a test on R1/2 λ and R1/2 VS , rather than on λ and VS . In order to test whether R1/2 λ lies in the range space of R1/2 VS , we write R1/2 λ as the sum of two orthogonal vectors: R1/2 λ = p + q
(29)
where p and q are, respectively, the projections of the R λ onto the range space of R1/2 VS and onto its orthogonal complement. It is possible to verify that [13]: 1/2
p = R1/2 VS (VST RVS )−1 VST Rλ
(30)
q = R1/2 λ − p,
(31)
Therefore and it is easily verified that p and q are orthogonal, that is, pT q = 0. When expression (28) is substituted into equation (30) , we note that: p = R1/2 VS (VST RVS )−1 VST RVS = R1/2 λ
S
(32) (33)
Furthermore, if we are still under the hypothesis that all the errors are restricted to set S, we can conclude from equation (31) and (33) that: q=0 (34) Equations (33) and (34) show that, in the case where multiple errors occur only among the elements in the suspect set S, vectors p and R1/2 λ are collinear. Therefore, it is possible to test if the suspect set S contains all erroneous information by calculating the cosine of the angle between p and R1/2 λ. If θ is this angle, then: pT R1/2 λ cos θ = r³ ´ λT Rλ (pT p)
(35)
And, by substituting (32) into the above equation, we have: cos θ = r³
λT RVS (VST RVS )−1 VST Rλ ´³ ´ (36) T T T T −1 λ Rλ λ RVS (VS RVS ) VS Rλ
We can simplify the above equation by partitioning the Lagrange multiplier vector according to the V partition (26) and also by using the identity V T RV = V, as follows: µ ¶ λS (37) λ = = V = V T RV λT µ T ¶ VS Rλ (38) = V T Rλ = VTT so that:
λS = VST Rλ
(39)
Finally, when equation (39) is substituted into (36) , the cos θ can be written as: cos θ = r³
λTS (VST RVS )−1 λS ´ ´³ λT Rλ λTS (VST RVS )−1 λS
(40)
It can be easily shown that, by defining VSS = VST RVS equation (40) can be simplified to: v u T u λ (VSS )−1 λS ´ (41) cos θ = t S³ λT Rλ 5.3 Remarks about the Geometric Interpretation
The geometric interpretation of the Lagrange multipliers can be seen as a generalization of the geometric method presented in [10]. Therefore it can be exploited to process topology error identification in addition to the multiple analog bad data processing presented in [10]. In this paper the results obtained with the geometric interpretation are used as an accessory tool to hypothesis testing identification based on the partition of the switching branch set into suspect and true subsets. The cosine-test obtained from the geometric interpretation is used to check whether all erroneously modeled switching branches are in fact in the suspect set. The suspect set is defined according to the magnitudes of the normalized Lagrange multipliers associated to the operational constraints, as described in subsection 4.2. 5.4 Applying the Geometric Test Under the hypothesis that all measurement are perfect and all constraints in subset T correctly represent the network model, the cos θ value calculated from equation (41) will be equal to 1.0. In practice, measurements are subject to random errors with zero mean and covariance matrix Rm . In that case the cos θ value will not be exactly equal to 1.0. Considering this fact, the following criteria is proposed to check for the inclusion of all erroneously modeled switching branches in the suspect set. If the cos θ value is sufficiently close to 1.0, i.e. cos θ > 1 − cos where cos ∈ [0.01, 0.1] , we may conclude that all erroneously modeled switching branches are in fact included in the suspect set, and the hypothesis testing can proceed. On the other hand, a value of cos θ significantly different from 1.0 is an indication that at least one switching branch with wrong status has not been selected ³ as suspect ´ by the N normalized Lagrange multiplier test λo,i > λt . In this case the suspect set is redefined by decreasing the threshold λt and the cosine-test is re-applied to the new suspect set. This procedure is repeated until the cosine-test is satisfied, i.e. until cos θ > 1 − cos . In the worst possible case, all switching branches represented in the network model would be selected as suspect [8]. 6 Hypothesis Testing Identification 6.1 Hypothesis Definition Consider that ns switching branches are selected as suspect by using the normalized Lagrange multipliers and the cosine-test as described before. In this case there are 2ns possible combinations for their status. We define the current status of the suspect set as the null hypothesis, which will be denoted by Ho . All other status combination correspond to alternative hypotheses, Hi , i = 1, ..., (2ns − 1) [8].
14th PSCC, Sevilla, 24-28 June 2002
Session 37, Paper 4, Page 5
7 Proposed Algorithm
6.2 Hypotheses Testing via Bayes Theorem The purpose of hypothesis testing is to establish whether the available information (measurements and constraints) support the null hypothesis Ho or some other alternative hypothesis. Bayes theorem is used to compute the a posteriori conditional probability of each hypothesis. Let P (Hi ) be the a priori probability of hypothesis i, provided as input data, and P (Hi |z) be the a posteriori probability. The relevant form of Bayes’ theorem states that: f (z|Hi )P (Hi ) P (Hi |z) = P2nds j=1 f (z|Hj )P (Hj )
(42)
where f (z|Hi ) is the conditional probability density function of z given that Hi is true. Assuming that z is normally distributed, f (z|Hi ) is given by [14]: T −1 1 m 1 f (z|Hi ) = 2π− 2 |Ωi |− 2 e{− 2 (z−H x¯) Ωi (z−H x¯)} (43)
where |Ωi | is the determinant of the (nmr × nmr ) covariance matrix of z when Hi holds, given by [14]: Ωi = Ri + HP H
T
(44)
and nmr is the total number of measurements and constraints of the estimation problem. To calculate the a posteriori probabilities P (Hi |z), the probability density function f (z|Hi ) is required. The technique presented in [15] has been adapted to the topology error identification problem so as to compute the determinant and exponent in equation (43) [8]. Besides, proper forms of matrices H and R and matrix modification techniques are used so that only the state estimation results corresponding to H0 are needed [8]. This implies that, no further state estimations are required to compute the conditional probabilities for the alternative hypotheses. 6.3 Processing Zero Flows through Closed Breakers As noticed elsewhere [3], it is possible that, upon completion of the identification algorithm, switching devices that are actually open turn out to be considered closed, in spite of the fact that the magnitude of the Lagrange multipliers are much lower than the threshold. This is due to almost negligible flows through those devices, so that a change of status has little effect on the estimated states. To enable the proposed algorithm to correctly identify the status of such switching devices, we follow reference [3] and add a post-processing stage to our algorithm. It consists of a statistical test applied to the flows through all closed devices. The threshold for that test is given by: f
= σ sb,i N1− α2
(45)
where σ sb,i is the standard deviation of the switching branch flow i (obtained from the state covariance matrix Σ), α is the significance level of the test and N1− α2 is the 100(1 − α2 ) percentile of the standard normal distribution.
NCE the state estimation is carried out for the null hypothesis, i.e. to the current configuration of the reduced network, the topology error identification method can be applied. It is composed of two main steps: suspect switching branch selection and hypothesis testing. Besides, the post-processing stage presented in [3] is applied in the proposed algorithm with the purpose of correcting wrong closed status, as discussed in subsection 6.3. The following algorithm describes the topology error identification steps.
O
0. Define initial threshold λt and the tolerance
cos ;
1. Compute Lagrange multipliers for operational constraints, λo , and the corresponding ¯ ¯ normalized val¯ N¯ N . Let λ ues, λN = max ¯λ o o_ max o,i ¯ ; 2. If λN o_ max ≤ λt , stop. Otherwise, a topology error has occurred. Proceed to step 3;
3. (Suspect switching branch selection) ¯Select ¯ as sus¯ N¯ pect all switching branches for which ¯λo,i ¯ > λt ;
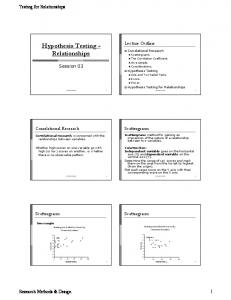
4. (cos-test) Compute cos θ using Eq. (41) and apply cos θ-test: • If cos θ > (1 − cos ) , then all devices with wrong status are included in the suspect set, proceed to step 5. • If cos θ < (1 − cos ), decrease λt and return to step 3. 5. (Hypothesis Testing Identification) Compute a posteriori conditional probabilities using Eq. (42) and identify the status combination associated to the hypothesis of largest probability as the correct configuration. 6. (Post-Processing step) Compute the zero flow threshold f using Eq. (45) and apply the statistical test to all closed devices: • If f low(i) < f , then change the status of break i to open. (End) 8 Simulation Results HE proposed algorithm has been implemented considering a linear model for the eletric power network. The IEEE 30-bus is employed to evaluate the performance of the proposed topology error identification methodology. As in [7] and [3], attention is focussed on substations 12 and 15 of the test system. Figure 1 shows the detailed representation of the reduced network composed by those two substations, where original buses 12 and 15 are re-numbered as 2 and 5. Two distinct operating conditions and metering schemes are used, as shown in Table 1. Measurements are assumed noisy, with variances equal to 2% of the measured values. Some of the topology errors simulated in [3] are reproduced in this paper to assess the performance of the proposed method. The obtained results are shown in this section. Values for parameters λt , cos and α of the
T
14th PSCC, Sevilla, 24-28 June 2002
Session 37, Paper 4, Page 6
proposed algorithm are 3.0, 0.1 and 0.05, respectively. The alternative hypotheses are supposed to be equally likely, so that a priori hypothesis probabilities P (Hi ) are the same for all alternative hypotheses.
r
r4 J ^ rr r1 J ^ r
2
r p
6 r r
p p p r 15 16 17 18 r I @ @ r
r @ I @
¶r ¶ r / 8
5
14
r r p 9 p p r p 12 p r r 10 11 13 r Jr 3^
r ¶ / r ¶ 7
-
19
¶r / r¶ 6
Figure 1: Test System: IEEE 30-bus Reduced Network
Closed Switching Branches OC-1 OC-2 2-9, 2-10, 2-11, 2-9, 2-10, 2-11, 2-13,5-16, 5-17, 2-12, 2-13, 5-15, 5-18 5-16, 14-17, 14-18 Scheme 1 (MS-1) Scheme 2 (MS-2) 2-9, 2-10, 2-13, 2-9, 2-10, 2-13, 5-15, 5-18,19-12, 14-16, 5-16, 5-17, 5-18,19-12, 14-17 14-15, 14-16, 14-17, 14-18 Table 1: Operating Conditions and Metering Schemes for the Test System
8.1 Single Topology Error A single error occurs when the status of a single switching branch is erroneously represented in the network model. This subsection presents the results obtained with the proposed method for three distinct single errors. The operating condition OC-1 and metering scheme MS-1 shown in Table 1 are used for the three cases. The cases involve switching branches (SB) 5-16, 2-13 and 2-10, which are reported to the state estimator as open while their real status is closed. The three topology errors are detected by the normalized Lagrange multipliers test (λN o_ max > 3.0). Table 2 shows the results of the identification process. The suspect switching branches (SSB), are shown in the second column of the table. The third column shows the cosine values for each case, indicating that the cosine-test is satisfied for all of them. In fact, for the three cases the suspect set is restricted to the erroneous SB, so that alternative hypothesis is restricted to its closed status. The last two columns of Table 2 show the results of hypothesis testing. The conditional probability value for the alternative hypothesis of each case is equal to 1.0, pointing out that the suspect SB status is in fact closed.
Erroneous SB Case 1: 5-16 Case 2: 2-13 Case 3: 2-10
SSB (λN o > 3.0) 5-16 2-13 2-10
cos θ 0.9999 0.9997 0.9999
Hi H1 : {1} H1 : {1} H1 : {1}
P (Hi |z) 1.0 1.0 1.0
Table 2: Single Error Results
8.2 Inclusion Error Metering scheme MS-1 and operating condition OC-1 are again used for inclusion error simulation. In the actual network topology, line 12-15 is out of service. However, a closed status for switching branches 2-12 and 5-15 is incorrectly reported to the state estimator. As a consequence, line 12-15 is erroneously reported as being in operation to the state estimator. The topology error generates the suspect set shown in the second column of Table 3. The third and fourth columns of the table show the correct and simulated status of the suspect switching branches, where “0” and “1” represent the open and closed status, respectively. The cosine value is given in the last column of Table 3, correctly indicating the inclusion of the erroneous switching branches among those in the suspect set. Erroneous SB 2-12 5-15
SSB (λN o > 3.0) 2-11 2-12 5-15 5-16
Correct Status 1 0 0 1
Simulated Status (H0 ) 1 1 1 1
cos θ 0.9969
Table 3: Suspect Switching Branches Selection for Inclusion Error
The results of hypothesis testing for the alternative hypotheses whose conditional probabilities are found to be different from zero are shown in Table 4. The largest conditional probability value is associated to the correct status combination of the suspect set, as expected. Status Combination (Hi ) 1001 H8 : H13 : 1 1 0 1 H14 : 1 0 1 1
P (Hi |z) 0.99996 0.00002 0.00002
Table 4: Hypothesis Testing Results for Inclusion Error
8.3 Exclusion Error This case considers operating condition OC-2 and metering scheme MS-2. Switching branches 2-12 and 5-15 are incorrectly represented as closed in the network model, so that line 12-15 is erroneously excluded from the network model. The switching branches selected as suspect by the normalized Lagrange multiplier test are shown in the second column of Table 5. We verify that the switching branches with wrong status have not been included in the suspect set. Consistently, the cosine test points out this fact, since the cos θ value is much smaller than the corresponding threshold, as shown in the last column of Table 5.
14th PSCC, Sevilla, 24-28 June 2002
Erroneous SB 2-12 5-15
SSB (λN o > 3.0) 5-18 5-17
Correct Status 0 0
Session 37, Paper 4, Page 7
Simulated Status 0 0
cos θ 0.2043
Table 5: Suspect Switching Branch Selection for Exclusion Error
By applying the algorithm presented in subsection 7, the suspect set is then enlarged by reducing the threshold λt . For λt = 0.5 the cosine-test is finally satisfied. Table 6 shows the suspect set data obtained with the modified threshold and the computed cos θ value. SSB λN o,i > 0.5 2-12 5-15 5-17 5-18 14-16
Correct Status 1 1 0 0 0
Simulated Status 0 0 0 0 0
cos θ
0, 9998
Table 6: Suspect Switching Branch Selection for Exclusion Error - last step
Hypothesis testing results for this case are shown in Table 7, considering the suspect set as in Table 6. Status Combination H15 : 1 1 0 0 0 H21 : 1 1 1 0 0 H24 : 1 1 0 1 0 H25 : 1 1 0 0 1 H28 : 1 1 1 1 0 H29 : 1 1 1 0 1 H30 : 1 1 0 1 1 H31 : 1 1 1 1 1
P (Hi |z) 0,14159 0,00018 0,00032 0,00018 0,01654 0,00802 0,01314 0,82002
Table 7: Hypothesis Testing Results for Exclusion Error
Alternative hypothesis H31 is identified as the correct status combination of the suspect set. Although this configuration establishes that switching branches 5-17, 5-18 and 14-16 are closed, flows through those devices are negligible and the post-processing stage included in the algorithm indicates that their real status is open. Therefore, the final configuration identified to the suspect set is {1 1 0 0 0}, which corresponds to the correct status combination. 9 Conclusions OPOLOGY errors in power system real time modeling are treated in this paper as a multiple bad data problem by partitioning the set of switching devices into “suspect” and “true” subsets before applying hypothesis testing based identification. To ensure good performance at the identification step, all devices with wrong status must be included in the suspect subset. Since the usual criteria to select the suspect devices are unable to verify that, one is led to apply heuristic schemes that may prove to be inefficient. This paper introduces a geometrically based test which is able to check if all wrongly modeled devices are in fact contained in the suspect subset. The test is simple, easy to implement and significantly contributes to improve the overall performance of the topology error identification
T
method. The derivation of the geometric test is presented in detail, as well as its incorporation into the identification algorithm. Several tests conducted on the IEEE 30-bus system confirm that the geometric test performs well, and in some cases is essencial to ensure the correct identification of switching branch status. REFERENCES [1] A. Monticelli. “Modeling Circuit Breakers in Weighted Least Squares State Estimation". IEEE Trans. on Power Systems, 8(3):1143–1149, August 1993. [2] O. Alsaç, N. Vempati, B. Stott, and A. Monticelli. “Generalized State Estimation”. IEEE Trans. on Power Systems, 13(3):1069–1075, Aug. 1998. [3] K. A. Clements and A. Simões Costa. “Topology Error Identification using Normalized Lagrange Multipliers”. IEEE Trans. on Power Systems, 13(2):347–353, May 1998. [4] J.C. Pereira, J.T. Saraiva, V. Miranda, A.J. Simões Costa, E.M. Lourenço, and K.A. Clements. “Comparison of Approaches to Identificatify Topology Errors in the Scope of State Estimation Studies”. IEEE Porto Power Tech, Porto, Portugal, Paper EDT3-176, Sep. 2001. [5] A. De La Villa and A. Gómez. “Modeling Unknown Circuit Breakers in Generalized State Estimators”. IEEE Porto Power Tech, Porto, Portugal, Paper EDT4-221, Sep. 2001. [6] J. Pereira, J. T. Saraiva, and V. Miranda. “Some Practical Issues in the Migration of State Estimation Modules from EMS to DMS System”. PMAPS Conference, 2000. [7] A. Abur, H. Kim, and M. K. Celik. “Identifying the Unknown Circuit Breaker Statuses in Power Networks". IEEE Trans. on Power Systems, 10(4):2029–2037, Nov. 1995. [8] E. M. Lourenço. “Observability Analysis and Topology Error Identification in the Generalized State Estimation”. Ph.D. thesis, Electrical Engineering Graduate Program, Universidade Federal de Santa Catarina, Brazil, (in Portuguese) 2001. [9] L. Mili, T. Van Cutsem, and M. Ribbens-Pavella. “Hypothesis Testing Identification : A New Method for Bad Data Analysis in Power System State Estimation”. IEEE Trans. on Power Apparatus and Systems, 103(11):3239–3252, Nov. 1984. [10] K. A. Clements and P. W. Davis. “Multiple Bad Data Detectability and Identifiability: a Geometric Approach”. IEEE Transaction on Power System, 3(4):461–466, Nov 1985. [11] A. Monticelli and A. Garcia. “Modeling Zero Impedance Branches in Power System State Estimation". IEEE Transactions on Power Systems, 6, 1991. [12] A. Gjelsvik. “The Significance of the Lagrange Multipliers In WLS State Estimation With Equality Constraints”. Proceedings of the 11th Power Systems Computation Conference, 1993. [13] G. W. Stewart. “On the Perturbation of Pseudo-Inverses, Projections and Linear Least Squares Problems”. SIAM Review, 19(4):634–662, Oct. 1977. [14] K. A. Clements. “Bilateral Transaction Reconciliation”. Internal Report - WPI, 1998. [15] K. A. Clements, A. Simões Costa, and A. Agudelo. “Bayesian Estimation to the Identification of Undisclosed Bilateral Transactions”. PMAPS Conference, Madeira, Portugal, 2000.