Gossip-based Topology Inference for Efficient Overlay Mapping on Data Centersâ. Thorsten Schütt, Alexander Reinefeld, Florian Schintke, and Marie Hoffmann.
Gossip-based Topology Inference for Efficient Overlay Mapping on Data Centers⇥ Thorsten Sch¨utt, Alexander Reinefeld, Florian Schintke, and Marie Hoffmann Zuse Institute Berlin Abstract We present a distributed algorithm for identifying the location of data centers and their relative sizes. This topology information can be used in P2P systems to improve the routing performance, replica placement, or job scheduling. The algorithm uses gossiping with local agglomerative clustering. It is robust to failures and it correctly identifies outliers that are caused, e.g., by temporarily overloaded nodes or network failures. We present empirical results on the Grid 5000 testbed.
1
Introduction
When deploying P2P systems in the Internet, it is important to minimize the stretch between the under- and the overlay network. Knowing the current topology of the underlay allows to speed up the routing process, to improve replica placement, and to optimize gang scheduling of parallel processes—to name just a few of the many advantages. With the recent focus on cloud computing and data centers topology-aware process placement became an important research topic. Widely varying latencies of inter- and intra-center links and correlated resource failures make it difficult to determine an optimal process mapping. If the topology and size of data centers were known, existing P2P protocols [9] could be optimally mapped onto data centers to provide better access latency with less maintenance traffic [11]. We present an algorithm for gossip-based topology inference which uses only local knowledge. It derives the network topology by continuously checking the network latencies between nodes with a network coordinate system [1, 12] and grouping them with agglomerative clustering [2]. This allows to identify clusters of nearby located nodes and to detect outliers (e.g., caused by temporary overload) with high confidence. The algorithm is robust with respect to failures and it finds node clusters in a logarithmic number of distributed communication steps. Part of this work was carried out under the SELFMAN and XtreemOS projects funded by the European Commission
While topology inference is our main focus in this paper, the clustering algorithm can also be used for other tasks. As an example, we determined CPU speeds and memory sizes of the nodes in the Grid 5000 testbed (Sec. 4). The resulting resource classes can be used to aid Grid schedulers or to determine optimal replica placement in P2P systems [9]. In Section 2 we briefly recall gossiping, network coordinate systems and clustering techniques. In Section 3 we present our gossip-based algorithm for agglomerative node clustering and in Section 4 we present results obtained on the Grid 5000 environment. Section 5 gives a brief conclusion and outlook.
2
Background
Gossiping [7] is a well-established method in distributed systems. It is used for information dissemination, information aggregation, peer sampling [10], and overlay construction [5]. Gossip algorithms are easy to implement, they are tolerant to node failures and they converge fast—usually in a logarithmic number of communication rounds. In each gossip operation, an active node selects a peer at random, exchanges information with it, and updates its local data with the received information. Network Coordinate Systems are used to build a model that predicts the round-trip time between any two nodes. The algorithm starts in each node by assigning itself a random coordinate which is subsequently refined by exchanging coordinate information with other nodes to improve the prediction quality. We use the gossip-based Vivaldi [1] algorithm with a 2-dimensional Euclidean coordinate space. Several models for network coordinate systems have been evaluated [1], including higher-dimensional Euclidian spaces, Euclidian spaces with height vectors representing the individual delays of the access line to the Internet core network (e.g. queueing and DSL link delays, oversubscribed links) and spherical coordinates which were initially deemed to model the earth surface best. For our purpose, simple 2D coordinates are sufficient. Clustering is a common technique in data mining [4, 3] to group data so that the members of a group have similar properties. Clusters are usually represented by centroids,
1 2 3 4 5 6 7 8
/ / active thread Peer p := selectRandomPeer ( ) sendTo ( p , c e n t r o i d s ) receiveFrom (p , remoteCentroids ) / / aggregate data c e n t r o i d s := c e n t r o i d s ⇤ remoteCentroids c e n t r o i d s := a g g l C l u s t e r i n g ( c e n t r o i d s , r ) c e n t r o i d s := normalize ( c e n t r o i d s )
1 2 3 4 5 6 7 8
/ / passive thread ( p , r e m o t e C e n t r o i d s ) := receiveFromAny ( ) sendTo ( p , c e n t r o i d s ) / / aggregate data c e n t r o i d s := c e n t r o i d s ⇤ remoteCentroids c e n t r o i d s := a g g l C l u s t e r i n g ( c e n t r o i d s , r ) c e n t r o i d s := normalize ( c e n t r o i d s )
Figure 1. Framework for gossip-based clustering. 1 2 3 4 5 6 7 8 9 10 11 12 13 14 15 16
agglClustering ( centroids , radius ): / / get indices of c l o s e s t centroids ( p , q ) := c l o s e s t P o i n t s ( c e n t r o i d s ) while s i z e ( c e n t r o i d s ) > 1 and d i s t ( p , q ) < r a d i u s : / / aggregate s i z e s s i z e := p . s i z e + q . s i z e / / merge c l o s e s t c e n t r o i d s new centroid := ( p . c e n t r o i d p . s i z e + q . centroid q . size )/ size / / update c e n t r o i d s c e n t r o i d s . remove ( p ) c e n t r o i d s . remove ( q ) c e n t r o i d s . add ( n e w c e n t r o i d , s i z e ) ( p , q ) := c l o s e s t P o i n t s ( c e n t r o i d s ) return c e n t r o i d s
Figure 2. Agglomerative clustering. i.e. the centers of the clusters. Two widely used algorithms are k-means clustering [8] and agglomerative clustering [2]. The former clusters the data points into k groups and tries to minimize the distance of data points from their respective centroids. The latter clusters data points in the same group iff their similarity is below a given threshold. In k-means the number of clusters is given as a parameter, while in agglomerative clustering the number of clusters is determined by the similarity threshold and the data distribution. We focus on agglomerative clustering because the number of data centers is generally not known in advance. We define a similarity metric based on network latency and give a latency threshold for when nodes are located in the same site.
3
Gossip-based Clustering Algorithm
Each node executes the algorithm shown in Fig. 1. The algorithm consists of an active thread which initiates the communication and a passive thread that waits for incoming messages. Each node maintains a list of already detected clusters with their centroids and relative sizes. The sizes of all clusters sum up to 1. On startup, each node initializes its centroids list with its own coordinate and the relative cluster size 1. It then selects a random communication partner with a peer sampling al-
gorithm [10, 6]. The partners exchange their centroids lists and run the agglomerative clustering algorithm (called in line 7 of Fig. 1, function shown in Fig. 2) on the merged lists. The centroids’ relative sizes are then normalized so that they sum up again to 1 (line 8 of Fig. 1). The agglomerative clustering algorithm shown in Fig. 2 iteratively merges the two closest centroids p and q and computes the weighted average (line 9, 10 of Fig. 2) resulting in a new list of centroids.
4
Results
We used our clustering algorithm to determine the network topology and various node attributes of the French Grid 5000 testbed1 . It comprises 1604 compute nodes spread over nine sites (data centers) which are initially unknown to the algorithm.
4.1
Topology Inference
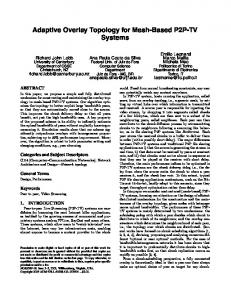
To determine the topology of Grid 5000, we assign each node a network coordinate. This coordinate is used for initializing the nodes’ local view. Since the number of data centers is not known, we use agglomerative clustering (Fig. 2) with a threshold denoting the maximum expected latency inside a data center. The centroids resulting from agglomerative clustering are network coordinates which represent the centers’ center of gravity and their relative sizes. Fig. 4 shows the actual size and location (circles) and the estimated locations (⇤) of the data centers that were identified by our algorithm after 1.5 log2 N communication rounds, with N being the number of nodes. We simulated 100 nodes based on the Grid 5000 node distribution and plotted all centroids (⇤) identified by all nodes. After 1.5 log2 N rounds the error is already relatively small. Convergency is shown in Fig. 3 and discussed later. Detecting Outliers Nodes that are overloaded or weakly linked to the network due to wrong configuration will be slow in answering requests. Consequently, the clustering 1 https://www.grid5000.fr/
Error of estimated cluster size per node
Error of estimated cluster size per node
1
n=10 n=100 n=1000 n=2000
0.1
0.01
0.001
0.0001 0
5
10
15
20
25
30
35
40
45
50
0.1
cores harddisc memory
0.01
0.001
0.0001 5
10
Round
20
25
30
35
40
45
50
Round
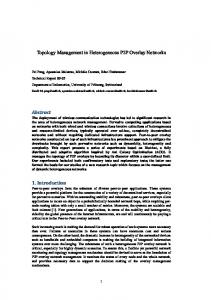
Figure 3. Error reduction per communication round for different grid sizes.
Figure 5. Error reduction per commmunication round.
52 Relative Cluster Size
0.6
50
!.&&%('()*+,-
15
48
46
After log N rounds Correct Cluster size Standard deviation
0.5 0.4 0.3 0.2 0.1 0
44
2
4
8
Cores
42
4
2
0
2
4
6
8
!"#$%&'()*+,-
Figure 4. Centroids and relative cluster sizes in Grid 5000. + denotes node locations and ⇥ denotes the
estimated centroids of each node. The circles’ sizes show the actual relative cluster sizes determined by central clustering.
algorithm puts their coordinates far away from all other nodes, resulting in singletons which clearly identifies these points as outliers. Similarly, network failures within a data center can cause a subset of nodes to form a cluster, but again, they are easy to identify, because they will lie far outside of other data centers’ clusters. Convergence To analyze the convergence of the cluster algorithm, let |c| be the total number of centroids in a system with N nodes and let ci be the centroids in the local view of node i. Then cij is the jth centroid of ci and wij is its relative size. Furthermore, let wk be the relative size of the closest real centroid ck obtained by a globally informed clustering algorithm that minimizes the expression ||cij ck ||. Then the average error of the cluster sizes is error =
1 |c|
N
|ci |
i=1 j=1
(wij
wk )2
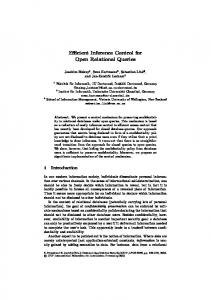
Figure 6. Grid5000 nodes clustered by #cores.
For Fig. 3, we simulated networks with different numbers of nodes. The graph shows that the algorithm converges after ⌅ log2 N rounds. Fig. 5 presents the same metric for clustering node properties (discussed below). As can be seen, the error decreases exponentially, eventually converging after ten rounds.
4.2
Aggregating Resource Data
The nodes in Grid 5000 are heterogeneous and were procured from different vendors. We used our algorithm to additionally aggregate the processor speeds, the number of cores, the main memory sizes, and the hard disk sizes. Cores For the number of cores, we put nodes in the same cluster if their number of cores differed by less than one. For such integer-valued attributes, the clustering can be precisely steered: If the similarity threshold is set to 1, nodes will only end up in the same cluster when their attribute has exactly the same value. Fig. 6 shows that three centroids with 2, 4, and 8 cores were found in Grid 5000. The left bars show the average cluster sizes after running log2 N communication rounds. For comparison, the
0.7
After log N rounds Correct Cluster size Standard deviation
0.6 Relative Cluster Size
0.6 Relative Cluster Size
0.7
After log N rounds Correct Cluster size Standard deviation
0.5 0.4 0.3 0.2 0.1
0.5 0.4 0.3 0.2 0.1
0
0 70
73
80
146
160
250
600
2
Disc Space [GB]
4
8
32
160
Main Memory [GB]
Figure 7. Grid5000 nodes by disc size.
Figure 8. Grid5000 nodes by memory size.
right bars show a (hypothetical) central algorithm with complete knowledge. All data lies in the confidence interval and the average cluster sizes are close to the exact values after log2 N rounds (see also Fig. 5). Disk Size For determining the hard disk sizes, we set the similarity threshold to 1 GB. Hence only disks of exactly the same size are clustered together. Fig. 7 shows that all seven different hard disk sizes were correctly identified and that the relative sizes are also close to the correct values. Memory Size For computing the main memory sizes we used 1 GB as the similarity threshold. After log2 N rounds all four main memory classes were correctly identified (Fig. 8). Although the relative sizes span several orders of magnitude, the approximations are reasonably good.
data center. Proximity routing along the extra pointers will then be used to minimize lookup latencies and the relative cluster sizes could be used to decide how many pointers should be placed to each data centers.
5
Conclusion and Future Work
We presented a simple, yet powerful gossip-based clustering algorithm for data aggregation in distributed systems. The algorithm is robust with respect to failures and it correctly identifies outliers. Empirical results on Grid 5000 are in good agreement with the actual data. The algorithm can be used for a wide variety of data aggregation tasks like topology inference, replica placement, or process placement. When the total number of nodes in the overlay is known (or can be approximated), the number of nodes in each cluster can be determined by multiplying its relative size by the total number. This information can be used for mapping data replicas or for job scheduling. In the latter case, it could be beneficial to group nodes e.g. into ‘fat’ nodes with multiple cores and a large main memory and into ‘normal’ nodes. Our work was motivated by the need for obtaining topology information in global P2P networks. We intend to use the clustering algorithm for deploying DHTs onto data centers. The clustering information will be used to improve the routing by adding extra pointers to the routing table so that each routing table has a given number of pointers to each
References [1] F. Dabek, R. Cox, M. F. Kaashoek, and R. Morris. Vivaldi: A Decentralized Network Coordinate System. ACM SIGCOMM 2004. [2] W. H. E. Day and H. Edelsbrunner. Efficient algorithms for agglomerative hierarchical clustering methods. Journal of Classification, 1:7-24, 1984. [3] I. Eyal, I. Keidar, R. Rom. Distributed Clustering for Robust Aggregation in Large Networks. HotDep, Jun. 2009. [4] A.K. Jain, M.N. Murty, P.J. Flynn. Data Clustering: A Review. ACM Computing Surveys, 31(3), Sept. 1999. [5] M. Jelasity and O. Babaoglu. T-Man: Gossip-based overlay topology management. ESOA 2005. [6] M. Jelasity, R. Guerraoui, A. M. Kermarrec, and M. van Steen. The peer sampling service: Experimental evaluation of unstructured gossip-based implementations. Middleware’04. [7] A. M. Kermarrec and M. Steen. Gossiping in Distributed Systems. ACM Operating System Review 41(5). Oct. 2007. [8] H. Steinhaus. Sur la division des corp materiels en parties. Bulletin L’Acadmie Polonaise des Science C1. III, IV, 1956. [9] I. Stoica, R. Morris, D. Karger, M. F. Kaashoek, and H. Balakrishnan. Chord: A Scalable Peer-to-peer Lookup Service for Internet Applications. ACM SIGCOMM 2001. [10] S. Voulgaris, D. Gavidia, and M. van Steen. CYCLON: Inexpensive Membership Management for Unstructured P2P Overlays. J. Network Syst. Manage. 13(2), 2005. [11] M. Waldvogel and R. Rinaldi. Efficient Topology-Aware Overlay Network. ACM SIGCOMM 2003. [12] G. Wang and T. S. E. Ng. Distributed algorithms for stable and secure network coordinates. IMC 2008.