IEICE TRANS. ??, VOL.Exx–??, NO.xx XXXX 200x
1
PAPER
Group Testing Based Detection of Web Service DDoS Attackers Dalia NASHAT†a) , Nonmember, Xiaohong JIANG†b) , Member, and Michitaka KAMEYAMA†c) , Fellow
SUMMARY The Distributed Denial of Service attack (DDoS) is one of the major threats to network security that exhausts network bandwidth and resources. Recently, an efficient approach Live Baiting was proposed for detecting the identities of DDoS attackers in web service using low state overhead without requiring either the models of legitimate requests nor anomalous behavior. However, Live Baiting has two limitations. First, the detection algorithm adopted in Live Baiting starts with a suspects list containing all clients, which leads to a high false positive probability especially for large web service with a huge number of clients. Second, Live Baiting adopts a fixed threshold based on the expected number of requests in each bucket during the detection interval without the consideration of daily and weekly traffic variations. In order to address the above limitations, we first distinguish the clients activities (Active and Non-Active clients during the detection interval) in the detection process and then further propose a new adaptive threshold based on the Change Point Detection method, such that we can improve the false positive probability and avoid the dependence of detection on sites and access patterns. Extensive trace-driven simulation has been conducted on real Web trace to demonstrate the detection efficiency of the proposed scheme in comparison with the Live Baiting detection scheme. key words: Distributed Denial of Service, Group-testing, Intrusion detection, Change point detection
1.
Introduction
One of the major threats to network security is the distributed denial of service (DDoS) attack, which prevents legitimate users from accessing their deserved services [1]. According to the World Wide Web (WWW) Security FAQ [2], a DDoS attack can be described as an attack designed to render a computer or a network incapable of providing normal services. The DDoS attackers launch the attack at the network layer to consume the network bandwidth or at the application layer to attack the victim web servers. Since many effective defense mechanisms have been proposed to protect the network from bandwidth attack, recently the attackers target the application layer and establish a more sophisticated type of DDoS attack to disable the legitimate clients from using this application. There are two common methods to launch the †
The authors are with the Graduate School of Information Science, Tohoku University, Aobayama 6-3-09, Sendai, 980-8579 JAPAN a) E-mail:
[email protected] b) E-mail:
[email protected] c) E-mail:
[email protected]
Client
Attacker
Client Attacker Client Attacker Client
Internet
Web Server Fig. 1
Simple scenario of DDoS Attack.
DDoS flooding attack in web service [3]. First, attackers can consume the victim web server by sending a query for large amount of data. Second, attackers can cause the entire application to fail by overloading the server with a huge number of requests as illustrated in Fig.1. We focus on the second method because it is the most widely used method to launch the DDoS attack on web service. The available defense schemes against DDoS attack can be generally classified into four different categories: Attack Prevention, Attack Detection, Attack Reaction and Attacker Traceback. Among them, Attack detection is the most widely investigated topic [4]. The intrusion detection schemes detect DDoS attack based on either the signatures of known attacks (referred as Misuse Detection Schemes) or the feature(s) of abnormal traffic behavior under the attack (known as Anomaly Detection Schemes). With regard to the target of detection schemes, we distinguish between schemes that detect the attack (attack detection schemes) and schemes that detect the identity of the attacker (attacker detection schemes). In comparison with the attack detection schemes, the attacker detection schemes offer us several advantages. First, if we can detect the identity of the attacker early, all malicious packets can be dropped and the victim will
IEICE TRANS. ??, VOL.Exx–??, NO.xx XXXX 200x
2
gain more time to apply attack reaction mechanisms. Second, we can detect the attacker without applying the expensive traceback mechanisms. Finally, the detection of source attack can prevent flooding attack traffic from exhausting the network bandwidth and protect legitimate users from denying their services. However, detecting the identities of the attackers requires high state overhead, which makes it inefficient for large web service. Also, the detection should be fast and has low probability of false positive, such that only the malicious packets can be blocked. Recently, an efficient approach Live Baiting was proposed for detecting the identities of DDoS attackers in web service based on the group testing theory [5]. Although Live Baiting uses low state overhead without requiring either the models of legitimate requests nor anomalous behavior, its detection algorithm has two limitations: • Clients activity: the detection algorithm assumes that all clients of the web service are suspects during the detection interval even if some of them are inactive. Thus, it leads to a high false positive probability especially for large web service with a huge number of clients. • Fixed threshold: the detection algorithm uses a fixed threshold based on the expected number of requests in each bucket during the detection interval without the consideration of daily and weekly traffic variations. Therefore, the detection decision is inaccurate and sensitive to site and access pattern. In order to address the above limitations, we first consider the clients activity (Active and Non-Active clients during the detection interval) and then propose a new adaptive threshold based on the Change Point Detection, such that we can improve the false positive probability and avoid the dependence of detection on sites and access patterns. The reminder of this paper is organized as follows. Section 2 discusses the related work. In section 3, we briefly review the Live Baiting detection scheme and describe its limitations. Section 4 describes our detection scheme in detail. Section 5 provides the related performance evaluation and comparison. Finally, Section 6 concludes this paper. 2.
Related Work
The available detection schemes for the DDoS attack like schemes in [6], [7] and [8] focus on the detection of the attack rather than the identities of the attackers. The main idea of these schemes is to periodically compare the current state of the system with a model of normal system behavior, thus the attack traffic can be detected. While these schemes are robust and simple, they can not provide any information about the IP ad-
dress of the attacker. Therefore, they need to rely on the expensive IP traceback mechanisms for the detection of attackers. Also, these schemes detect the attack after the flooding attack packets pass through the network and share the same paths as legitimate packets, which significantly exhausts the network resources. A few attacker detection schemes have been proposed so far to detect the identity of the DDoS attackers in web service. The CAPATCHA mechanism [9] is now almost a standard security mechanism for defending against attackers in websites. This mechanism works through generating and grading a set of tests that are solvable by human, but solving such tests usually beyond the capabilities of current computer programs. The main disadvantage of CAPTCHAs is that it is not suitable for people with visual impair. Also, users feel annoyed when they are interrupted by CAPTCHAs problems, which always waste their time. A session scheduling algorithm has been proposed in [10] based on building profiles for normal client behavior with respect to session inter-arrival times, request inter-arrival times and session workload profile. This scheme detects the suspicious requests based on the content of the requests, but it needs to keep state for each session, which makes the detection scheme itself vulnerable to the DDoS attacks. The honeypot scheme [11] works by baiting the attacker to install master or agent code within the honeypot, thus masters or agents are trapped and their packets can be dropped. Honeypot scheme is effective in detecting hosts exploited by Internet worms. It is notable, however, that honeypots are deployed on machines different than the ones they are supposed to protect, so sophisticated attacks can avoid the honeypots. 3.
Overview of Live Baiting
3.1
Live Baiting Architecture
It is notable that among the attacker detection schemes for web service proposed by now, the live baiting scheme in [5] is the most promising one, because the number of states needed by this scheme is in the order of number of attackers not the total number of clients, which makes it scalable for large service with a huge client population. Also, this scheme does not require modification inside the network, thus it is not expensive to apply. Since the web service can be divided into classes (e.g, HTML, Images, Sound, Video, ...etc), so the maximum aggregate service capacity C (measured by req./sec.) of each class is fixed under normal condition. Under the DDoS attack, however, the number of request packets from the attackers will be significantly higher than the maximum capacity of the service, because the attackers send a lot of request packets to the server at the same time to overwhelm it and drop any
NASHAT et al.: GROUP TESTING BASED DETECTION OF WEB SERVICE DDOS ATTACKERS
3
Buckets
Clients 1
2
3
4
5
6
7
8
9
A
1
0
0
0
0
1
0
0
1
B
0
1
0
0
1
0
0
1
0
C
0
0
1
0
0
0
0
1
0
D
0
0
0
0
0
0
1
0
0
E
1
0
1
1
0
1
0
0
0
F
0
1
0
0
0
0
1
0
1
(a) Group testing matrix Clients
1
2
3
4
5
6
7
8
9
Buckets
Test Results
+ ! ! ! + !
A B C D E F
When a matrix element at row i and column j is set to 1, this indicates that client j is assigned to bucket i (e.g. client 1 is assigned to bucket A and E). Then, live baiting computes the threshold called High Water Mark (HWM ) for the expected number of requests in each bucket during the detection interval time as: HW M =
C ·P T
(1)
where P is the length of detection interval. Let’s say that the detection interval in this simple example is 10 sec, so the (HWM ) is 15. Finally, live baiting puts all clients in the suspect list and counts the number of requests in each bucket. If the number of requests in a bucket exceeds a threshold, its corresponding test result is labeled as positive (e.g. bucket A and E), otherwise it is labeled as negative as shown in Fig.2(b). The clients assigned to negative tests (i.e. buckets with number of requests less than HWM) will be removed, so here clients 2,3,5,7,8,9 will be removed and the remaining clients in the suspect list will be detected as attackers, so clients 1,4,6 will be detected as attackers. 3.2
Limitations of the Available Detection Algorithm in Live Baiting
HWM
A
B
C
D
E
F
Buckets
(b) The current live baiting detection algorithm Fig. 2 Example of live biting with N =9 clients, T =6 tests and d=2 attackers
incoming legitimate requests. Based on the previous observation, the live baiting detection scheme uses the group testing theory [12] to detect the identity of the attackers among clients of a public web service. To detect the attackers of web service with total number of clients N using the group testing theory, the live baiting scheme first divides the service class capacity (e.g Images) into a number of virtual servers, called buckets (T ). Then, design a binary group testing matrix T × N with rows corresponding to buckets and columns corresponding to clients. According to this matrix, each client receiving tokens will send requests to his corresponding buckets only. The Fig.2 illustrates a simple example of web server with total N = 9 clients, the server has aggregate capacity C = 9 req/sec and each legitimate client sends 1 req/sec. Two attackers d = 2 request the service at a high rate of 2 req/sec for each. The live baiting first divides the server capacity into T = 6 buckets from A to F and construct the 6 × 9 binary group testing matrix as shown in Fig.2(a).
The current detection algorithm of live baiting is quite simple to apply. However, it has the following two limitations: 1. During each detection interval time, the detection algorithm in live baiting uses a fixed threshold based on the expected number of requests in each bucket in the detection interval. It is notable, however, that the number of requests in each bucket may vary dramatically from time to time according to the clients activity. To make the detection algorithm much more generally applicable and its deployment much easier, it is necessary to use a detection method that is adaptive to daily and weekly variations. 2. The detection algorithm adopted in live baiting starts with the assumption that all clients are in the suspect list and for each negative test, it removes the clients assigned to the corresponding bucket from the suspect list. Some legitimate clients may be assigned to the same buckets of the attackers, so they will be detected as attackers even if they do not send any request during the detection interval time. This leads to a high false positive probability especially for large service with a huge number of clients. To illustrate the limitations of the detection algorithm adopted in the live baiting , we still consider the simple example shown in Fig.2. In this example, the server can serve 9 clients, two of them are attackers
IEICE TRANS. ??, VOL.Exx–??, NO.xx XXXX 200x
4
Begin detection interval Request from c
Put c in suspect list
No
Is c in suspect list? yes Increment the bucket counter
No
detection interval finished? yes Change point detection
Decision
Fig. 3 The flowchart of the new detection scheme inside one bucket.
(client 1 and client 4). During the detection interval time, some clients are Non-Active (i.e. do not send requests), like 3, 6 and 9, and the attackers send requests with higher rate than the legitimate clients, so their corresponding buckets (bucket A and E) will exceeds the HWM. In this example, the live baiting detects all attackers, so the false positive probability is 0. Notice that, client 6 is detected as attacker even it is Non-Active during the detection time, because it is assigned to the same buckets with attacker number 1 (i.e. buckets A and E), thus the false positive probability is 91 . Therefore, the false positive probability will increase dramatically in the current large web service with a huge number of clients, which makes this detection algorithm not suitable for the large scale web service. To address the above two limitations of the available detection algorithm, we propose here a new detection algorithm. 4.
A New Detection Scheme
In this section, we first show the overall architecture of our new scheme for the detection of flooding DDoS attackers in the web service, then we introduce in details its two main modules, i.e. the Randomized Matrix Construction and the detection Algorithm. 4.1
Overall Detection Architecture
The Fig.3 illustrates the flowchart of our proposed detection scheme inside one bucket. The main idea of the proposed scheme is to first use the same randomized construction algorithm like live baiting to generate the matrix used in the group testing. Then, each client is assigned to one column in the matrix and is given a set of tokens, one for each 1-bit in its column in the
matrix. Rather than regarding all clients as suspects during each detection interval, we regard only the active clients (client who send requests during this interval time) as suspects and count their requests in each bucket. To make the number of incoming requests in each bucket independent of the site and the access patterns, this number is normalized by the average number of the incoming requests in each bucket in the previous intervals. Finally, based on this normalized number of incoming requests in each bucket, we propose a new adaptive threshold based on the Change Point Detection method to make the detection decision. 4.2
Randomized Matrix Construction
A non-adaptive group test algorithm with total N members, d estimate number of defective members and T tests can be represented by a binary T ×N matrix M in which element (i, j) has entry 1 if and only if member j is contained in test i. The authors in [13] presented a simple randomized non-adaptive group testing matrix by setting each 1 M (i, j) = 1 with probability d+1 and excluding a nondefective member if it participates in one test with a negative result. They proved that the algorithm can detects all defective members with minimum false positive probability f p : f p = (1 −
1 d T 1 (1 − ) ) d+1 d+1
(2)
From Equation (2), the number of tests T needed to achieve a false positive probability f p can be computed as [5]: T =
log(f p) 1 log(1 − d+1 (1 −
1 d d+1 ) )
(3)
To apply the idea of randomized matrix for detecting DDoS attackers of web service, we divide the aggregate server capacity for one service C into virtual buckets and map these buckets to tests in the matrix M . Clients of the server are mapped into the matrix columns and each client is given a number of secured tokens for each 1-bit in his corresponding column [5]. Thus, each incoming request to the web server is marked with the corresponding token containing the row index (bucket number) of its client. These tokens are renewed periodically (e.g. every day) for security. By this way, the server can drop any spoofed request and each client is enforced to send his requests to his buckets only, which make the detection more robust. 4.3
Detection Algorithm
The main function of the detection algorithm in the proposed detection scheme is to first classify the clients of the web service to active and non active clients.
NASHAT et al.: GROUP TESTING BASED DETECTION OF WEB SERVICE DDOS ATTACKERS
5
Then, a new adaptive threshold based on the change point detection method is applied to make the detection decision. 4.3.1
Clients Activity
As described in Sect. 3.2 that in the real web service, some legitimate users who do not send any requests during the detection time may still be detected as attackers if they share the same buckets with attackers in the randomized matrix. Since some clients may send requests and other clients may not send requests in the same detection interval time, the first step in the proposed detection scheme is to classify the clients to Active and NonActive clients during each detection interval. By this classification of clients during each detection interval time, only active members (not all members as the live baiting scheme) will be in the suspect list. Thus, we can reduce the false positive probability and make our scheme more efficient and generally applicable for large web service with a huge number of clients. For the example shown in Fig.2(b), all the clients are classified as active clients except clients 3,6,9, because they do not send requests during the detection interval time. Thus clients 1,4 will be detected as attackers and the false positive probability will be zero. Based on the the previous randomized matrix, in every detection interval n, the detection algorithm at the server works as follows: 1. Check the token of every received request packet and drop the request if it is not valid or comes from attacker already detected before (i.e client in the block list). Otherwise: • Classify this client as active member. • Put the IP address of this client in the suspect list. • Increment the corresponding bucket of this request by one. 2. Do Step 1) for any incoming request. Notice that, the DDoS attackers overloading the server with a huge number of requests, so they are always classified as active members during the attack time. 4.3.2
The Change Point Detection
The detection algorithm in live baiting uses a fixed threshold during each detection interval time based on the expected number of requests in each bucket in the detection interval. It is notable, however, that the number of requests in each bucket may vary dramatically from time to time according to the clients activity. Therefore, we propose here a new adaptive threshold based on the change point detection, such that we can
avoid the dependence of detection on sites and access patterns. The change point detection method [14] is generally adopted to test if an observed time series is statistically homogeneous. When a change occurs to a homogeneous series (i.e., a sudden change from homogeneous to heterogeneous), the change point detection can be used to efficiently determine the point in time when this change happens. The main function of change point detection in our new scheme is to decide if a bucket contains attacker, and if yes, to find the point in time when the attack happens. Let Xni denote the number of requests in bucket i within the detection interval n. To eliminate the dependence of Xni upon both the observation time and the number of active clients in each bucket, Xni should be normalized by the mean Mni of incoming requests ¯ ni denote the estiduring an observation period. Let M mation of Mni based on the number of requests in first n ¯ i can be estimated in observation periods. Then the M n real time and update periodically from the Exponential Weighted Moving Average (EWMA) of previous measurements: i ¯ ni = β M ¯ n−1 M + (1 − β)Xni
(4)
where β is the EWMA smoothing factor lying strictly between 0 and 1. eni is independent eni = Xni − M ¯ i , then X Define X n−1 of the weekly and daily variation in each buckets. Thus, e i as a stationary random process and we can consider X n its mean value will change when the DDoS flooding attack occurs in the bucket. To detect the point in time when such change in the mean value occurs in Xni , we use the change point detection based on non parametric CUSUM algorithm [15], because the complexity of this algorithm is very low and this algorithm fits our requirement of sequential and non-parametric test for eni . X eni is Under normal operation, the mean value of X i zero (i.e Mn = 0). When the DDoS attack occurs, e i in attacked buckets will however, the mean value of X n become a large positive value of Mni . Since the values of Mni can not be known beforehand, it can be approximated with αMni , where Mni can be adopted periodically using the exponential weighted moving average and α is an amplitude percentage parameter of increase of the mean rate after the attack has occurred. Let i + Yni = [Yn−1
¯i ¯i αM n−1 ¯ i − αMn−1 )]+ (5) + (X − M n n−1 σ2 2
where x+ equals to x if x > 0 and 0 otherwise. i.e., the maximum continuous increment until time n. A large Yni is a strong indication of DDoS attack in the bucket i. Thus, we can define the corresponding decision rule as [16]:
IEICE TRANS. ??, VOL.Exx–??, NO.xx XXXX 200x
6
dN (Yni ) = I(Yni > h),
(6)
where h is the decision threshold and I(·) is the indicator function at observation period, which gives value ‘1’ to indicate an attack and ‘0’ to indicate a normal condition. If the value of Yni in bucket i exceeds the h value, its corresponding test is marked as positive. Otherwise, its corresponding test is marked as negative. Then, for each negative test, we remove all clients assigned to these tests from the suspect list. Finally, the rest of the suspect are detected as attackers and added to the block list. 4.3.3
Parameter Specification
To apply the change point detection method based on CUSUM algorithm, we need to specify four parameters β, the EWMA factor; α, the most probable percentage of increase of the mean rate after the attack; n, the detection interval time and h, the threshold. In the DDoS attack, the number of requests in each attack bucket will suddenly increase during the attack time. To make our detection scheme sensitive to this rapidly change in the number of incoming requests in each bucket, the value of the smoothing factor β in the EWMA should be close to 1 to give more weight to the recent observations. Also, the authors in [15] mentioned that the best performance of the CUSUM algorithm is achieved when β is in the interval [0.95, 0.99]. Therefore, we choose β = 0.98 in our proposed method. eni ) = 0 (i.e The CUSUM algorithm requires E(X e i ) > 0 after the Mni = 0) before the attack and E(X n attack (i.e αMni > 0). Therefore, the parameter α intuitively corresponds to the most probable percentage of the increase of the mean incoming requests rate in each bucket after attack has occurred. If we set α close to 1, we can get a low false positive probability at the cost of a bad sensitivity. In contrast, when α is set close to 0, a very good sensitivity is guaranteed at the expense of a relatively high false positive probability. Thus, in general the α should be set to a value around 0.5 to achieve a good trade off between sensitivity and false positive probability. Here, we set α as 0.5 in our simulation. For the detection interval time n, it should not be too long since the bursty legitimate request arrivals in a long detection period may significantly increase the false positive probability [5]. Therefore, the n should be chosen from a small range (say, in the range of [5,20] seconds as discussed in [15]) to guarantee the best performance of the CUSUM algorithm. We adopt n = 20 seconds in our simulation. The basic principle for determining the threshold h of the CUSUM algorithm is to find as small value as possible for it to achieve a high detection sensitiv-
ity while guaranteeing no false alarm happens during normal traffic behavior. Thus, to determine the best value of h, we need first compute the value of Yn for {n = 0, 1, ..} for normal traffic, then we just set the threshold h as a value that is just larger than the maximum value of Yn , so no false alarm is reported for normal traffic while a good sensitivity is guaranteed. Based on this principle, we determined h = 1 in our simulation. 5.
Performance Evaluation
In this section, we investigate that as compared with the live baiting detection scheme how much the detection efficiency and false positive probability can be further improved by considering the clients activity and using the change point detection. 5.1
Simulation Environment
The performance evaluation was conducted by tracedriven simulation experiments, where real web trace were adopted in our simulation. This trace contains two hours worth of all HTTP requests to the tangthuvien forum WWW server [17]. The logs were collected from 10:00:00 on Wednesday, January 14, 2009 through 12:00:00 on Wednesday, January 14, 2009. In our simulation, we use the image service class (gif, jpg, jpeg, xbm and bmp) with aggregate request processing capacity C = 150 req./sec with total number of clients N = 15000. To study the performance of our new scheme under the DDoS attack, we conducted the simulation by mixing the trace of normal traffics with the flooding traffic with aggregate attack rates 150 req./sec, 200 req./sec and 300 req./sec with different number of attackers. The simulation time of each run is 1000 sec and the attack started at 250 sec and ended at 750 sec. In our proposed scheme, we set the number of buckets T = 1000, thus randomized non-adaptive group testing matrix is 1000 × 15000. The parameters we considered for the change point detection are α = 0.5, h = 1, β = 0.98 and the detection interval time is n = 20 sec as described in details in Section 5. 5.2
Detection Efficiency
We first examined the detection efficiency of both our scheme and the live baiting detection scheme. In our simulation here, the attack rate is 200 req./sec, the number of attackers x = 50 and the estimate number of attacker is d = 50 as well. We summarize the dynamics of incoming request packets distribution in normal and attack traffic in Fig.4. We can easily see from Fig.4 that the number of incoming request packets significantly increase under the DDoS flooding attack during the attack time (i.e.
NASHAT et al.: GROUP TESTING BASED DETECTION OF WEB SERVICE DDOS ATTACKERS
7
6000 Normal Traffic Attack Traffic
Number of Requests
5000
4000
3000
2000
1000
0 0
200
400
600
800
1000
Time (sec.)
Fig. 4
The dynamics of incoming requests packets
Live Baiting New Scheme
4400
Number of Dropped Requests
4200
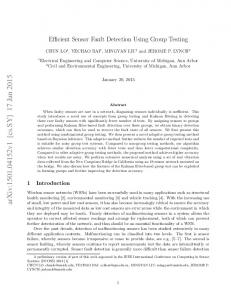
scheme is less than the blocked legitimate clients of the live baiting scheme with the same false negative probability. This figure shows that the dropped packets of both our new scheme and the live baiting scheme are similar in some detection intervals. This is mainly due to that the difference between their dropped packets comes only from the active legitimate clients in their block lists, because the false negative probability of the two schemes in this figure is zero (i.e. the block list of the two schemes contains all the attackers). Since the false positive probability of our scheme is less than the false positive probability of the live baiting scheme, the difference between their dropped packets is mainly determined by the number of active legitimate clients in the block list of the live baiting scheme at each detection time. When most of legitimate clients in the block list of the live baiting scheme are active (e.g. at time t = 400), this difference becomes big. In contrast, when most of legitimate clients in the block list of the live baiting scheme are inactive (e.g. at time t = 660), the difference becomes small. 5.3
False Positive Probability
4000
3800
3600
3400
3200
3000 360
420
480
540
600
660
720
Time (sec.)
Fig. 5 The dropped incoming requests packets after deploying the Live Baiting and the New schemes
from t=250 sec to t=750 sec). Fig.5 shows the number of dropped packets of incoming request packets after deploying the live baiting detection scheme and the new detection scheme when both of them guarantee zero false negative probability. This figure shows clearly that the live baiting detection scheme dropped more request packets than the proposed scheme even both of them detected all the attackers. For example, at time t = 400 sec, the live baiting scheme dropped more than 4100 request packets while the new proposed scheme dropped about 3850 request packets. We can also see from Fig.5 that the dropped request packets of the live baiting scheme at time t = 560 sec is more than 4300 request packets, while the the dropped request packets of the new scheme is about 4000 request packets. This is because the number of blocked legitimate clients of the proposed
To study the performance of the two schemes, we also conducted the simulation on their false positive probability (F P ) when both of them guarantee zero false negative probability. The simulation was conducted with different number of attackers and different attack rates 150 req./sec, 200 req/sec and 300 req/sec. To further clearly show the contribution of the two enhancements of our proposed scheme (i.e. client activity and adaptive threshold), we also conducted the simulation with the consideration of only client activity and with the consideration of both client activity and adaptive threshold. The corresponding results are shown in Fig.6, Fig.7 and Fig.8, respectively. Fig.6 shows the comparison of the false positive probability for attack rate 150 req./sec. Fig.6 indicates that the new scheme with the consideration of only clients activity already achieves lower false positive probability than the previous live baiting scheme, but this false positive probability can be further significantly reduced after applying also the adaptive threshold, especially for large scale service with high number of clients. For example, the new scheme with the consideration of only clients activity succeeds to detect 10 attackers with 0.011 false positive probability, and this probability is further reduced to 0.003 after applying the adaptive threshold, while the false positive probability of live baiting is about 0.012. We can also easily see that when the number of attacker is 50, our new scheme can guarantee the same false positive probability (i.e 0.003), while the live baiting results in an 0.014 false positive probability. We also compared the false positive probability of
IEICE TRANS. ??, VOL.Exx–??, NO.xx XXXX 200x
8
0.014
Live Baiting New Scheme (Client Activity) New Scheme (Client Activity & Adaptive Threshold)
0.020
Live Baiting New Scheme (Client Activity) New Scheme (Client Activity & Adaptive Threshold)
False Positive Probability
False Psitive Probability
0.012 0.010 0.008 0.006 0.004
0.015
0.010
0.005
0.002 0.000
0.000
20
10
30
50
Fig. 8
Attack rate 150 req/sec
0.016
100
Attack rate 300 req/sec
Live Baiting New Scheme
0.020
0.012
False Positive Probability
60
Live Baiting New Scheme (Client Activity) New Scheme (Client Activity & Adaptive Threshold)
False Psitive Probability
0.014
50
Number of Attackers
Number of Attackers
Fig. 6
30
0.010 0.008 0.006
0.015
0.010
0.005
0.004 0.002 0.000 1000
0.000 10
20
40
50
100
1500
2000
Number of Buckets
Number of Attackers
Fig. 9 Fig. 7
the two detection schemes under attack rate 200 req/sec in Fig.7. We can easily see from the figure that our scheme with clients activity can detect all 20 attackers with 0.011 false positive probability, while it achieves 0.003 false positive probability when further using the adaptive threshold. On the other hand, the live baiting scheme can achieve about 0.0119 false positive probability to detect the 20 attackers. Fig.8 further confirms the similar results of Fig.6 and Fig.7 under attack rate 300 req./sec with different number of attackers. 5.4
Effect of buckets number
Attack rate 200 req/sec
Number of Buckets
Finally, we study how the number of buckets (T ) affects the false positive probability of the two schemes. We conducted simulations of both our scheme and the live
baiting detection scheme with different number of buckets under attack rate 300 req/sec and 100 attackers. The comparison in Fig.9 demonstrates that to achieve the same false positive probability, our scheme needs smaller number of buckets (T ) than the live baiting scheme. For example, the new scheme with 1000 buckets achieves a false positive probability less than 0.004, while the corresponding false positive probability of live baiting is about 0.02. We can also easily see from the figure that when the number of buckets is 2000, our new scheme can guarantee about 0.0014 false positive probability, while the live baiting scheme achieves 0.0047 false positive probability. Thus, the live baiting scheme doubles the number of buckets (i.e. from T = 1000 to T = 2000) to achieve the same false positive probability of the proposed scheme (i.e. F P = 0.004). Therefore, our scheme can significantly reduce the number of buckets (T ) re-
NASHAT et al.: GROUP TESTING BASED DETECTION OF WEB SERVICE DDOS ATTACKERS
9
quired to achieve the same false positive probability. 6.
Conclusion
We proposed a new detection scheme for web service DDoS attackers which can increase the detection efficiency and significantly decrease the false positive probability in comparison with the available detection scheme. Rather than putting all clients in the suspect list during the detection interval time, we first classify the clients into active and non active clients and then use an adaptive threshold based on the change point detection to make the final detection decision in each bucket, such that we detect all the attackers of the web service with low false positive and almost zero false negative. Simulation results demonstrate that by adopting the new detection algorithm, we can greatly improve the detection efficiency. As the first step, in this work we investigated the effectiveness of the proposed scheme based on only one large-scale real web trace. In the future, it is quite interesting to test the proposed scheme under other largescale web traces to have a full understanding on its performance. References [1] CERT Coordinate Center, “Denial of Service Attacks,” http://www.cert.org/tech tips/denial of service.html. [2] L.D. Stein and J. N. Stewart, The World Wide Web Security FAQ, version 3.1.2, February 2002 http://www.w3.org/Security/Faq/. [3] R. Jaamour, “Securing Web Services,” Information Security Today October 2005 http://www.infosectoday.com/. [4] H.Q.Ngo and D.Z.DuA, “survey on combinatorial group testing algorithms with applications to DNA library screening,” Discrete mathematical problems with medical applications (New Brunswick, NJ) DIMACS Ser. Discrete Math. Theoret. Comput. Sci., Amer. Math. Soc. vol. 55, pp. 171182, 2000. [5] S. Khattab, S. Gobriel, R. Melhem and D. Mosse, “Live Baiting for Service-Level DoS Attackers,” in Proc. Conf. IEEE INFOCOM, April 2008. [6] C.N.Chuah, L.Subramanian and R.H.Katz,“Dcap: detecting misbehaving flows via collaborative aggregate policing,” SIGCOMM Computer Communication Review vol.33, no. 5, 2003. [7] Y. Li, L. Guo, B. Fang,Z. Tian1 and Y. Zhang, “Detecting DDoS Attacks Against Web Server via Lightweight TCMKNN Algorithm,”in Proc. ACM SIGCOMM, 2008. [8] Y. Xie and S. Yu,“Monitoring the Application-Layer DDoS Attacks for Popular Websites,” IEEE Trans. on Networking, vol. 17, no. 1, 2009. [9] L. V. Ahn, M. Blum and J.Langford, “Telling humans and computers apart automatically,” Communication of the ACM, vol. 46, no. 2, pp. 5660, 2004. [10] S. Ranjan, R. Swaminathan, M. Uysal and E. Knightly, “DDoS resilient scheduling to counter application layer attacks under imperfect detection,”in Proc. Conf. IEEE INFOCOM, April 2006. [11] N. Weiler,“Honeypots for distributed denial-of-service attacks,” in Proc. Conf. WET ICE 2002.
[12] R. Dorfman, “The detection of defective members of large populations,” The Annals of Mathematical Statistics, vol. 14, no. 4, pp. 436440, 1943. [13] M.T. Goodrich, M.J. Atallah, and R.Tamassia, “ Indexing information for data forensics,” in Proc. the Third International Conference on Applied Cryptography and Network Security (ACNS) 2005. [14] M. Basseville and I. V. Nikiforov, “Detection of Abrupt Changes: Theory and Application,” Prentice Hall, 1993. [15] V. A. Siris and F. Papagalou, “Application of anomaly detection algorithms for detecting SYN flooding attacks,” Computer Communications, vol. 29, pp. 1433-1442, 2006. [16] B. E. Brodsky and B. S. Darkhovsky, “Non-Parametric Methods in Change-point Problems,” Kluwer Academic Publishers, 1993. [17] The tangthuvien forum WWW server. http://tangthuvien. com/forum/