Disclaimer: This is the pre-print version of the accepted paper in IEEE Transaction I&M. Permission should be obtained for using any part/whole of the document from the publisher or the author. Please cite this work as: V. K. Tiwari and Sachin K. Jain, “Hardware implementation of polyphase decomposition based wavelet filters for power system harmonics estimation," IEEE Transaction I&M, vol. 65, no. 7, 2016, pp. 1585-1595.
Hardware Implementation of Polyphase Decomposition based Wavelet Filters for Power System Harmonics Estimation Vinay K. Tiwari, Student Member, IEEE, and Sachin K. Jain, Senior Member, IEEE
Abstract— Computational time and hardware resource are key issues in hardware implementation of any signal processing algorithm. This paper presents design and implementation of a polyphase decomposition based new architecture of wavelet filter for power system harmonics estimation using discrete wavelet packet transform (DWPT). Usually, DWPT provides coefficients as the output, however, the proposed architecture also includes provision for providing rms values directly. The proposed method reduces computational requirements and save memory resources. Xilinx system generator, a higher abstraction level tool, has been used to simulate and implement the proposed scheme on the Xilinx Artix-7 FPGA AC-701 board. Performance of the proposed architecture has been validated and compared through hardware co-simulation with variety of synthetic and experimental signals. Index Terms— Discrete wavelet packet transform (DWPT), Field programming gate array (FPGA), finite impulse response (FIR) filter, power quality, root mean square (RMS), Xilinx system generator (XSG). I.
INTRODUCTION
Rapid growth in high-power semiconductor devices and power electronic converters facilitate more efficient and better utilization of distributed and renewable energy sources in modern power system. However, extensive use of power electronics based nonlinear loads and process control equipment, in residential, commercial and industrial sectors, cause a severe problem of power supply waveform distortion and injection of harmonics and interharmonics into the system [1], [2]. Due to significant rise in nonlinear loads, stringent regulations [3], sensitive devices and increased consumer awareness, power system research community has shown considerable interest in power quality (PQ) monitoring and control [2], [4]-[6]. In one of the reports on modern grid initiative, PQ has been identified as one of the seven principal characteristics in a systems view of the modern grid [7]. Amongst many PQ issues, waveform distortion is considered as more severe because it leads to many other operational problems, such as, increased losses, malfunctioning of protection and control circuits, interference with communication line, etc. Therefore, as a requirement of smart electricity transmission and distribution system, accurate estimation, monitoring and control of waveform distortion is very important. The IEC standard 61000-4-7 [8] recommends the fast Fourier transform (FFT) as a basic signal processing tool for the estimation of magnitudes of fundamental and harmonic components. However, FFT has its own limits and restriction, and produce inaccurate results in case of non-stationery signal, especially, fundamental frequency variation [9]. Also, computing groups and subgroups need additional computation. Many signal processing tools have been proposed for harmonic estimation of non-stationary signal, such as, windowed and interpolated discrete Fourier transform (DFT) [10]-[13], Wavelet transforms [14][20], Hilbert-Huang transform (HHT) [20], [21], Kalman filter (KF) [22], Prony/MUSIC [23], Sliding-window ESPRIT [24][26], neural networks [27]-[30] etc. Each of these has their own pros and cons [31] and is suitable for different applications. The HHT is preferred for nonlinear and non-stationary data because it uses adaptive basis functions for decomposition, however, additional tools are required for exact interpretation of the results and its accuracy is dependent on the exact spline fitting, which is difficult. KF can be applied for continuous tracking of time-varying harmonics but exact modeling is required for accurate results. One of the drawbacks of KF is the problem of ‘filter dropping off’, which makes it insensitive against sudden changes of state variables if the estimation parameters are not changing for a long time. The parametric techniques, such as, Prony, MUSIC, ESPRIT, provides high resolution estimates with relatively short data sample size. Further, these techniques do not require synchronized sampling and specific number of data samples, however, there high computational time and sensitivity to noise and modelling errors restricts their application for online cases. Easy implementation using filters banks provide an edge to the wavelet transform (WT) over others for many online practical applications. As a result, WT has been successfully applied in number of applications for the analysis of a signal in time-frequency domain. Because of digital implementation, discrete wavelet transform (DWT), and hence, discrete WPT is more This work was supported in part by the Science and Engineering Research Board, Department of Science and Technology, India, under Grant SB/FTP/ETA120/2013. V. K. Tiwari and S. K. Jain are with the PDPM Indian Institute of Information Technology, Design & Manufacturing, Jabalpur, MP, India (e-mail:
[email protected],
[email protected]).
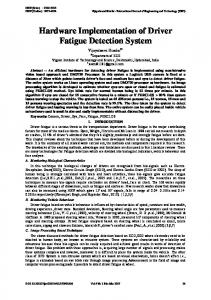
popular in analysis of power system harmonics [14]-[16]. Although, the reported WPT based methods claimed satisfactory performance, their hardware implementation confronts with many issues, such as, very high computational complexity, response time and high hardware resources requirement. There have been works [32]-[33] on hardware implementation of wavelet transform, which are focused on audio signal and image processing applications. Garcia et al. [34] have proposed a flexible architecture for WPT implementation, however, it is not optimized for power system harmonics estimation because it’s a generalized approach in modular form that is suitable for medical imaging applications. Further, this work does not discuss anything about quantization of coefficient. It is obvious fact that high precision floating point filter coefficients provide more accurate results, even for quantized input signal, as compared to fixed-point quantized coefficient; however, the hardware requirements rise enormously [33]. A cost effective instrument implementation has been proposed by Betta et al. [35] that is based on digital filter bank approach [36]. It adopts second order Butterworth digital filter. The major concern in this work is inherent drawbacks of Butterworth filter, such as, possibility of instability due to quantization error, nonlinear phase response, etc. In contrast, FIR filters have increasing signal resolution, a linear phase and inherent stability, however, the required filter order is higher leading to greater delay. This paper proposes a polyphase and transpose form structure based digital implementation of DWPT using FIR filter bank architecture for power system harmonics estimation. The symmetry of the FIR filter has been exploited to implement an optimal form of the filter bank using resource sharing with polyphase decomposition. Downsampling before the filtering operation reduces the computations and makes the response faster. The proposed scheme has been successfully implemented on Xilinx Artix-7 FPGA AC701 board after proper synthesis in XSG/Simulink domain. The proposed hardware design not only minimizes the computational requirements relative to similar designs but also provides stable operation and linear phase response. The performance of the proposed hardware implementation has been validated using various synthetic and experimental test signals in hardware co-simulation environment. II. FPGA-BASED HARMONIC ESTIMATION APPROACH A. Review of Discrete Wavelet Packet Transform (DWPT) The DWPT, a more general form of the discrete wavelet transform, is the preferred technique for harmonic estimation as it provides uniform frequency bands and can be easily implemented using multistage filter bank. With adequate sampling frequency and wavelet decomposition tree, output frequency band from a DWPT can be aligned to the specific harmonic components for measuring their magnitudes [15]. Fig. 1 depicts a three level decomposition tree that provides eight frequency bands.
g ( n) g ( n)
2
2
D23 (k )
D11 (k ) h(n)
2
D22 (k )
D00 (k) g ( n) h(n)
2
D21 (k )
D10 (k) h(n)
Level 0
2
Level 1
2
D20 (k )
g ( n)
2
D37 (k )
h(n)
2
D36 (k )
g ( n)
2
D35 (k )
h(n)
2
D34 (k )
g ( n)
2
D33 (k )
h(n)
2
D32 (k )
g ( n)
2
D31 (k )
h(n)
2
D30 (k )
Level 2
Level 3
Fig.1. Three level DWPT decomposition tree.
The filter bank consists of wavelet functions as the low-pass filter h(n) and its dual high-pass filter g(n). The decomposition is performed on both the approximation coefficient and detail coefficient of the input signal at any level. The wavelet coefficients of input signal at the lth level, kth point and 2ith node can be represented as: Dl2i (k ) h(n) Dli1 (2k n)
(1)
Dl2i 1 (k ) g(n) Dli1 (2k n)
(2)
n
n
where, i = 0, 1. . . (2(l-1) -1), h(n)and g(n) are low-pass and high-pass filters, respectively. The wavelet coefficient at any level is retrieved from the convolution of input signal sequence at previous level with low-pass/high-pass filter and then down sampling by a factor of two. The accuracy of harmonic measurement depends upon the choice of mother wavelet. Since the choice of mother wavelet depends upon the required application and its properties, Vaidyanathan with 24 coefficients [37], db20 with 40 coefficients [15] and db10 with 20 coefficients [16], have been proposed as the most suitable mother wavelet for power system harmonic analysis, however authors have not included the quantization effect of filter coefficients for wavelet filter in their analysis which is an important parameter during hardware implementation. In general, large number of filter coefficients provide more accurate harmonic measurement due to low spectral leakage, but it requires considerable amount of resources and more computation that reduce the speed of computational process. The main objective of this paper is to study quantization effect, reduce computational complexity and required resources for its efficient implementation on hardware. B. Polyphase implementation of wavelet filters Convolution between input sample and coefficient of filter can be implemented through polyphase structure or nonpolyphase structure as shown in Fig. 2 [33]. Equations (1) and (2) are wavelet coefficients of input signal using non-polyphase structure. In non-polyphase structure computations between input samples and filter coefficients are done before down sampling as shown in Fig. 2(a), while in polyphase, computations between input samples and filter coefficients are done after down sampling as shown in Fig. 2(c), as a result, the computations are reduced by a factor of two in polyphase structure. Transfer function of a filter can be expressed as, H(z) = h0 + h1z -1 + h2z -2 + …+ h(N-2)z -(N-2) + h(N-1)z -(N-1)
(3)
Above mathematical equations can be rearranged as a sum of two terms, first term from the even indexed coefficients and second term from the odd indexed coefficients. Then, it can be expressed as H(z) = h0 + h2z -2 + h4z -4 +..........+ h(N-3)z -(N-3) + h(N-1)z -(N-1) + z -1(h1 + h3z -2 + …....+ h(N-4)z -(N-5) + h(N-2)z –(N-3))
(4)
Combining odd and even terms separately, (4) can be expressed as sum of two phase components H0(z) and H1(z) as H(z) = H0(z2) + z -1 H1(z2)
(5)
where, H0(z) = h0 + h2z -1 + …+ h(N-3)z -(N-3)/2 + h(N-1)z -(N-1)/2
(6)
H1(z) = h1 + h3z -1 +…+ h(N-4)z -(N-5)/2 + h(N-2)z –(N-3)/2
(7)
Using noble identity as shown in Fig. 2(b), efficient polyphase implementation of FIR filter is possible as shown in Fig. 2(c). H ( z)
2
H0 (z2 )
2
H1 ( z 2 )
2
Z 1 (a)
H (zM )
M
M
H ( z)
(b)
H 0 ( z)
2
z 1
H1 ( z )
2
(c)
Fig.2. (a) Non-polyphase implementation of transfer function H(z) (b) Noble identity (c) Polyphase implementation of transfer function H(z)
C. Cost effective implementation of polyphase structure It is known that infinite impulse response (IIR) filter requires lesser hardware resources because of low filter order. However, for ensuring stable operation even with quantization and linear phase response, finite impulse response (FIR) filters are better choice. Therefore, FIR filters are chosen for DWPT implementation in this work, and suitable techniques, such as, polyphase and transposed form structure have been used to make hardware implementation competitive with that of the IIRs. Usually, number of computations and memory requirements determine the cost of implementation of any algorithm. In order to save memory on FPGA, polyphase structure is used that makes it possible to reduce the delay elements in FIR filter and number of computations are also reduced to half. Similarly, transposed form structure is better option than direct form structure
[38] for FIR filter implementation for high speed hardware such as FPGAs or ASICs. Fig. 3 shows the polyphase implementation of FIR filter in transposed form as used in this work. 2
hN 1
h4
Z 1
h2
Z 1
h0
Z 1
Z 1
h3
h1
2
hN
h5
Z 1
Z 1
O/P
Z 1
Fig.3. Polyphase implementation of FIR filter H(z) in transposed form
Two polyphase components of transfer function H(z) can be implemented in transposed form structure as depicted in Fig. 3. Samples from the two delay strings are combined together for getting output. Therefore, separate delay string can be mixed together into a single one. In this way, polyphase structure save considerable resources on implementation, as presented in Fig. 4. Computational complexity is defined as number of multiplications and additions per input sample, if there are N coefficients in filter, then N multiplications and N-1 additions per input sample are required for a single filter. For comparison purpose, the number of multiplications and additions required for total ten cycles’ data at sampling rate of 32 samples per cycle for the DFT and a three level DWPT with two different mother wavelets, namely, db20 and db30, are listed in Table I. It can be noticed that computational complexity is reduced by half with the proposed implementation. Number of computations are considerably small for the Radix-2 FFT, however, its accuracy is low because of spectral leakage due to non-integer number of cycles and/or zero padding for meeting the requirement of power-of-two N (i.e. N=2). The figures within brackets represent the required number of additions. TABLE I COMPARISON OF COMPUTATIONAL COMPLEXITY Number of multiplications (additions) DWT Wavelet For [15] For the proposed filter work db20 76800 (74880) 38400 (37440) db30 115200 (113280) 57600 (56640) DFT (320 points) Radix-2 FFT 4608 (9216) Direct DFT 102400 (102080)
2
hN 1
Z 1
h4
h2
h0
2
hN
h5
Z 1
h3
h1
Z 1
Z 1
O/P
Fig. 4. The proposed polyphase structure in transposed form.
III. FPGA BASED DESIGN FOR HARMONIC ESTIMATION This section explains model based design approach to rapidly implement harmonic estimation algorithm with the proposed hardware structure on FPGA platform. This section also describes the steps used for modelling, simulating, implementing and
verifying the proposed scheme in real time using the Xilinx Artix-7 FPGA AC-701 Board, connected to a PC with MATLAB/Simulink, Xilinx System Generator, via JTAG interface. Fig. 5 shows design and implementation flow using XSG. Digital design for the DWPT based harmonic estimation on the XSG for its implementation on FPGA is shown in Fig. 6. It enables hardware co-simulation through the “Gateway In” and “Gateway out” blocks that Simulink data types (integer, double, single and fixed) in to system generator data types (fixed point or floating point) and vice versa. These define top-level input and output ports, respectively, and acts as virtual analog-to-digital and digital-to-analog converters during hardware co-simulation. Registering the input and output data has been used that allows the register to be packed into input-output buffer (IOB) [39]. Wavelet filter:- Daubechies filter coefficients are used for implementation of wavelet FIR filters. Wavelet filters are implemented on FPGA using transposed, polyphase form architecture. Fig. 7 shows digital design of 6 tap FIR filter in transposed form and the proposed digital design with polyphase structure is shown in Fig. 8. Filter coefficients are quantized using 2’s complement signed 18-bit fixed point format having 12 fractional bits with adequate quantization and overflow option in order to save resource utilization on FPGA. Pipelining process is also used in both architecture for higher performance FPGA design therefore all the timing constraints are meet for Xilinx Artix-7 FPGA AC-701 board for clock frequency of 50 MHz. The “Cast” blocks are necessary to transform output signal from wavelet filter to an 18-bit fixed point format (the same that the input of “Gateway in” block).
PC Develop algorithm Simulate design using Xilinx blocks in XSG/ Simulink platform Automatic code generation of HDL in Vivado Design suite Xilinx Artix-7 FPGA AC-701
RTL schematics and verification Generation of bit stream file
JTAG
Fig. 5. Design and implementation flow.
Fig. 6. Digital design of three level DWPT decomposition tree on XSG.
Fig. 7. Digital design 6 tap FIR filter in traditional transposed form on XSG.
Fig. 8. Proposed digital design 6 tap FIR filter in polyphase transposed form on XSG for improved performance.
RMS calculation: The rms magnitude of fundamental and each odd harmonics can be calculated by taking square root of the mean square of wavelet coefficients obtained from the wavelet filter. Digital architecture for rms calculation is developed as proposed in [40] and its digital design shown in Fig. 9. Convert block is used for converting 18 bit fixed point format into single precision floating point format, because divide and square root block available from Xilinx support only for single precision floating format and double precision floating point format.
Fig. 9. Digital design of RMS block based on DWPT.
The architecture has been synthesized and implemented on FPGA by XSG/Vivado design suite 2015.1 using db20 and db30 wavelet filters, Table II shows resource utilization summary for above architecture with 18-bit fixed point format. It can be observed that the proposed polyphase transpose form require less resources (FF, LUT, Memory LUT) in comparison to traditional transpose form in both cases, viz. db20 and db30. TABLE II RESOURCE UTILIZATION SUMMARY AFTER IMPLEMENTATION FOR XILINX ARTIX-7 FPGA AC-701 BOARD Utilization Resource type FF LUT Memory LUT I/O BRAM BUFG MMCM
(db20) Traditional transpose form 57009 (21.3 %) 43624 (32.6 %) 180 (0.39 %) 2 (0.50 %) 2 (0.55 %) 4 (12.5 %) 1 (10 %)
Proposed polyphase transpose form 38655 (14.45 %) 35208 (26.31 %) 178 (0.39 %) 2 (0.50 %) 2 (0.55 %) 4 (12.5 %) 1 (10 %)
(db30) Traditional transpose form Proposed polyphase transpose form 91309 (34.12 %) 57219 (21.38 %) 67667 (50.57 %) 49165 (36.75 %) 183 (0.40 %) 182 (.39 %) 2 (0.50 %) 2 (0.50 %) 2 (0.55 %) 2 (0.55 %) 4 (12.5 %) 4 (12.5 %) 1 (10 %) 1 (10 %)
Available
267600 133800 46200 400 365 32 10
IV. PERFORMANCE EVALUATION In this section, simulation and experimental results have been presented to investigate performance of the digital hardware based on the proposed method for power system harmonic estimation. Synthetic and measured test signals have been used with cost effective hardware co-simulation approach on the experimental setup consisting of MATLAB/Simulink software platform (running on a desktop personal computer with 2.4GHz Intel core i5 processor, with 4GB random access memory), and Xilinx Artix-7 FPGA AC-701 board as hardware platform, both interconnected via JTAG. Synthetic signals are generated in MATLAB/Simulink platform and sampled at 1.6 kHz rate with window width of 200 ms (ten cycles of the fundamental frequency) in accordance with the IEC standard 61000-4-7 [8]. The signal that is generated in the MATLAB/Simulink is in double precision floating point format and it is quantized by “Gateway In” block in 18 bit fixed point format to feed it to the implemented algorithm on the Xilinx Artix-7 FPGA AC-701 hardware board, in real time, with the help of co-simulation process. A. Test 1: Stationary Signal First test examines the performance of the implemented digital hardware on stationary signal at nominal and off-nominal fundamental frequencies. The synthesized signal was composed of odd integer harmonics along with the fundamental component, as shown in Fig. 10, and is generated using (8) at three different fundamental frequency values of 49.5, 50, and 50.5 Hz. In (8), ω=2πf, where f is the fundamental frequency. V(t) =
2 [sin(ωt) + 0.2 sin(3ωt) + 0.2 sin(5ωt) + 0.1 sin (7ωt) +0.1 sin (11ωt) +0.1 sin (13ωt)]
(8)
Table III reports the results obtained from the proposed method for db20 and db30 as a wavelet filter coefficients at three different fundamental frequency values. Table IV provides the performance comparison of the proposed method with that of DFT and IEC harmonic group (HG) method in terms of estimation error. It can be observed that, absolute estimation error is negligible for the DFT and IEC HG method for idealistic case of nominal fundamental frequency, whereas, the error increases significantly for off-nominal fundamental frequency cases. Although, these non-coherency errors can be reduced using interpolated DFT, the proposed method performance is better at off-nominal fundamental frequency cases. Response time of the proposed method is presented in Table V, which indicates suitability of the proposed method for online applications. 1.5
Amplitude(V)
1 0.5 0 -0.5 -1 -1.5
0
0.05
0.1 T ime (seconds)
0.15
0.2
Fig. 10. Test signal-1: Synthetic stationary signal. TABLE III HARMONIC AMPLITUDE ESTIMATION RESULTS USING DB20 AND DB30 ON FPGA FOR STATIONARY SIGNAL Frequency band (Hz) 0-100 100-200 200-300 300-400 400-500 500-600 600-700 700-800
Harmonic order 1st 3rd 5th 7th 9th 11th 13th 15th
True RMS (V) 1.0000 0.2000 0.2000 0.1000 0.0000 0.1000 0.1000 0.0000
Proposed Polyphase form db20 (V) (49.5Hz) (50Hz) (50.5Hz) 1.00075 1.001109 1.002164 0.203883 0.184515 0.210335 0.195304 0.209739 0.196598 0.095852 0.09324 0.092564 0.033938 0.036387 0.040343 0.098872 0.091862 0.100767 0.099425 0.107863 0.101218 0.017927 0.01858 0.014448
Proposed Polyphase form db30 (V) (49.5Hz) (50Hz) (50.5Hz) 1.000422 1.000287 1.00229 0.20113 0.194638 0.204865 0.195922 0.200691 0.198114 0.097975 0.096136 0.096327 0.025253 0.029622 0.029733 0.098643 0.096101 0.100894 0.100212 0.103237 0.100884 0.01697 0.018943 0.014935
TABLE IV ABSOLUTE ESTIMATION ERROR (%) FOR THE STATIONARY TEST SIGNAL-1 Frequency Harmonic band (Hz) order 0-100 100-200 200-300 300-400 400-500 500-600 600-700 700-800
1st 3rd 5th 7th 9th 11th 13th 15th
Proposed Polyphase form db20 (V)
Proposed Polyphase form db30 (V)
(49.5Hz) 0.075
(50Hz) 0.1109
(50.5Hz) (49.5Hz) 0.2164 0.0422
(50Hz) 0.0287
0.3883 0.4696
1.5485 0.9739
1.0335 0.3402
0.113 0.4078
0.5362 0.0691
0.4865 0.1886
0.4148 3.3938 0.1128 0.0575 1.7927
0.676 3.387 0.8138 0.7863 1.858
0.7436 4.0343 0.0767 0.1218 1.4448
0.2025 2.5253 0.1357 0.0212 1.697
0.3864 2.9622 0.3899 0.3237 1.8943
0.3673 2.9733 0.0894 0.0884 1.4935
DFT
(50.5Hz) (49.5Hz) 0.229 2.754
IEC HG
(50Hz) 1.8e-10
(50.5Hz) 0.939
(49.5Hz) 1.311
(50Hz) 1.8e-10
(50.5Hz) 0.463
3.554 9.869
1.0e-10 4.0e-11
3.883 10.68
0.958 2.010
1.0e-10 4.0e-11
1.220 2.233
8.654 0.580 12.432 10.535 0.726
2.5e-11 5.4e-12 9.0e-11 1.3e-10 1.7e-10
9.758 0.763 12.364 11.212 0.301
0.771 1.004 0.367 0.916 1.258
2.5e-11 1.4e-12 8.3e-11 1.3e-10 3.0e-10
0.422 1.323 0.424 1.423 0.522
TABLE V CLOCK CYCLES REQUIRED FOR ESTIMATION OF POWER SYSTEM HARMONICS FOR TEST SIGNAL-1
Harmonic order 1st 3rd 5th 7th 11th 13th
Clock cycles 643 515 443 563 419 650
FPGA (s) 12.86 10.30 8.86 11.26 8.38 13.0
B. Test 2: Nonstationary Signal (Amplitude Step Change) Second test signal, with an amplitude step change, is taken from the IEC Standard [8] (C.3, example-1) to illustrate the robustness of the proposed digital hardware for fluctuating harmonic amplitude. In this example, the signal contains only fifth harmonic that is changed from 3.536A (rms) to 0.7071A (rms) at 21.25 periods of fifth harmonic, as shown in Fig.11. Average of rms values of the test signals is computed over ten cycle of fundamental frequency, which comes out to be 2.355A (at 1.6 kHz sampling frequency), and it is used for comparison of the results obtained from the proposed architecture.
5th harmonic amplitude(A)
6 4 2 0 -2 -4 -6
0
0.05
0.1 T ime (seconds)
0.15
0.2
Fig. 11. Test-signal-2: Synthetic fifth-harmonic current signal with large step change.
TABLE VI AMPLITUDE ESTIMATION RESULTS FOR TEST SIGNAL-2 WITH ZERO MEAN WHITE GAUSSIAN NOISE Output bands (Hz) 0-100 100-200 200-300 300-400 400-500 500-600 600-700 700-800
Proposed Polyphase form db20 (A) rms with SNR 40 dB Mean SD 0.117292 5.97E-07 0.280804 8.04E-07 2.327735 1.68E-06 0.197501 1.43E-06 0.085733 1.39E-06 0.080251 1.12E-06 0.045236 1.13E-06 0.049069 1.26E-06
Proposed Polyphase form db30 (A) rms with SNR 40 dB Mean SD 0.104968 1.85E-06 0.197095 2.31E-06 2.335735 1.2E-06 0.178756 1.46E-06 0.110171 1.64E-06 0.058976 1.58E-06 0.054812 1.59E-06 0.04808 1.44E-06
Proposed Polyphase form db20 (A) rms with SNR 60 dB Mean SD 0.11691 1.19E-08 0.280617 1.16E-08 2.327336 3.79E-08 0.196901 2.76E-08 0.085384 2.69E-08 0.079823 4.25E-08 0.044866 2.17E-08 0.048791 1.54E-08
Proposed Polyphase form db30 (A) rms with SNR 60 dB Mean SD 0.104882 2.41E-08 0.197153 3.28E-08 2.336099 2.27E-08 0.178798 2.27E-08 0.109831 2.06E-08 0.058075 4.5E-08 0.054032 2.44E-08 0.047361 2.83E-08
TABLE VII ERRORS (%) IN AMPLITUDE ESTIMATION OF FIFTH HARMONIC OF TEST SIGNAL-2
Proposed Method
IEC Standard DFT
db20 SNR 40.45 dB db30 db20 SNR 57.4 dB db30 Harmonic group (without any noise) Harmonic subgroup (without any noise) (as reported in IEC 61000-4-7)
Error 1.16 .81 1.17 .80 1.47 3.84 19.3
To validate the robustness of the proposed method against noise, a zero mean white Gaussian noise with signal to noise ratio (SNR) of 60 dB and 40 dB is added into the signal and test is repeated for 25 times. Table VI reports the resulting mean values and standard deviation (SD) of the estimated rms amplitudes for this test signal using the proposed polyphase decomposition based method on Xilinx Artix-7 FPGA AC-701 board with db20 and db30 wavelet filter coefficients. The respective estimation errors for the proposed method, DFT and IEC based harmonic group & harmonic subgroup algorithms are presented in Table VII. It can be noticed that due to spectrum leakage, DFT performs poorly, which is taken care to some extent by the IEC grouping methods, but the results of the proposed method are much better. C. Test 3: Measured Voltage Signal In this test case, a measured voltage signal of a distribution system of an academic institution has been considered. The voltage has been measured at a low voltage (LV) feeder of the power & control lab and the measurement point (MP) is marked in the single line diagram of the distribution system, shown in Fig. 12. The signals have been acquired at the designated measurement point (MP) using the Agilent made differential voltage probe (N2791A) and data acquisition system (U2353A) at the sampling rate of 6.4 kHz, which is down-sampled by a factor of four to suit the proposed method. Fig. 13 shows few cycles of the measured voltage signal, which is attenuated during acquisition by a factor of 180. The acquired voltage signal of approximately 1s duration is analyzed using the proposed method with window width of 200ms and the obtained mean and standard deviation (SD) values of estimates of the harmonic components are presented in Table VIII. The measured signal at original sampling rate (6.4kHz) has been analyzed with the high resolution parametric method [25] whose results were assumed as the true values for computing the errors, which are also provided in the Table VIII. It is worth mentioning here that accuracy of the true values have been confirmed using very low values of the reconstruction error with these values. The low values of absolute error and SD confirms accuracy and reliability of the proposed method.
33kV Bus DG 1MVA, 11kV
33/11kV, 4MVA
Mea sureme nt Point (MP) Circuit Br eaker
11kV Bus
11/0.433kV, 1250kVA
Library
Academic building
Core labs
Computer centre
11/0.433kV, 1250kVA
350kVAr Capacitor bank
11/0.433kV, 1000kVA
Misc. services
350kVAr Capacitor bank
Residential and Hostels
Power & Control Lab
5 kVA UPS
Attenuated Voltage (V)
Fig. 12 Single line diagram of the distribution system for voltage signal acquisition.
1 0 -1
0
0.02
0.04
0.06
0.08 0.1 0.12 T ime (seconds)
0.14
0.16
0.18
0.2
Fig. 13 Test-signal-3: Acquired voltage signal. TABLE VIII AMPLITUDE ESTIMATION RESULTS FOR TEST SIGNAL-3 Harmonic Component 1st 3rd 5th 7th 9th 11th 13th 15th
True value 1.3232 0.1907 0.1363 0.0521 0.001 0.0353 0.001 0.001
Proposed Polyphase form db20 (A) rms Mean SD Error (%) 1.3244158 3.45e-06 0.12158 0.1992946 1.28e-05 0.85946 0.20978 0.1342022 7.15e-06 0.0609209 5.47e-06 0.88209 0.0169552 1.57e-07 1.59552 0.0433732 1.16e-06 0.80732 0.0171847 3.08e-07 1.61847 0.019492 1.13e-06 1.8492
Proposed Polyphase form db30 (A) rms Mean SD Error (%) 1.3237418 3.69e-06 0.05418 0.1966337 2.47e-06 0.59337 0.01927 0.1361073 4.94e-06 0.0537878 1.10e-06 0.16878 0.0269523 3.09e-06 2.59523 0.0404838 7.33e-07 0.51838 0.0215107 4.36e-07 1.05107 0.0139242 8.81e-07 1.29242
D. Measured real time current signal A real time measured current signal from [29], shown in Fig. 14, is considered as the fourth test signal for validation of the proposed digital hardware with actual experimental signal at off-nominal fundamental frequency. As reported in [29] and confirmed through simulation results, the measured current signal was composed of four dominant harmonics, namely, fundamental, 3rd, 5th and 11th harmonics. In this signal, fundamental frequency is also not at nominal value of 50Hz and deviates between 49.94 to 50.12 Hz. The proposed method has been applied on the real current signal of total 5s duration with the window width of 200ms and the results are presented in Table IX. It can be observed that estimates harmonic amplitudes are accurate and consistent.
TABLE IX AMPLITUDE ESTIMATION RESULTS FOR THE TEST SIGNAL-4 Harmonic Component
True value
1st 3rd 5th 7th 9th 11th 13th 15th
0.3102 0.0637 0.0619 0.0122 6.6e-4 0.0011 5.4e-4 0.0016
Proposed Polyphase form db20 (A) rms Mean SD Error 0.309361 3.67e-05 0.0839 0.070168 2.76e-05 0.6468 0.056694 3.54e-05 0.5206 0.019034 3e-05 0.6834 0.008705 5.39e-05 0.8045 0.03048 3.06e-05 2.938 0.01733 4.42e-05 1.679 0.022951 1.7e-05 2.1351
Proposed Polyphase form db30 (A) rms Mean SD Error 0.309621 3.66e-05 0.0579 0.068465 2.17e-05 0.4765 0.06114 2.37e-05 0.076 0.01527 1.33e-05 0.307 0.016 4.51e-05 1.534 0.02979 3e-05 2.869 0.01615 4.85e-05 1.561 0.022731 1.74e-05 2.1131
0.6 0.4
Amplitude
0.2 0 -0.2 -0.4 -0.6 -0.8
0
50
100
150 Samples
200
250
300
Fig. 14 Test-signal-4: Measured current signal.
E. Effect of Gaussian Noise on Estimation Real-time measurements invariably introduce noise that can be significant or reasonable depending up on the quality of the measuring instruments. Therefore, it is important to evaluate uncertainty of estimations due to noise. For this purpose, a white Gaussian noise (WGN) with zero mean and variance σ2 is added in the signal model; and computer simulations have been performed to compute the mean squared error (MSE) in amplitude estimation for 200 independent trials at each noise levels. Fig. 15 depicts the MSE in the 5th harmonic amplitude estimation of Test signal-2 from the proposed algorithm using db20 and db30 wavelet filters and compares it with the Cramér–Rao lower bounds (CRLB). It can be observed that beyond signal-to-noise ratio (SNR) of 20dB, the MSE is close to the respective CRLBs with both wavelet filters, which confirms estimation accuracy in the presence of noise.
10
With db20
With db30
-4
MSE
10
CRLB
-2
10
10
-6
-8
0
10
20
30
40
50
60
SNR (dB)
Fig. 15 Mean squared error (MSE) plot for 5th harmonic amplitude estimation.
70
F. Effect of quantization Quantization is the necessity of digital systems, which reduces accuracy of computations as compared to infinite precision data. With higher resolution, the accuracy will be relatively better, however, it requires significant hardware resources. Therefore, choosing correct resolution is vital for any digital design. For a given system, this choice is to be made for ADCs that converts analog input signal to digital form, and for filter coefficients that participate in computation. Resolution of filter coefficients plays greater role in estimation accuracy as compared to ADC. The reason for this can be explained by the fact that in case of power system harmonics estimation, quantization of input signal will cause some amount of error (only at the entry point), however, resolution of the filter coefficients will amplify/introduce errors due to truncation of data/accumulation of errors during computations (in multiple points of the processing chain), and hence it affects the accuracy more in processing of low resolution data. A number of tests were carried out with the test signal-4 with 200-ms (320 samples) window length with different scenarios and combination of ADC and db30 wavelet filter coefficients resolution to illustrate the quantization effect due to filters coefficients and ADC resolution. Table X summarizes the results of this analysis, where F_fixed_18_12 signifies 18-bit fixed point format having 12 fractional bits, 5 integer bits and 1 sign bit for filter coefficients and A_fixed_18_12 denotes in same pattern resolution of ADC, and so on for all other cases. It can be observed from Table X that error in estimation of rms amplitude is more affected when resolution of filter coefficients is reduced as compared to change in ADC resolution. TABLE X EFFECT OF QUANTIZATION DUE TO FILTER COEFFICIENTS AND ADC RESOLUTION TAKING DB30 AS FILTER COEFFICIENTS FOR TEST SIGNAL-4 Harmonic order
True value
1st 3rd 5th 7th 9th 11th 13th 15th
0.3102 0.0637 0.0619 0.0122 6.6e-4 0.0011 5.4e-4 0.0016
F_fixed_18_12 A_fixed_18 A_fixed_12 _12 _8 0.3096846 0.3096548 0.0703591 0.0705419 0.061129 0.0610909 0.0150678 0.0151871 0.0160003 0.0159421 0.0297905 0.0299045 0.0161503 0.0161539 0.0221735 0.0227717
F_fixed_14_10 A_fixed_18_ A_fixed_14 12 _10 0.3084544 0.3084514 0.0706104 0.0706038 0.0610318 0.0610104 0.0153515 0.0153581 0.015984 0.015948 0.0296773 0.0297137 0.0161709 0.0161832 0.0261883 0.0262169
F_fixed_12_8 A_fixed_18_ A_fixed_12_ 12 8 0.3084352 0.3062501 0.0713568 0.0723323 0.0610605 0.0609942 0.0167153 0.0168733 0.0157827 0.0158678 0.0302836 0.0304315 0.015985 0.0160727 0.0278294 0.0277792
V. CONCLUSION This paper presents an FIR wavelet filter bank based efficient hardware implementation of DWPT harmonic estimation algorithm based on polyphase decomposition and transpose structure. The proposed design reduces the computational complexity by half, meets the timing requirements for real time implementation and save significant hardware resources on FPGA implementation. The proposed design was implemented on Xilinx Artix AC-701 FPGA board using XSG, and its performance was tested using hardware co-simulation on variety of synthetic and experimental signals of stationary and timevarying nature. The obtained results in terms of accuracy, robustness, hardware resource utilization, and response time confirm utility of the proposed method. The accuracy of the reported results is within the prescribed limit as mentioned in the applicable standards, viz. IEC Std. 61000-4-7 [8]. With the reported performance parameters the proposed method can find its application in monitoring and source identification of critical harmonics [41], selective harmonic compensation schemes [42], harmonics metering [43] and distortion based tariff realization, etc. VI. REFERENCES
[1] V. Wagner, J. Balda, D. Griffith, A. McEachern, T. Barnes, D. Hartmann, D. Phileggi, A. Emannuel, W. Horton, W. Reid, R. Ferraro and W. Jewell, "Effects of harmonics on equipment," IEEE Trans. Power Del., vol. 8, no. 2, pp. 672-680, Apr 1993. [2] M. H. J. Bollen and I. Y.-H. Gu, Signal Processing of Power Quality Disturbances, A John Wiley & Sons, 2006. [3] IEEE Recommended Practice and Requirements for Harmonic Control in Electric Power Systems, 2014, pp. 1-29. [4] IEEE WG on PSH, "Power system harmonics: an overview," IEEE Trans. Power App. Syst., vol. 102, no. 8, pp. 2455-2460, 1983. [5] C. Muscas, "Power quality monitoring in modern electric distribution systems," Instrumentation Measurement Magazine, IEEE, vol. 13, no. 5, pp. 19-27, October 2010. [6] B. Singh, A. Chandra and K. AlHaddad, Power Quality: Problems and Mitigation Techniques, Wiley, 2015. [7] U. D. o. E. National Energy Technology Laboratory, "A systems view of the modern grid: Provides power quality for 21st century needs,"
Jan. 2007. [8] Testing and Measurement Techniques--General Guide on Harmonics and Interharmonics Measurements and Instrumentation, for Power Supply Systems and Equipment Connected Thereto, 2002. [9] M. Kusljevic, "Simultaneous frequency and harmonic magnitude estimation using decoupled modules and multirate sampling," IEEE Trans. Instrum. Meas., vol. 59, no. 4, pp. 954-962, 4 2010. [10] D. Agrez, "Weighted multipoint interpolated DFT to improve amplitude estimation of multifrequency signal," IEEE Trans. Instrum. Meas., vol. 51, no. 2, pp. 287-292, 2002. [11] A. Testa, D. Gallo and R. Langella, "On the Processing of harmonics and interharmonics: using Hanning window in standard framework," IEEE Trans. Power Del., vol. 19, no. 1, pp. 28-34, Jan. 2004. [12] H. Wen, J. Zhang, Z. Meng, S. Guo, F. Li and Y. Yang, "Harmonic Estimation Using Symmetrical Interpolation FFT Based on Triangular Self-Convolution Window," IEEE Trans. Industrial Informatics, vol. 11, no. 1, pp. 16-26, Feb 2015. [13] S. K. Jain, "Algorithm for dealing with time-varying signal within sliding-window for harmonics estimation," IET Science, Measurement & Technology, pp. 1-9, August 2015. [14] L. Eren, M. Unal and M. Devaney, "Harmonic analysis via wavelet packet decomposition using special elliptic half-band filters," IEEE Trans. Instrum. Meas., vol. 56, no. 6, pp. 2289-2293, Dec 2007. [15] J. Barros and R. Diego, "Analysis of harmonics in power systems using the wavelet-packet transform," IEEE Trans. Instrum. Meas., vol. 57, no. 1, pp. 63-69, 1 2008. [16] W. G. Morsi and M. El-Hawary, "Novel power quality indices based on wavelet packet transform for non-stationary sinusoidal and nonsinusoidal disturbances," Electric Power Systems Research , vol. 80, no. 7, pp. 753-759, 2010. [17] D. Taskovski and L. Koleva, "Measurement of harmonics in power systems using near perfect reconstruction filter banks," IEEE Trans. Power Del., vol. 27, no. 2, pp. 1025-1026, April 2012. [18] C. A. Duque, P. M. Silveira and P. F. Ribeiro, "Visualizing time-varying harmonics using filter banks," Electric Power Systems Research , vol. 81, no. 4, pp. 974-983, 2011. [19] S.-W. Sohn, Y.-B. Lim, J.-J. Yun, H. Choi and H.-D. Bae, "A Filter Bank and a Self-Tuning Adaptive Filter for the Harmonic and Interharmonic Estimation in Power Signals," IEEE Trans. Instrum. Meas., vol. 61, no. 1, pp. 64-73, Jan 2012. [20] N. Tse, J. Chan, W.-H. Lau and L. L. Lai, "Hybrid Wavelet and Hilbert Transform With Frequency-Shifting Decomposition for Power Quality Analysis," IEEE Trans. Instrum. Meas., vol. 61, no. 12, pp. 3225-3233, Dec 2012. [21] H. Chen, Y. Sun and Y. Cheng, "Harmonic and inter-harmonic detection of grid-connected distributed generation based on modified mathematical morphology filter and Hilbert-Huang transformation," in Power Electronics and Motion Control Conference, 2009. IPEMC '09. IEEE 6th International, 2009. [22] C. Chen, G. Chang, R. Hong and H. Li, "Extended real model of Kalman filter for time-varying harmonics estimation," IEEE Trans. Power Del., vol. 25, no. 1, pp. 17-26, 1 2010. [23] A. Bracale, G. Carpinelli, Z. Leonowicz, T. Lobos and J. Rezmer, "Measurement of IEC groups and subgroups using advanced spectrum estimation methods," IEEE Trans. Instrum. Meas., vol. 57, no. 4, pp. 672-681, 4 2008. [24] I.-H. Gu and M. Bollen, "Estimating interharmonics by using sliding-window ESPRIT," IEEE Trans. Power Del., vol. 23, no. 1, pp. 1323, 1 2008. [25] S. K. Jain and S. N. Singh, "Exact model order ESPRIT technique for harmonics and interharmonics estimation," IEEE Trans. Instrum. Meas., 2012. [26] S. Jain, S. Singh and J. Singh, "An Adaptive Time-Efficient Technique for Harmonic Estimation of Nonstationary Signals," IEEE Trans. Ind. Electron., vol. 60, no. 8, pp. 3295-3303, Aug 2013. [27] G. Chang, C.-I. Chen and Y.-F. Teng, "Radial-basis-function-based neural network for harmonic detection," IEEE Trans. Ind. Electron., vol. 57, no. 6, pp. 2171-2179, 6 2010. [28] S. Jain, D. Saxena and S. Singh, "Adaptive wavelet neural network based harmonic estimation of single-phase systems," in Utility Exhibition on Power and Energy Systems: Issues Prospects for Asia (ICUE), 2011 International Conference and, 2011. [29] S. Jain and S. Singh, "Fast Harmonic Estimation of Stationary and Time-Varying Signals Using EA-AWNN," IEEE Trans. Instrum. Meas., vol. 62, no. 2, pp. 335-343, Feb 2013. [30] S. Jain and S. Singh, "Low-Order Dominant Harmonic Estimation Using Adaptive Wavelet Neural Network," IEEE Trans. Ind. Electron., vol. 61, no. 1, pp. 428-435, Jan 2014. [31] S. K. Jain and S. Singh, "Harmonics estimation in emerging power system: Key issues and challenges," Electric Power Systems Research , vol. 81, no. 9, pp. 1754-1766, 2011. [32] C. Chakrabarti, M. Vishwanath and R. Owens, "Architectures for wavelet transforms: A survey," Journal of VLSI signal processing systems for signal, image and video technology, vol. 14, no. 2, pp. 171-192, 1996. [33] K. Kotteri, S. Barua, A. Bell and J. Carletta, "A comparison of hardware implementations of the biorthogonal 9/7 DWT: convolution versus lifting," Circuits and Systems II: Express Briefs, IEEE Transactions on, vol. 52, no. 5, pp. 256-260, May 2005. [34] D. Garcia, M. Mansour and M. Ali, "A Flexible Hardware Architecture for Wavelet Packet Transform With Arbitrary Tree Structure," Circuits and Systems II: Express Briefs, IEEE Transactions on, vol. 60, no. 10, pp. 657-661, Oct 2013. [35] G. Betta, L. Ferrigno and M. Laracca, "Cost-Effective FPGA Instrument for Harmonic and Interharmonic Monitoring," IEEE Trans. Instrum. Meas., vol. 62, no. 8, pp. 2161-2170, Aug 2013.
[36] L. Ferrigno, C. Landi and M. Laracca, "FPGA-based measurement instrument for power quality monitoring according to IEC standards," in Instrumentation and Measurement Technology Conference Proceedings, 2008. IMTC 2008. IEEE, 2008. [37] E. Hamid, R. Mardiana and Z.-I. Kawasaki, "Method for RMS and power measurements based on the wavelet packet transform," Science, Measurement and Technology, IEE Proceedings -, vol. 149, no. 2, pp. 60-66, Mar 2002. [38] R. A. Losada, Digital Filters with MATLAB, The MathWorks, Inc .[Avilable online], https://www.mathworks.com/tagteam/82961_digfilt.pdf, May 18, 2008. [39] Model-Based DSP Design using System Generator, UG897 (v2014.3), October 1, 2014, Xilinx May 18, 2008. [40] W.-K. Yoon and M. Devaney, "Power measurement using the wavelet transform," IEEE Trans. Instrum. Meas., vol. 47, no. 5, pp. 12051210, Oct 1998. [41] G. D'Antona, C. Muscas, P. Pegoraro and S. Sulis, "Harmonic source estimation in distribution systems," IEEE Trans. Instrum. Meas., vol. 60, no. 10, pp. 3351-3359, 10 2011. [42] J. Napoles, A. Watson, J. Padilla, J. Leon, L. Franquelo, W. Patrick and M. Agirre, "Selective harmonic mitigation technique for cascaded H-bridge converters with non-equal DC link voltages," IEEE Trans. Ind. Electron., vol. PP, no. 99, p. 1, 2012. [43] N. Locci, C. Muscas and S. Sulis, "Investigation on the accuracy of harmonic pollution metering techniques," IEEE Trans. Instrum. Meas., vol. 53, no. 4, pp. 1140-1145, 8 2004.