University of Augsburg Prof. Dr. Hans Ulrich Buhl Research Center Finance & Information Management Department of Information Systems Engineering & Financial Management
Discussion Paper WI-205
How to measure data quality? – a metric based approach by Bernd Heinrich, Marcus Kaiser, Mathias Klier
in: S. Rivard, J. Webster, eds., Proceedings of the 28th International Conference on Information Systems (ICIS), Montreal, (Canada), December 2007
Universität Augsburg, D-86135 Augsburg Visitors: Universitätsstr. 12, 86159 Augsburg Phone: +49 821 598-4801 (Fax: -4899) www.fim-online.eu
HOW TO MEASURE DATA QUALITY? - A METRIC BASED APPROACH
Journal: Manuscript ID: Track: Keywords:
Abstract:
International Conference on Information Systems 2007 ICIS-DESIGN-0020-2007.R1 Design Science Data Quality, Data Quality Management, Data Quality Metrics The growing relevance of data quality has revealed the need for adequate measurement since quantifying data quality is essential for planning quality measures in an economic manner. This paper analyzes how data quality can be quantified with respect to particular dimensions. Firstly, several requirements are stated (e.g. normalization, interpretability) for designing adequate metrics. Secondly, we analyze metrics in literature and discuss them with regard to the requirements. Thirdly, based on existing approaches new metrics for the dimensions correctness and timeliness that meet the defined requirements are designed. Finally, we evaluate our metric for timeliness in a case study: In cooperation with a major German mobile services provider, the approach was applied in campaign management to improve both success rates and profits.
Page 1 of 15
HOW TO MEASURE DATA QUALITY? A METRIC BASED APPROACH Bernd Heinrich University of Augsburg Universitaetsstr. 16, Germany
[email protected]
Marcus Kaiser University of Augsburg Universitaetsstr. 16, Germany
[email protected]
Mathias Klier University of Augsburg Universitaetsstr. 16, Germany
[email protected] Abstract The growing relevance of data quality has revealed the need for adequate measurement since quantifying data quality is essential for planning quality measures in an economic manner. This paper analyzes how data quality can be quantified with respect to particular dimensions. Firstly, several requirements are stated (e.g. normalization, interpretability) for designing adequate metrics. Secondly, we analyze metrics in literature and discuss them with regard to the requirements. Thirdly, based on existing approaches new metrics for the dimensions correctness and timeliness that meet the defined requirements are designed. Finally, we evaluate our metric for timeliness in a case study: In cooperation with a major German mobile services provider, the approach was applied in campaign management to improve both success rates and profits.
Keywords: Data Quality, Data Quality Management, Data Quality Metrics
Twenty Eighth International Conference on Information Systems, Montreal 2007
1
Page 2 of 15 Design Science
Introduction In recent years, data quality (DQ) has gained more and more importance in theory and practice due to an extended use of data warehouse systems, management support systems (Cappiello et al. 2003) and a higher relevance of customer relationship management (CRM) as well as multichannel management (Cappiello et al. 2004b; Heinrich and Helfert 2003). This refers to the fact that – for decision makers – the benefit of data depends heavily on their completeness, correctness, and timeliness, respectively. Such properties are known as DQ dimensions (Wang et al. 1995). Many firms have problems to ensure DQ (Strong et al. 1997) and according to an earlier study by (Redman 1998) "the total cost of poor data quality" is between 8% and 12% of their revenues. Other studies indicate that 41% of the data warehouse projects fail, mainly due to insufficient DQ (Meta Group 1999). Furthermore, 67% of marketing managers think that the satisfaction of their customers suffers from poor DQ (SAS Institute 2003). These figures impressively illustrate the relevance of DQ today. The consequences of poor DQ are manifold: They range from worsening customer relationships and customer satisfaction by falsely addressing customers to insufficient decision support for managers. The growing relevance of DQ has revealed the need for adequate measurement. Quantifying the current state of DQ (e.g. of customer data) is essential for planning DQ measures in an economic manner. In the following we discuss how metrics for selected DQ dimensions can be designed with regard to two objectives: (1) Enabling the measurement of DQ, (2) Analyzing the economic consequences of DQ measures taken (e.g. to what extent does data cleansing of customer’s address data improve their correctness and lead to higher profits?). The developed metrics were applied in cooperation with a major German mobile services provider. The aim of the project was to analyze the economic consequences of DQ measures in campaign management. Taking into account the design guidelines defined by (Hevner et al. 2004), we consider the metrics as our artifact and organize the paper as follows: After briefly discussing the relevance of the problem in this introduction, the next section defines requirements that guide the process of searching for adequate DQ metrics. In section three, selected approaches are analyzed. The fourth section designs innovative, formally noted metrics for the DQ dimensions correctness and timeliness, and examines their contribution compared to existing approaches. For evaluating the designed metrics, a case study can be found in the fifth section: It especially illustrates how the metric for timeliness was applied within the campaign management of a mobile services provider and points out the economic benefit of using the metric. The last section sums up and critically reflects the results.
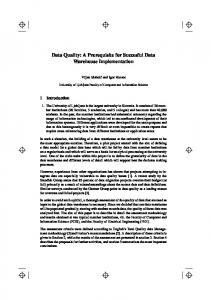
Requirements of Data Quality Metrics In order to support an economically oriented management of DQ, metrics are needed to quantify DQ so as to answer questions like the following: Which measure improves DQ most? Which one has the best costs-benefit ratio? Figure 1 illustrates the closed loop of an economically oriented management of DQ. This loop can be influenced via DQ measures (e.g. data cleansing measures, buying external address data etc.). Taking measures improves the current level of DQ (quantified by means of metrics). This leads to a corresponding economic benefit (e.g. enabling more effective customer contacts). Moreover, based on the level of DQ and taking into account benchmarks and thresholds, firms can decide on taking (further) measures or not. From an economic view, only those measures must be taken that are efficient with regard to costs and benefit (Campanella 1999; Feigenbaum 1991; Shank et al. 1994). E.g. given two mutually exclusive measures having equal economic benefit, it is rational to choose the one with lower costs. Therefore, this paper aims at quantifying quality by means of metrics for particular dimensions. The identification and classification of DQ dimensions is treated from both a scientific and a practical point of view by many publications (English 1999; Eppler 2003; Lee et al. 2002; Jarke et al. 1997; Redman 1996; Wang et al. 1995). In this paper, we do not treat DQ dimensions (e.g. concise representation) that concern aspects like syntactic criteria or data formats, but deal with semantics of data values. Furthermore, we focus on the two dimensions correctness and timeliness (meant here as quantifying recency), since these dimensions have been paid less attention in scientific literature (see next section). The second reason for selecting these two dimensions is that the main problem of many domains like CRM and manufacturing information products is usually not the incompleteness of data. Instead, it is of higher relevance to keep huge sets of customer data, transaction data and contract data correct and up-to-date. Thirdly, it is important that the DQ level can be quantified to a large extent automatically, which leads to lower costs
2
Twenty Eighth International Conference on Information Systems, Montreal 2007
Page 3 of 15 Heinrich et. al. / How to measure Data Quality? A metric based approach
of measurement, especially in case of huge sets of data. Therefore, we focus on the dimension timeliness, because – as described below – it seems to be particularly adequate.
DQ Dimensions
Kennzahl Kennzahl DQ Level Kennzahl Kennzahl
(quantified by means of Metrics)
Benefit
DQ Measures
Costs
Figure 1: Data quality loop In literature there are two different perspectives on the measurement of quality (Heinrich and Helfert 2003; Juran 2000; Teboul 1991): Quality of Design and Quality of Conformance. Quality of Design denotes the degree of correspondence between the users’ requirements and the specification of the information system (e.g. specified by means of data schemata). In contrast, Quality of Conformance represents the degree of correspondence between the specification and the existing realization in information systems (e.g. data schemata vs. set of stored customer data). The distinction between Quality of Design and Quality of Conformance is important within the context of quantifying DQ: It separates the (mostly) subjective analysis of the correspondence between the users’ requirements and the specified data schemata from the measurement – which is more objective – of the correspondence between the specified data schemata and the existing data values. In the following we focus on Quality of Conformance. In practice, most DQ measures taken are developed on an ad hoc basis to solve specific problems (Pipino et al. 2002) and thus are often affected by a high level of subjectivity (Cappiello et al. 2004a). In order to enable a scientific foundation and a design evaluation of the metrics, we state the following requirements: First, we refine the representation consistency by (Even and Shankaranarayanan 2007) to requirements (R 1) to (R 3): R 1.
[Normalization] An adequate normalization is necessary to assure that the values of the metrics are comparable (e.g. to compare different levels of DQ over time; Pipino et al. 2002). In this context, DQ metrics are often ratios with a value ranging between 0 (perfectly bad) and 1 (perfectly good) (Pipino et al. 2002; Even and Shankaranarayanan 2007).
R 2.
[Interval scale] To support both the monitoring of how the DQ level changes over time and the economic evaluation of measures, we require the metrics to be interval scaled. This means, the difference between two levels of DQ must be meaningful. Consider for instance an identical difference of 0.2 between the values 0.7 and 0.9 and the values 0.4 and 0.6 of the metric for correctness; this means, that the quantity of data that is correct changes to the same extent in both cases.
R 3.
[Interpretability] (Even and Shankaranarayanan 2007) demand the measurement being “easy to interpret by business users”. For this reason, the DQ metrics have to be comprehensible. E.g., considering a metric for timeliness, it could be interpretable as the probability that a given attribute value within the database is still up-to-date.
(R 4) integrates the consistency principles interpretation consistency and aggregation consistency stated by (Even and Shankaranarayanan 2007). R 4.
[Aggregation] In case of a relational1 data model, the metrics shall allow a flexible application. Therefore, it must be possible to quantify DQ on the level of attribute values, tupels, relations and the whole database in a
1
If the metrics are adequate for attributes, tupels and relations, they are also usable for views as well as structured data in an Excel spreadsheet: Views are a set of attribute values and can therefore be valuated by the metrics developed according to our requirements. Moreover, (R 4) demands that the DQ of several views can be aggregated.
Twenty Eighth International Conference on Information Systems, Montreal 2007
3
Page 4 of 15 Design Science
way, so that the values have consistent semantic interpretation (interpretation consistency) on each level. In addition, the metrics must allow aggregation of values on a given level to the next higher level (aggregation consistency). E.g., the measurement of the correctness of a relation should be computed based on the values of the correctness of the tupels being part of the relation and have the same meaning as the DQ measurement on the level of tupels. (Even and Shankaranarayanan 2007) demand impartial-contextual consistency of the metrics. This refers to our requirement of the metrics being adaptive and thereby enabling a contextual perception of DQ in (R 5). R 5.
[Adaptivity] To quantify DQ in a goal-oriented way, it is necessary that the metrics can be adapted to the context of a particular application. If the metrics are not adapted, they should fold back to the non-adapted (impartial) measurement.
In addition, we state one more property that refers to the measurement procedure. R 6.
[Feasibility] For the purpose of enabling their application, the metrics are based on input parameters that are determinable. When defining metrics, measurement methods should be defined and in cases when exact measurement is not possible or cost-intensive, alternative (rigorous) methods (e.g. statistical) shall be proposed. From an economic point of view, it is also required that the measurement procedure can be accomplished at a high level of automation.
Literature Review Literature already provides a few approaches for quantifying DQ. They differ in the DQ dimensions taken into account and in the underlying measurement procedures (Wang et al. 1995). In the following, we briefly describe some selected approaches for the DQ dimensions correctness and timeliness and analyze them with respect to the requirements above. The AIM Quality (AIMQ) method for quantifying DQ consists of three elements (Lee et al. 2002): The first element is the product service performance model which arranges a given set of DQ dimensions in four quadrants. On the one hand, the DQ dimensions are distinguished by their measurability depending on whether the improvements can be assessed against a formal specification (e.g. completeness with regard to a database schema) or an user’s requirement (e.g. interpretability). On the other hand, a distinction is made between product and service quality. Based on this model, DQ is quantified via the second element: A questionnaire for asking users about their estimation of DQ. The third element of the AIMQ method consists of two analysis techniques in order to interpret the assessments. The first technique compares the DQ of an organization to a benchmark from a best-practices organization. The second technique quantifies the distances between the assessments of different stakeholders. Beyond novel contributions the AIMQ method for DQ Measurement is based on the (subjective) users’ estimation of DQ via a questionnaire. Therefore, it refers mainly to a Quality of Design definition, whereas we focus on a Quality of Conformance definition. Since the approach is not formally noted, it can hardly be analyzed whether it meets the requirements (R 1) to (R 3). It also does not deal with aggregating DQ from lower levels (e.g. correctness on the level of attribute values) to the next higher level (e.g. correctness on the level of tupels) (R 4). Moreover, they provide no possibility to adapt this measurement to a particular scope (R 5). Instead, it combines (subjective) DQ estimations of several users who generally use data for different purposes. Besides this scientific approach two practical concepts by English and Redman shall be briefly discussed in the following. English describes the total quality data management method (English 1999) that follows the concepts of total quality management. He introduces techniques for quantifying quality of data schemata and architectures (of information systems), and quality of attribute values. Despite the fact that these techniques were applied within several projects, a general, well-founded procedure for quantifying DQ is missing. In contrast, Redman chooses a process oriented approach and combines measurement procedures for selected parts in an information flow with the concept of statistical quality control (Redman 1996). He also does not present any formally noted metrics. In the following, we discuss two approaches (Hinrichs 2002 and Ballou et al. 1998) in detail. To our best knowledge, these are the only approaches that (1) are formally noted, (2) are based for the most part on a Quality of Conformance definition and (3) design metrics for at least one of the dimensions correctness and timeliness. From a conceptual view, the approach by (Hinrichs 2002) is very interesting, since it aims at an objective, goaloriented measurement. His metrics for correctness and timeliness are defined as follows.
4
Twenty Eighth International Conference on Information Systems, Montreal 2007
Page 5 of 15 Heinrich et. al. / How to measure Data Quality? A metric based approach
To be determined as correct, the values of attributes in the information system must correspond to their real world counterparts. Let wI be a value of an attribute within a database and wR the corresponding value of the attribute in the real world. d(wI, wR) is a domain-specific distance function quantifying the difference between wI and wR, 0 if wI = wR (which is normalized to the interval [0; ]. Examples for such distance functions are d1 ( wI , wR ) := else
independent of the field of application), d 2 ( wI , wR ) := wI
wR for numeric, metrically scaled attributes and edit distance, Levenshtein distance or Hamming distance for strings. Based on such distance functions, Hinrichs defines the metric for correctness as follows: QCorr . ( wI , wR ) :=
1 d ( wI , wR ) + 1
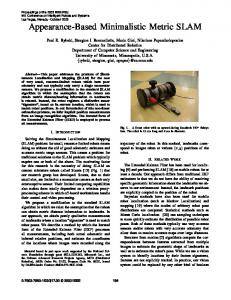
When applying this metric – besides others – the following problems arise: Firstly, the results are hardly interpretable (R 3). This can be illustrated by the example in Figure 2 that analyzes the correctness of the attribute “surname” and the values “Eissonhour” and “Eisenhower” as well as “Bird” and “Hunt”. The example uses the Levenshtein distance as distance function, which is given by the minimum number of operations needed to transform a string into another. Operation means here an insertion, deletion, or substitution of a single character: QCorr. (" Eissonhour " , " Eisenhower " ) = QCorr. (" Bird " , " Hunt " ) =
1 1 = = 20.0% d Lev. (" Eissonhour " , " Eisenhower " ) + 1 4 + 1
1 1 = = 20.0% d Lev. (" Bird " , " Hunt " ) + 1 4 + 1
Figure 2: Quantifying correctness by means of the metric designed by (Hinrichs 2002)
As the example illustrates, we get the same result (20.0%), although the surname “Eissonhour” may be identified (as the correct surname “Eisenhower”) e.g. within a mailing campaign, whereas considering “Bird” and “Hunt”, it is nearly impossible that a mailing reaches the customer (this problem arises also when using other distance functions as e.g. the Hamming distance). Four facts cause this weakness: Firstly, the range of the resulting values for correctness depends heavily on the applied distance function (R 1). Secondly, the value range [0; 1] is generally not covered, because the value only results in 0 if the number of failures is . Thirdly, using a quotient leads to the fact that the values are not interval scaled (R 2), which hinders evaluation of DQ measures. Moreover, the results of the metric are not interpretable (R 3) due to the quotient, i.e. the metric is hardly applicable within an economically oriented management of DQ, since both absolute and relative changes of the metric cannot be interpreted. Table 1 demonstrates the weakness: To improve the value of correctness from 0.0 to 0.5, the corresponding distance function has to be decreased from to 1.0. In contrast, an improvement from 0.5 to 1.0 only needs a reduction from 1.0 to 0.0, i.e. only one failure has to be corrected. Summing up, it is not clear how an improvement of correctness (for example from 0.0 to 0.5) has to be interpreted. Table 1. Improvement of correctness and necessary change of the distance function Improvement of correctness 0.0
0.5
0.5
1.0
Necessary change of d(wI, wR) 1.0 1.0
0.0
Besides correctness we take a closer look at the DQ dimension timeliness. Timeliness refers to whether the values of attributes are still up-to-date (for a literature review about existing definitions of timeliness see (Cappiello et al. 2004b)). The metric for timeliness shall deliver an indication (not a verified statement under certainty) whether an attribute value has changed in the real world since its acquisition and storage within the system or not. Therefore, Hinrichs proposed the following quotient (Hinrichs 2002):
Timeliness =
1 (mean attribute update time ) (attribute age ) + 1
Twenty Eighth International Conference on Information Systems, Montreal 2007
5
Page 6 of 15 Design Science
This quotient serves as a metric, which quantifies if the current attribute value is outdated. Related to the input factors taken into account, the quotient returns reasonable results: On the one hand, if the mean attribute update time is 0 (i.e. the attribute value never becomes out of date), timeliness is 1 (attribute value is up-to-date). If on the other hand attribute age is 0 (i.e. the attribute value is acquired at the instant of quantifying DQ) we get the same result. For higher values of mean attribute update time or attribute age the result of the metric approaches 0. I.e., that the (positive) indication (the attribute value is still corresponding to its real world counterpart) decreases. However, this metric bears similar problems as the metric for correctness described above. Firstly, the value range [0; 1] is generally not covered, because we only get a value of 0 if the value of mean attribute update time or attribute age respectively is (R 1). In addition, by building a quotient the values are not interval scaled (R 2). Moreover, the metrics are hardly applicable within an economic oriented management of DQ, since both absolute and relative changes cannot be interpreted easily (R 3). I.e., the value of the metric cannot for instance be interpreted as a probability that the stored attribute value still corresponds to the current state in the real world. These facts hinder the evaluation of realized DQ measures ex post. In contrast, another approach by (Ballou et al. 1998) defines the metric for timeliness as follows (the notation was slightly adapted):
Timeliness = {max[(1
currency ),0]}s shelf life
The currency of an attribute value is – in contrast to (Hinrichs 2002) – computed as follows: The time between the instant of quantifying timeliness and the instant of acquiring the attribute value is added to the age of the attribute value in the instant of acquiring it. This corresponds to the age of the attribute value at the instant of quantifying DQ. Shelf life is an indicator for the volatility of the attribute values. Thereby, a relatively high shelf life leads to a high result of the metric for timeliness and vice versa. By choosing s – which has to be assigned by experts – one can influence to which extent a change of the quotient (currency/shelf life) affects the result of the metric. Thereby it is possible to adapt the computation to the attribute considered and to the particular application (R 5). It seems that it is the aim of (Ballou et al. 1998) to derive mathematical relations. They do not focus on getting values of the metric which are interpretable within an economic oriented management of DQ (cp. R 3) and easily understandable for instance by business departments (i.e. a marketing division in case of a CRM campaign). The results of their metric are only interpretable as the probability that the attribute value in the information system still corresponds to its real world counterpart in the case of s = 1 (in this case, a uniform distribution is assumed). For s 1, the result of the metric cannot be regarded as a probability. I.e., that applying the exponent s worsens the interpretability of the results (cp. R 3) and they are no longer interval scaled (R 2). Based on this literature review – that illustrates a gap in scientific literature –, we design metrics for the dimensions correctness and timeliness in the next section.
Design of Data Quality Metrics Firstly, we consider the dimension correctness: Again, wI is an attribute value and wR the corresponding attribute value in the real world. d(wI, wR) is a domain-specific distance function quantifying the difference between wI and wR. We want to assure the metric being normalized to the interval [0; 1] (R 1), without using a quotient. In contrast to the metric defined by Hinrichs, we therefore use a different functional equation and a distance function that is 0 if wI = wR normalized to the interval [0; 1]. Examples for such distance functions are d1 ( wI , wR ) := , which is 1 else
independent of the field of application, d 2 ( wI , wR ) :=
wI
wR
max{| wI |, | wR |}
with
+
(normalized to the
interval [0; 1]) for numeric, metrically scaled attributes and edit distance, Levenshtein distance or Hamming distance for strings (also in their well-known normalized type). The metric on the level of attribute values is therefore defined as follows: (1)
6
QCorr. ( wI , wR ) := 1 d ( wI , wR )
Twenty Eighth International Conference on Information Systems, Montreal 2007
Page 7 of 15 Heinrich et. al. / How to measure Data Quality? A metric based approach
An example demonstrates how the metric works: Before starting a mailing campaign, the correctness of the attributes “postal code” and “house number” shall be evaluated. Based upon the distance function d2(wI, wI), the application of the metric can be illustrated as follows: First, to assure the adaptivity according to (R 5) on the level of attribute values the parameter has to be chosen. In case of the attribute “postal code” even small deviations shall be penalized, because a deviation of only 1% (e.g. the postal codes 80000 (=wI) and 79200 (=wR)) hinders the delivery of a mailing. Therefore, the distance function has to react even on small deviations in a sensitive way. That is why will be chosen such that