International Journal of
Intelligent Systems and Applications in Engineering ISSN:2147-67992147-6799
Advanced Technology and Science
www.atscience.org/IJISAE
Original Research Paper
Hybridizing Taguchi Algorithm with Reference Ideal Method to Solve Machining Problems Mehmet Alper Sofuoğlu1* DOI: 10.1039/b000000x Accepted : 11/03/2017 Published: 30/06/2017
DOI: 10.1039/b000000x
Abstract: New materials lead to the occurrence of high technology industries. These materials are high strength, corrosion and heat resistant steel alloys, titanium, ceramics, composites, and other non-metallic materials. Conventional machining methods are not proper to machine these materials in terms of high surface quality. Such materials are generally processed using non-traditional machining methods. Multi criteria decision making models (MCDM) are extensively used in material-process selection, and optimization of machining problems in engineering. In this study, a novel hybrid optimization model is proposed. Taguchi method is hybridized with Reference Ideal Method. The model is tested using two case studies (conventional and non-traditional machining problems) taken from literature. The proposed model can be used by engineers and operators in manufacturing environment. Keywords: Reference Ideal Method, Taguchi design, Multi Criteria Decision Making, Optimization, Non-traditional machining
1. Introduction Significant changes occur in the manufacturing processes with the rapid development of information and space technology. Compared to the currently used traditional methods such as turning, drilling, milling etc., the use of many different nontraditional methods, such as laser, water jet, electrical discharge and ultrasonic machining methods is increasing. Especially, complex shaped parts and difficult to cut materials are machined using non-traditional machining methods [1-2]. There are many studies examining the effects of machining parameters (cutting speed, feed rate, cutting depth, cutting tool geometry) on cutting forces and surface roughness in the literature [3-6]. Bartarya et al. [7] used uncoated CBN tools in the machining of EN31 steel in finishing operation and developed a model which predicts the cutting forces. The developed model has been compared with the values of cutting force and surface roughness which were measured before. The appropriate cutting parameters were proposed for the efficient use of the energy. Yen et al. [8] studied the effect of cutting tool insert on the cutting forces in orthogonal cutting conditions by using the finite element method. Benga and Abrao [9] investigated the effect of cutting speed and feed rate on the surface roughness and tool life in the machining process of the hardened 100Cr6 bearing steels by using ceramic and CBN tools. They observed that the feed rate significantly affects the surface roughness for ceramic and CBN cutting tools. However, the effect of cutting speed on surface roughness is relatively low. Ozel et al. [10] examined the effect of cutting tool, cutting edge geometry, workpiece hardness, feed rate and cutting speed on the surface roughness and cutting forces in the finishing process of hard turning of AISI-H13 steel by using CBN tools. Feng and Wang [11] developed an empirical model for the surface roughness by using fractional factorial design. They performed a non-linear analysis by using the surface roughness of workpiece, _______________________________________________________________________________________________________________________________________________________________________________________________________________________________________________________________________________________________________________________________
University of Eskişehir Osmangazi,Mechanical Engineering Meşelik – 26480, Turkey * Corresponding Author e-mail:
[email protected] 1
This journal is © Advanced Technology & Science
feed rate, cutting tool angle, cutting depth, cutting speed and the other variables. Chen [12] investigated the cutting forces and surface roughness in the hardened steel machining process by using CBN cutting tools. Arsecularatne et al. [13] studied AISI D2 machining process using PCBN tools. They stated that when cutting speed is 70 m/min., the most appropriate value of tool life and material removal rate are obtained. There has been an increasing amount of literature on multi criteria decision making models (MCDM). There are a lot of studies in the area of material science [15-20], production technologies [21], mass production [22], manufacturing sector [23], manufacturing systems [24], global production [25] and production strategies [26]. There are a lot of published studies in MCDM for manufacturing and material science. Buyurgan and Saygın [27] investigated part routing and real time scheduling using MCDM methods. For machine selection problem, İç et al. [28] studied AHP method and Yurdakul and İç [29] developed TOPSIS model. Numerous studies have attempted to analyse material selection problem using TOPSIS, ELECTRE, PROMETHEE, VIKOR etc. [30-34]. Yurdakul [15] and Çalışkan et al. [35] analysed cutting tool selection problem using AHP, ANP, TOPSIS, VIKOR and EXPROM-2. Up to now, for MCDM techniques, previous studies were generally carried out in Operation Research-Soft Computing and energyenvironment-sustainability. In machining operations, researchers rarely developed MCDM models. Reference Ideal Method has been proposed as a multi criteria decision making model recently in the literature [36]. In this study, this method is combined with Taguchi experimental design. The developed model in this study is a new hybrid decision making model and it is used for the first time in the literature. In this study a new hybrid optimization method is proposed. Reference Ideal Method is used with Taguchi design to determine the final ranking and optimize the machining parameters. Two different machining optimization problems taken from literature are tested using proposed method. IJISAE, 2017, 5(2), 64-69 | 64
In the second part of the study, methods used in the study are explained briefly. In the third section machining problems taken from literature are summarised. In the final sections, results, discussion and conclusion sections are given, respectively.
2. Methodology 2.1. Reference Ideal Method This method was introduced by Cables et al. [36]. The steps are given as follows: Step 1 Normalization process: In this process, reference ideal interval is determined. This includes label sets and simple values that show the maximum importance or relevance. The distance to reference ideal interval is calculated by using following equation (Eq.1). 𝑑𝑚𝑖𝑛 (𝑥, [𝐶, 𝐷]) = 𝑚𝑖𝑛 (|𝑥 − 𝐶|, (|𝑥 − 𝐶| (1) X is the valuation for a given approach and the interval [𝐶, 𝐷] is the reference ideal. Following equation is used to carry out the normalization based on the Range and the Reference Ideal (Eq.2): 𝑓(𝑥, [𝐴, 𝐵], [𝐶, 𝐷]) = 1 𝑠𝑖 𝑥 ∈ [𝐶, 𝐷] 𝑠𝑖 𝑥 ∈ [𝐴, 𝐶] ∧ 𝐴 ≠ 𝐶 𝑑𝑚𝑖𝑛 (𝑥,[𝐶,𝐷]) 1− (2) |𝐴−𝐶| 𝑑
(𝑥,[𝐶,𝐷])
1 − 𝑚𝑖𝑛|𝐷−𝐵| 𝑠𝑖 𝑥 ∈ [𝐷, 𝐵] ∧ 𝐷 ≠ 𝐵 { } where, [A,B] is the range that shows a universe of discourse [C,D] shows the Reference Ideal. 𝑥 ∈ [𝐴, 𝐵] and [𝐶, 𝐷] ⊂ [𝐴, 𝐵] should be satisfied. The function f allows to obtain a value that belongs to the unitary interval. Step 2: Calculate the weighted normalized matrix Y. Step 3: Calculate the variation to the normalized reference ideal for each alternative Ai (Eq.3-4) 𝐼𝑖 + = √∑𝑛𝑗=1(𝑦𝑖𝑗 ′ − 𝑤𝑗 )2
(3)
𝐼𝑖 − = √∑𝑛𝑗=1(𝑦𝑖𝑗 ′ )2
(4)
. i=1,2,3…m (the number of alternatives) j=1,2,3…n (the number of criteria) where, 𝑦𝑖𝑗 ′ :weighted normalized matrix values 𝑤𝑗 : Weight values Step 4: Calculate the relative index (𝑅𝑖 ) (Eq.5) 𝑅𝑖 =
𝐼𝑖 − 𝐼𝑖 + +𝐼𝑖 −
(5)
Step 5: Rank the alternatives.
3. Case Studies 3.1. Case study-1 Case study-1 is taken from Qu et al. [38]. In this case study, milling experiments are conducted to determine cutting force, surface roughness and material removal rate. Machining tests are performed on three dimensional machining centre. The four-flute flat end milling cutter with 16 mm diameter and 30 0 helix angle is used. The material of the cutter is solid carbide coated with TiSiN. The workpiece dimensions are 120 ×100× 6 mm. The material of the workpiece is die steel NAK80. The milling parameters are spindle speed, feed per tooth and axial depth of cut. The radial depth of cut is selected as 1 mm. The Taguchi method (L27) is used to design the experiments. [38]. The purpose of the model is to maximize material removal rate and to minimize surface roughness and cutting force In Table 1, experimental design of case study-1 is presented. There are three inputs (spindle speed, feed per tooth and axial depth of cut) and three outputs (cutting force, surface roughness, material removal rate). Table 1. Experimental design for case study-1 [38] Spindle speed (rpm)
1600 1600 1600 1600 1600 1600 1600 1600 1600 2100 2100 2100 2100 2100 2100 2100 2100 2100 2600 2600 2600 2600 2600 2600 2600 2600 2600
Feed per tooth (mm) 0.15 0.15 0.15 0.2 0.2 0.2 0.25 0.25 0.25 0.15 0.15 0.15 0.2 0.2 0.2 0.25 0.25 0.25 0.15 0.15 0.15 0.2 0.2 0.2 0.25 0.25 0.25
Axial Cutting depth of force cut (mm) (N) 0.4 0.55 0.7 0.4 0.55 0.7 0.4 0.55 0.7 0.4 0.55 0.7 0.4 0.55 0.7 0.4 0.55 0.7 0.4 0.55 0.7 0.4 0.55 0.7 0.4 0.55 0.7
27.3 42.7 58.5 33.2 52.8 70.2 39.2 54.6 69.8 35.3 49.6 68.5 39.7 56.5 73.4 43.9 58.3 73.6 38.5 52.7 72.3 43.6 61.3 82.3 48.9 71.4 85.6
Surface roughness (µm) 0.532 0.853 1.215 0.587 0.912 1.316 0.671 1.03 1.487 0.498 0.834 1.042 0.566 0.878 1.195 0.627 0.902 1.268 0.468 0.815 0.926 0.487 0.773 1.026 0.568 0.869 1.056
Material removal rate (mm3/min) 384 503 672 512 704 896 640 880 1120 504 693 882 672 924 1176 840 1155 1470 624 858 1092 832 1144 1456 1040 1430 1820
2.2. Taguchi Experimental Design Experimental design is used to decrease the number of experiments and design the experiments properly. It was firstly developed by the British statistician R.A. Fisher and others in 1920. The methods used in the statistical experimental design are classified into three as full factorial, fractional factorial and Taguchi methods [37]. Taguchi design is an optimization method which is based on parameter, system and tolerance design. The orthogonal arrays are used in order to show different experimental conditions. Different factors are tested in the orthogonal array. Frequently, L4, L8 and L16 arrays are used for two levels and the L9 and L27 arrays are used for three levels [37]. This journal is © Advanced Technology & Science
In Table 2, the factor levels of experiments are shown. Three levels are used for each factors. Table 2. The factor levels of the experiments (Case study-1) Factors/levels Spindle speed (rpm) Feed per tooth (mm) Axial depth of cut (mm)
1 1600 0.15 0.4
2 2100 0.2 0.55
3 2600 0.25 0.7
3.2. Case study-2 Case study-2 is taken from Tripathy and Tripathy. [39]. Powder mixed electro-discharge machining (PMEDM) operation is carried out. Commercial grade EDM oil is used as dielectric fluid. In order IJISAE, 2017, 5(2), 64–69 | 65
to prevent the wastage of dialectic fluid, a detachable tank is designed. A pump and stirring arrangement is installed to provide appropriate distribution of the powder. Each experimental run takes about 15 minutes. The dimensions of the workpiece are 120 × 60 × 25 mm. The material of the workpiece is hot work steel. The electrolytic copper is selected as tool electrode which has 20 × 20 × 60 mm dimensions. Taguchi L27 orthogonal design is used. The purpose of the model is to maximize MRR and to minimize TWR, EWR and ASR. Abbreviations for case study-2 are shown in Table 3.
CD = [27.3, 27.3, 0.468, 0.468, 1820, 1820] Experimental design matrix of case study-1 with RIM scores is shown in Table 5.
Table 5. The results of RIM for case study-1 Spindle speed
Feed per tooth
1 1 1 1 1 1 1 1 1 2 2 2 2 2 2 2 2 2 3 3 3 3 3 3 3 3 3
1 1 1 2 2 2 3 3 3 1 1 1 2 2 2 3 3 3 1 1 1 2 2 2 3 3 3
Table 3. Abbreviations for case study-2 Cp Ip Ton DC Vg MRR TWR EWR ASR
Chromium powder (g/ml) Peak current (amp) Pulse on time (µs) Duty cycle (%) Gap voltage (V) Material Removal Rate (mm3/min) The ratio of volume of material removed from tool with respect to machining time. (wear weight of the tool/ wear weight of the workpiece)×100 Average surface roughness (µm)
In Table 4, experimental design is presented. There are five inputs (Cp, Ip , Ton , DC, Vg) and four outputs (MRR, TWR, EWR and ASR) in the model. Table 4. Experimental design for case study-2 [39] Cp 0 0 0 0 0 0 0 0 0 3 3 3 3 3 3 3 3 3 6 6 6 6 6 6 6 6 6
Ip 3 3 3 6 6 6 9 9 9 3 3 3 6 6 6 9 9 9 3 3 3 6 6 6 9 9 9
Ton 100 100 100 150 150 150 200 200 200 150 150 150 200 200 200 100 100 100 200 200 200 100 100 100 150 150 150
DC Vg MRR 7 30 2.564 7 40 2.649 7 50 2.735 8 30 4.529 8 40 5.47 8 50 6.666 9 30 9.401 9 40 10.256 9 50 10.94 9 30 2.735 9 40 3.076 9 50 5.475 7 30 6.666 7 40 7.222 7 50 7.435 8 30 8.511 8 40 11.829 8 50 15.947 8 30 6.239 8 40 7.435 8 50 8.376 9 30 12.82 9 40 13.076 9 50 14.017 7 30 16.153 7 40 16.692 7 50 17.0684
TWR 0.017 0.019 0.022 0.027 0.03 0.036 0.389 0.486 0.524 0.008 0.009 0.007 0.017 0.01 0.026 0.045 0.057 0.082 0.004 0.003 0.007 0.003 0.007 0.009 0.034 0.042 0.049
EWR 0.671 0.735 0.821 0.611 0.561 0.55 4.143 4.747 4.792 0.3 0.318 0.14 0.257 0.146 0.36 0.529 0.489 0.516 0.076 0.046 0.088 0.026 0.054 0.069 0.214 0.256 0.289
ASR 3.8 4.1 4.5 4.87 5.45 5.86 6.5 7.47 9.2 2.86 3.14 3.54 4.07 4.56 4.91 5.2 5.63 5.97 2.4 2.84 2.98 3.12 3.36 3.68 4.07 4.68 5.04
4. Numerical Results
RIM scores 0.570 0.479 0.319 0.571 0.451 0.272 0.561 0.441 0.308 0.577 0.488 0.361 0.587 0.489 0.366 0.598 0.526 0.422 0.596 0.513 0.431 0.623 0.546 0.444 0.638 0.526 0.491
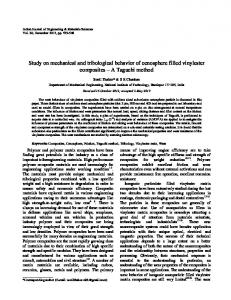
In Figure 1-2, the main effects and signal-noise ratios plots are shown. The optimum levels of spindle speed, feed per tooth and axial depth of cut are calculated as 3-3-1, respectively. Main Effects Plot (data means) for Means Spindle speed
Feed per tooth
0,52 0,50 0,48
Mean of Means
No 1 2 3 4 5 6 7 8 9 10 11 12 13 14 15 16 17 18 19 20 21 22 23 24 25 26 27
Axial depth of cut 1 2 3 1 2 3 1 2 3 1 2 3 1 2 3 1 2 3 1 2 3 1 2 3 1 2 3
0,46 0,44 1
2 Axial depth of cut
3
1
2
3
1
2
3
0,52 0,50 0,48 0,46 0,44
Figure 1. Main Effects Plots (Case study-1)
4.1. The results of case study-1 RIM model is developed for case study-1. Equal criteria weights are used. Range and reference ideal matrices are given below: AB = [27.3, 85.6, 0.468, 1.487, 384, 1820] This journal is © Advanced Technology & Science
IJISAE, 2017, 5(2), 64–69 | 66
Main Effects Plot (data means) for SN ratios Main Effects Plot (data means) for SN ratios
Feed per tooth
Cp -2
-6,5
-3
-7,0
Ip
T
-4
-7,5
Mean of SN ratios
Mean of SN ratios
Spindle speed -6,0
-8,0 1
2 Axial depth of cut
3
1
2
3
-6,0 -6,5
-5 -6 2 DC
3
1
2 Vg
3
1
2
3
1
2
3
1
2
3
-3
-7,0
-4
-7,5
-5
-8,0
1 -2
-6
1
2
3
Signal-to-noise: Larger is better
Signal-to-noise: Larger is better
Figure 2. Signal Noise ratios plots (Case study-1) Figure 4 Signal-noise ratios plots of case study-2
Comparison of the results is shown in Table 6. The results are consistent with the literature study.
Comparison of the results with literature is given in Table 8. The results are consistent with the literature study.
Table 6. Comparison of the results according to factor levels (Reference study vs. current study)
Table 7. The results of RIM for case study-2
Levels
Spindle speed
Feed per tooth
Axial depth of cut
Reference study [38]
3 (2811-2832)
3 (0.24270.2475)
1(0.3917-0.4363)
Current study
3
3
1
4.2. The results of case study-2 RIM model is developed for case study-2. Equal criteria weights are used. Range and reference ideal matrices are given below: AB = [2.564,17.0684,0.003,0.524,0.026,4.792,2.4,9.2] CD = [17.0684,17.0684,0.003,0.003,0.026,0.026,2.4,2.4] Experimental design matrix of case study-2 with RIM scores is given in Table 7. Main effects and signal noise ratios plots are presented in Figures 3-4. According to the plots, the optimum levels of factors are determined as 3-2-1-1-(1/3) for Cp, Ip, T, DC and Vg, respectively.
Main Effects Plot (data means) for Means Cp
Ip
T
Cp 1 1 1 1 1 1 1 1 1 2 2 2 2 2 2 2 2 2 3 3 3 3 3 3 3 3 3
Ip 1 1 1 2 2 2 3 3 3 1 1 1 2 2 2 3 3 3 1 1 1 2 2 2 3 3 3
T 1 1 1 2 2 2 3 3 3 2 2 2 3 3 3 1 1 1 3 3 3 1 1 1 2 2 2
DC 1 1 1 2 2 2 3 3 3 3 3 3 1 1 1 2 2 2 2 2 2 3 3 3 1 1 1
Vg 1 2 3 1 2 3 1 2 3 1 2 3 1 2 3 1 2 3 1 2 3 1 2 3 1 2 3
RIM score 0.597 0.590 0.580 0.605 0.606 0.614 0.329 0.268 0.245 0.625 0.626 0.667 0.675 0.678 0.664 0.668 0.712 0.742 0.700 0.721 0.740 0.854 0.853 0.864 0.873 0.836 0.814
0,8 0,7
Mean of Means
0,6 0,5 1
2 DC
3
1
2 Vg
3
1
2
3
1
2
3
1
2
0,8 0,7
3
Table 8. Comparison of the results according to factor levels (Reference study vs. current study) Levels Cp Ip T DC Vg Reference study [39] 3 2 1 3 3 (TOPSIS) Reference study [39] 3 1 2 1 1 (Grey Relation) 3 2 1 1 1/3 Current study
0,6
5. Conclusions
0,5
Figure 3. Main effects plots of case study-2 This journal is © Advanced Technology & Science
In this study, a new hybrid optimization model is proposed. Two different traditional/non-traditional machining optimization problems were taken from the literature as case studies. The developed model is tested using these problems. Reference Ideal IJISAE, 2017, 5(2), 64–69 | 67
scores are used to optimize Taguchi designed experiments. The obtained results show that optimum levels of cutting parameters are nearly same. The results are consistent with literature studies. The developed models are used as alternative methods in manufacturing and material selection problems in manufacturing area. These models help operators and engineers for different manufacturing process and material selection problems. It will contribute to take effective decisions in manufacturing environment. Using these models, a decision support system decision may be developed for future studies. A software may be developed for different machining optimization problems. Also, RIM may be combined with different MCDM method (AHP, ANP, Best-Worst method etc.) to test these problems.
Acknowledgement The author M. Alper SOFUOĞLU thanks TÜBİTAK for 2228-B scholarships
References [1] Rajurkar, K.P. and Ross, R.F., “The role of nontraditional manufacturing processes in future manufacturing industries”, ASME Manufacturing International, 23–37, (1992) [2] Yao, Y. L., Cheng, J. G., Rajurkar, K. P., Kovacecic, R., Feiner, S., Zhang, W., “Combined research and curriculum development of nontraditional manufacturing,” European Journal of Engineering Education, 30/3, 363-376, (2005) [3] Qian, L., Hossan, M.R., “Effect on cutting force in turning hardened tool steels with cubic boron nitride inserts,” Journal of Materials Processing Technology, 191, 274–278, (2007) [4] Thandra, S. K., and Choudhury, S. K., “Effect of cutting parameters on cutting force, surface finish and tool wear in hot machining,” International Journal of Machining and Machinability of Materials 7, 3, 260-273, (2010) [5] Lin Z.C., and Lo, S.P., “Effect of different tool flank wear lengths on the deformations of an elastic cutting tool and the machined workpiece,” International Journal of Computer Applications in Technology 25.1,30-39, (2006) [6] Saglam H., Unsacar, F. and Yaldiz, S., “Investigation of the effect of rake angle and approaching angle on main cutting force and tool tip temperature,” International Journal of Machine Tools and Manufacture 46.2,132-141, (2006) [7] Bartarya, G, and Choudhury, S. K., “Effect of cutting parameters on cutting force and surface roughness during finish hard turning AISI52100 grade steel,” Procedia CIRP 1, 651-656, (2012) [8] Yen, Y.C., Jain, Anurag and Altan, T., “A finite element analysis of orthogonal machining using different tool edge geometries,” Journal of Materials Processing Technology 146.1,72-81, (2004) [9] Benga G. C, and Abrao, A.M., “Turning of hardened 100Cr6 bearing steel with ceramic and PCBN cutting tools,” Journal of materials processing technology 143, 237-241, (2003) [10] Özel, T., Hsu, T.K. and Zeren, E., “Effects of cutting edge geometry, workpiece hardness, feed rate and cutting speed on surface roughness and forces in finish turning of hardened AISI H13 steel,” The International Journal of Advanced Manufacturing Technology 25.3-4, 262-269 ,(2005) [11] Wang, X., and Feng, C.X., “Development of empirical models for surface roughness prediction in finish turning,” The International Journal of Advanced Manufacturing Technology 20.5,348-356, (2002) [12] Chen, W.,”Cutting forces and surface finish when machining medium hardness steel using CBN tools,” International journal of machine tools and manufacture 40.3, 455-466, (2000)
This journal is © Advanced Technology & Science
[13] Arsecularatne J.A.,. Zhang L.C, Montross C., Mathew P., “On machining of hardened AISI D2 steel with PCBN tools,” Journal of Materials Processing Technology, 171.2, 244-252, (2006) [14] Mardani, A., Jusoh, A., MD Nor K., Khalifah Z., Zakwan, N. and Valipour A., “Multiple criteria decision-making techniques and their applications – a review of the literature from 2000 to 2014,” Economic Research-Ekonomska Istraživanja, 28:1, 516-571, (2015) [15] Jahan, A., Mustapha, F., Ismail, M. Y., Sapuan, S., and Bahraminasab, M., “A comprehensive VIKOR method for material selection.” Materials and Design, 32, 1215–1221, (2011) [16] Cavallini, C., Giorgetti, A., Citti, P., and Nicolaie, F., “Integral aided method for material selection based on quality function deployment and comprehensive VIKOR algorithm.” Materials and Design, 47, 27– 34, (2013) [17] Chatterjee, P., Athawale, V. M., and Chakraborty, S., “Selection of materials using compromise ranking and outranking methods.” Materials and Design, 30, 4043–4053, (2009) [18] Chatterjee, P., Athawale, V. M., and Chakraborty, S., “Materials selection using complex proportional assessment and evaluation of mixed data methods.” Materials and Design, 32, 851– 860, (2011) [19] Shanian, A., Milani, A. S., Carson, C., and Abeyaratne, R. C., “A new application of ELECTRE III and revised Simos’ procedure for group material selection under weighting uncertainty.” Knowledge-Based Systems, 21, 709–720, (2008) [20] Mayyas, A., Shen, Q., Mayyas, A., Abdelhamid, M., Shan, D., Qattawi, A., and Omar, M., “Using Quality Function Deployment and Analytical Hierarchy Process for material selection of Body-InWhite.” Materials and Design, 32, 2771–2782, (2011) [21] Streimikiene, D., Balezentis, T., Krisciukaitienė, I., and Balezentis, A., “Prioritizing sustainable electricity production technologies: MCDM approach.” Renewable and Sustainable Energy Reviews, 16, 3302–3311, (2012) [22] Chang, A.-Y., Hu, K.-J., and Hong, Y.-L., “An ISM-ANP approach to identifying key agile factors in launching a new product into mass production.” International Journal of Production Research, 51, 582– 597, (2013) [23] Bagočius, V., Zavadskas, E. K., and Turskis, Z., “Multi-criteria selection of a deep- water port in Klaipeda.” Procedia Engineering, 57, 144–148, (2013) [24] Jana, T. K., Bairagi, B., Paul, S., Sarkar, B., and Saha, J., “Dynamic Schedule execution in an agent based holonic manufacturing system.” Journal of Manufacturing Systems, 32, 801– 816, (2013). [25] Tzeng, G.-H., and Huang, C.-Y., “Combined DEMATEL technique with hybrid MCDM methods for creating the aspired intelligent global manufacturing and logistics systems.” Annals of Operations Research, 197, 159–190, (2012) [26] Yurdakul, M., “AHP as a strategic decision-making tool to justify machine tool selection.” Journal of Materials Processing Technology, 146, 365–376, (2004) [27] Buyurgan, N., and Saygin, C., “Application of the analytical hierarchy process for real-time scheduling and part routing in advanced manufacturing systems.” Journal of Manufacturing Systems, 27, 101– 110, (2008) [28] Ic, Y. T., Yurdakul, M., and Eraslan, E., “Development of a component-based machining centre selection model using AHP.” International Journal of Production Research, 50, 6489–6498, (2012) [29] Yurdakul, M. and Ic, Y. T., “Application of correlation test to criteria selection for multi criteria decision making (MCDM) models.” The International Journal of Advanced Manufacturing Technology, 40, 403–412, (2009) [30] Rahman, S., Odeyinka, H., Perera, S., and Bi, Y., “Product-cost modelling approach for the development of a decision support system for optimal roofing material selection.” Expert Systems with
IJISAE, 2017, 5(2), 64–69 | 68
Applications, 39, 6857–6871, (2012) [31] Jahan, A. and Edwards, K., “VIKOR method for material selection problems with interval numbers and target-based criteria.” Materials and Design, 47, 759–765, (2013) [32] Çalışkan, H., “Selection of boron based tribological hard coatings using multi- criteria decision making methods.” Materials and Design, 50, 742–749, (2013). [33] Chatterjee, P. and Chakraborty, S., “Material selection using preferential ranking methods.” Materials and Design, 35, 384–393, (2012) [34] Khorshidi, R.and Hassani, A., “Comparative analysis between TOPSIS and PSI methods of materials selection to achieve a desirable combination of strength and workability in Al/SiC composite.” Materials and Design, 52, 999–1010, (2013) [35] Çalışkan, H., Kurşuncu, B., Kurbanoğlu, C., and Güven, Ş. Y., “Material selection for the tool holder working under hard milling conditions using different multi criteria decision making methods.” Materials and Design, 45, 473–479, (2013) [36] Cables, E., Lamata, M.T.; Verdegay, J.L., “RIM-reference ideal method in multicriteria decision making.” Information Science, 337338, 1-10, (2016) [37] Antony, J., “Design of Experiments for Engineers and Scientists.” Elsevier, (2014) [38] Qu, S., Zhao, J.,Wang, T., “Experimental study and machining parameter optimization in milling thin-walled plates based on NSGAII,” International Journal of Advanced Manufacturing, 1-11, (2016) [39] Tripathy, S., and Tripathy, D.K., “Multi-attribute optimization of machining process parameters in powder mixed electro-discharge machining using TOPSIS and grey relational analysis,” 19, 62-70, (2016)
This journal is © Advanced Technology & Science
IJISAE, 2017, 5(2), 64–69 | 69