Water and Environmental Research Center and International Arctic Research Center, University of Alaska Fairbanks,. Fairbanks, U.S.A. L. D. Hinzman.
Ice-Wedge Polygon Type Controls Low-Gradient Watershed-Scale Hydrology A. K. Liljedahl Water and Environmental Research Center and International Arctic Research Center, University of Alaska Fairbanks, Fairbanks, U.S.A L. D. Hinzman International Arctic Research Center, University of Alaska Fairbanks, Fairbanks, U.S.A J. Schulla Hydrologic Software Consultant, Zurich, Switzerland
Abstract Ice-wedge polygons and related microtopographic variations are ubiquitous to landscapes underlain by permafrost. High- and low-centered polygons are typical but surprisingly, their role on hydrologic fluxes and stocks is not well quantified. We performed hydrologic modeling analyses using the physically-based model WaSiM-ETH that was forced by data from the Biocomplexity Experiment, Barrow, Alaska, (1999 to 2009) to assess the effect of ice-wedge polygon type on watershed-scale hydrology. Low-centered polygons, through elevated rims, reduced runoff while increasing evapotranspiration and surface water storage. The high-centered polygon landscape produced more than twice the runoff than the low-centered polygons, while storage and runoff drastically decreased. It is evident that microtopography plays an important role on the watershedscale hydrologic fluxes and stocks of low-gradient arctic wetlands. Permafrost degradation could transform low- into highcentered polygons, which could potentially dominate the direct effects of climate change on arctic wetland hydrology. Keywords: Ice-wedge polygons; watershed; hydrology; water balance. more research is needed to examine the effect of patterned ground on hydrology. This paper assesses the watershedscale hydrologic impact as a low-centered polygon landscape is transformed into high-centered polygon tundra. We evaluate the change in the basin water balance through simple modeling experiments forced by data collected at a vegetated drained thaw lake basin in Barrow, northern Alaska. The model experiments represent a first approximation in assessing the effects of ice-wedge polygon type on watershed hydrology as we did not include the effects of frozen ground on hydraulic conductivity and subsurface storage capacity.
Introduction Wetlands are common across the pan-arctic landscape (Tarnocai and Zoltai 1988) and their unique geomorphological and hydrologic features are important components of the tundra ecosystem (Walker et al. 2004) and the global climate system (Chapin et al. 2005). Landforms associated with arctic wetlands, such as vegetated drained thaw lakes and patterned ground may play an important role in basin hydrology (Kane et al. 2003). It has been proposed that not accounting for the role of tundra micro-scale heterogeneity could lead to large uncertainty in regional estimates of carbon and energy exchange (Sellers et al. 1997, Ostendorf et al. 2001). Changes to the surface topography of Arctic wetlands can be abrupt and easily initiated. Despite the cold and continuous permafrost in Northern Alaska, Jorgenson et al. (2006) documented a wide-spread degradation of ice wedges occurring over a decadal time scale of moderate climate warming (2 to 5 ºC). Further, Fortier et al. (2007) demonstrated that in just four summers, infiltration of snowmelt runoff into ice-wedge cracks can result in a continuous system of gullies through thermo-erosion. Thus, in a relatively short time period, a low-centered polygon landscape can turn into a high-centered polygon landscape due to melting of ice-wedges. Projected effects on the tundra ecosystem may not have properly accounted for the dynamic control of geomorphology under a changed climate (Ellis and Rocherfort 2004). Considering that a) a substantial portion of the Pan-Arctic landscape is represented by polygon mires (250 000 km2) (Minke et al. 2007) with b) dynamic lowand high-centered polygons, and c) that the air temperature and precipitation is projected to increase (Walsh 2008),
Background In the field of geocryology, the term polygon refers to closed, multisided, roughly equidimensional patterned ground features, bounded by more or less straight sides (van Everdingen 1998). The two major types of ice-wedge polygons are low-centered and high-centered polygons. Both these features strongly influence the hydrologic, pedological, and biological variations in low-land tundra (Brown et al. 1980)including meter-scale variations in nearsurface soil moisture (Engstrom et al. 2005), plant distribution (Webber 1978), snow accumulation (Webber et al. 1980), active layer depth (Minke et al. 2009), soil biological activity (Mueller et al. 1999), and the export of natural chlorine and bromine to the stratosphere (Teh et al. 2009). Even though the tundra wetlands may at first appear as a featureless plain, its typical polygonal landforms result in a highly variable and dynamic environment. The mosaic in surface hydrology results in extensive spatial variations in soil respiration (Sommerkorn 2008) and net ecosystem carbon fluxes (Olivas et al. 2011). Basins of low-centered polygons are either temporary or continuously 1
A. K. Liljedahl et al. flooded during the summer (Liljedahl 2011). High-centered polygons are well drained with the troughs often serving as effective pathways for the movement of water and nutrients, especially during snowmelt (Woo and Guan 2006). Rims of the low-centered polygons and centers of the high-centered polygons are both exposed to summer and winter climate extremes (Brown et al. 1980). A topographic reversal of a low-centered polygon into the formation of troughs and thus, eventually a well-drained high-centered polygon, can therefore have major implications for ecosystem structure and functioning. Field studies have shown complex micro- and watershedscale lateral hydrologic connectivity of arctic wetlands. Widespread flooding (Rovansek et al. 1996) allows effective surface flow connectivity during freshets (Woo and Guan 2006). In summer, the shallower thaw in combination with a higher ground surface of low-centered polygon rims form ridges of frozen ground (Minke et al. 2007), which can serve as hydrologic barriers (Donner 2007). Accordingly, the threshold water level that allows for a subsurface lateral connection varies in time due to the seasonal development of the active layer. Adding to the complexity is the advective heat transfer, where lateral flow can produce pathways within these barriers (Donner 2007). Such thermal erosion is an effective positive feedback mechanism that results in further lowering of the threshold water levels. Thus, hydrologic fluxes and stocks are intrinsically and dynamically linked to the unique tundra microtopographic units. Still, the role of low- and highcentered polygonal ground on watershed-scale water balance is poorly constrained and rarely, if ever, represented in hydrologic models.
2
Mosses represent most of the live above ground biomass at the site (Zona et al. 2009). Vascular plant composition is represented by sedges (Carex aquatilis) and grasses (Eriophorum and Dupontia) with an average LAI in midAugust 2006 of 0.43, 0.13 and 0.02, respectively (Zona et al. 2011). Senescence in the region begins in August (Myers and Pitelka 1979).
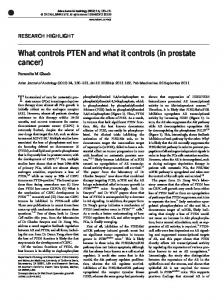
Methods Schematic DEMs The effect of polygon rims on the water balance was quantified using three artificially produced DEMs (Fig. 1). The artificial DEM represent a simplistic DTLB by having the same slope (0.03 %) as the DTLB at the Biocomplexity Experiment, Barrow, Alaska (Liljedahl 2011). Airborne Lidar and field surveys of the Barrow DTLB show lowcentered polygon rims up to about 10 cm height. Accordingly, low-centered polygon rims were represented by a network of elevated pixels (+ 8 cm) within the schematic DTLB. A second schematic DEM represents the DTLB as a featureless surface, while the third presents a DTLB having high-centered polygons and a connected network of 30 cm deep troughs.
Site Description The site, here referred to as the Biocomplexity Experiment, (71°16'51"N 156°35'47"W, elevation 4.5 m) is located a few kilometers from the Beaufort Sea near Barrow on the Arctic Coastal Plain, Northern Alaska. Mean annual air temperature at Barrow Airport is –12.0 °C (1977-2009) where summer (June through August) averages 3.3 °C. About 55 % of the annual precipitation (173 mm, 19772009) falls during June through September (99 mm) and represents adjusted precipitation following the WMO method described by Yang et al. (1998). The Biocomplexity Experiment site is largely represented by a vegetated drained thaw lake basin (DTLB). DTLB occupy approximately 26 % of the western Arctic Coastal Plain (Hinkel et al. 2005) and 50 % of the Barrow Peninsula north of ~71° latitude (Hinkel et al. 2003). The site has poorly drained wet tundra meadow with Typic Aquiturbels soils (Bockheim et al. 1999) underlain by 600 m of ice-rich permafrost (Brown and Johnson 1965). Low-centered polygons are common within the lake bed, while highcentered polygons dominate the upland tundra. Interannual variation of the mean active layer depth at nearby locations varied from 29 to 35 cm (1995-2009) (Shiklomanov et al. 2010).
Fig. 1. The schematic digital elevation models used in the modeling analysis representing low-centered polygons with 8 cm high rims, a flat surface, and high-centered polygons with 30 cm deep troughs. The surface has a general slope of 0.03 % as determined by airborne Lidar surveys of a vegetated drained lake basin near Barrow, Alaska.
Hydrologic model We chose the physically-based hydrologic model Water Balance Simulation Model (WaSiM-ETH) (Schulla 1997, Schulla and Jasper 2007). WaSiM-ETH is a well established tool for modeling the spatial and temporal variability of hydrologic processes in complex basins ranging from less than 1 km2 to more than 500,000 km2. Its application has ranged from water management in arid and semi-arid regions (Bharati et al. 2008), flood forecasting (Jasper et al. 2002), water balance analyses of wetlands within lowland floodplains (Krause et al. 2007) and in the Arctic (Liljedahl 2011), to the distribution of water and phosphorus yieldproducing areas (Lindenschmidt et al. 2004) and many other hydrologic studies. The WaSiM-ETH includes the Richards-equation to represent the fluxes within the unsaturated soil zone. It is a 1-D finite difference scheme with multiple user-defined
A. K. Liljedahl et al.
Results The polygon rims affect several components of the water balance. The multi-week long ponding (hydroperiod) of the DTLB was only replicated when low-centered polygons were represented (Fig. 2). When no elevated rims were present, the hydroperiod was limited to 5.2 (flat) and 0 days
(high-centered) compared to 36 days in the low-centered polygon scenario. The mean inundated depth at lowcentered polygons was 40 mm compared to 11 mm at the flat scenario. Water levels were higher throughout the summer in the low-centered polygon DTLB, where the absence of rims resulted in larger soil water storage deficits prior to freeze-up. In five of the 11 years, the ground surface was inundated prior to freeze-up in the low-centered polygon scenario, while the fall water table was always below the ground surface in late summer during the flat and high-centered polygon ground. The change in soil water storage, ΔS, was negligible on a decadal time scale but year to year variations were found in all three scenarios.
Cumulative evapotranpiration (mm)
Cumulative runoff (mm)
200
Low-centered Flat High-centered
Mean Mean Mean
100
96 mm 56 mm 55 mm
0 200 160 mm 156 mm 116 mm
100
0 20
Water table (cm)
discrete soil layers. Here, the infiltration into the soils was presented as if the soils were thawed. The lower boundary condition to the unsaturated zone is the groundwater layer (i.e. saturated zone), which is constant for a specific time step but variable in time. The extraction of water from the different soil layers is done separately for soil evaporation and for transpiration before calculating the soil water fluxes. The first step is the extraction through transpiration (Penman-Monteith), which includes stress induced by soil moisture. The second step is the extraction of soil evaporation from bare soil (or moss), which is also linked to soil moisture status. The modeling of the groundwater and lateral flow is 2-D where the flux is estimated from the continuity and Darcy equations through an implicit finite difference approach (Gauss-Seidel-Algorithm with automatic estimation of successive over relaxation factors). Lateral flow is represented through channel routing (Manning-Strickler), base flow, interflow, and a surface routing module designed for small-scale applications. Infiltration excess and direct runoff from snow melt is used as input for the surface routing model. The surface runoff flow from cell-to-cell until a river cell is reached. In diverging areas, up to three flow paths are possible, while only one flow direction is allowed in converging areas (the steepest slope). The flow velocity depends on slope, roughness and water film depth (Manning-Strickler) where the slope depends upon the elevation model plus the water storage. The dynamic generation of ponds occurs when elevation and local storage leads to a zero or inverted gradient. The time step of surface routing is dynamically decreased, but if necessary, it can also be parameterized. Two different approaches were applied to represent surface flow. We utilized the surface routing module in the low-centered polygon and flat ground scenarios, while the troughs were parameterized as a channel network in the high-centered polygon landscape. WaSiM-ETH was forced with 11 summers of hourly meteorological data collected near Barrow, Alaska, by the Center for Climate Change at San Diego State University, Circumpolar Active Layer Monitoring program, NOAA, ARM, and the National Weather Service. The model simulations were started just prior to each year’s snow ablation and stopped during the onset of winter. The latter was defined as being the first day of ten consecutive days experiencing mean daily air temperatures below 0 ºC. In this particular application we did not represent the seasonal changes in the active layer nor the presence of permafrost. Instead, the model sensitivity analysis is solely based upon the change DEM and surface routing parameterization. Model parameters were given the same values as those presented by Liljedahl (2011).
3
0 cm
0
-6 cm
-20 -35 cm
-40 -60 1-Apr
29-Apr
27-May
24-Jun
22-Jul
19-Aug
16-Sep
14-Oct
Fig. 2. Simulated water table and cumulative runoff and evapotranspiration from the three schematic DEM’s. Thin lines represent individual years, while thick lines are the long-term average. The mean runoff was about twice as high from the highcentered polygons compared to the low-centered polygons and the flat wetland. Evapotranspiration and soil water storage was reduced at the high-centered polygon. The typically observed multi-week long ponding was only produced by the low-centered DEM.
Despite the larger soil water storage deficit, total runoff was higher in the high-centered polygon (96 mm) than the flat (53 mm) and low-centered polygon (49 mm) scenarios. The runoff ratio (runoff/SWE) was nearly doubled from the high-centered polygons (0.83) compared to the low-centered and flat basins (0.44 and 0.47, respectively). Total evapotranspiration was reduced when troughs were present and also less variable amongst years. The flat and the low-centered polygon scenario had nearly identical evapotranspiration losses (156 and 160 mm, respectively), while the high-centered polygon area lost on average 116 mm. Total transpiration was the same amongst the scenarios (mean 55 mm). Accordingly, the role of transpiration on total evapotranspiration was increased during the highcentered polygon scenario (47 % of total evapotranspiration) compared to the low-centered (34 %).
A. K. Liljedahl et al.
Discussion Micro-scale variations in surface topography, induced by ice-wedge polygons, control the water balance in these extremely low-gradient arctic watersheds. A transition from low- to high-centered polygon landscape resulted in a dramatic alteration in the partitioning of the water balance. Overall, losses from the low-centered polygon scenario were dominated by evapotranspiration but total runoff was similar to evapotranspiration at the high-centered polygon landscape. We show that structural changes in the arctic soils at the order of cm can have dramatic effects on the watershed-scale hydrology. Soil and surface water storage The near-surface was typically saturated when rims were present. Autumn water table fluctuated above and below the ground surface amongst the years in the low-centered polygon scenario, while the fall water table of high-centered polygons always remains at depths where one would normally expect the permafrost table (see Shiklomanov et al. 2010). In that sense, the water table of high-centered polygons was less variable by supporting a consistently deep water table. The 11 years of simulations suggest that it is typical for these systems, whether they are dominated by low- or highcentered polygons, to experience interannual variations in the soil water storage, ΔS. Annual water balance calculations based on assumptions of no change in ΔS would, according to the simulations, result in errors of up to 90 mm, which is half of the long-term mean annual precipitation in the Barrow area. Our simulations suggest that such methods should only be applied to datasets representing approximately a decade. Lateral flow The type of polygon feature affects the total discharge as well as the timing of the runoff. About half of the SWE did not contribute to streamflow from the low-centered polygon (56 %) and flat wetland (53 %). The limited difference was due to the larger soil water storage deficit (fall water table depth) at the flat scenario, which was of similar magnitude as the surface storage capacity of the low-centered polygons. The high-centered polygon scenario resulted in 27 % of the SWE recharging the soils. In comparison, field studies performed by Kane et al. (2008) showed that on average 22 % (1999-2007) of the SWE did not contribute to runoff in the Putuligayuk River watershed (471 km2), Arctic Coastal Plain, Alaska. In addition, the simulated runoff exits the basin earlier from the high-centered polygon scenario due to an effective network of channels and steeper microtopographical gradients when compared to the other scenarios. Runoff is therefore not only drastically reduced and evaporation increased due to the presence of largerscale features such as lakes and wetlands (Bowling and Lettenmaier 2010) but also due to micro-scale features such as the presence of rims and the absence of a connected network of troughs and short, relatively steep slopes typical of high-centered polygons.
4
The high-centered polygon scenario represented an extreme scenario of the basin-scale lateral surface connectivity through the unified drainage network. Field observations have shown that the ground subsidence may not necessarily form a continuous network but rather disconnected channels and therefore small water bodies (Jorgenson et al., 2006). Vertical fluxes Total evapotranspiration from the high-centered polygon scenario was similar to the total amount of runoff. This is partly due to a larger runoff compared to flat and lowcentered scenarios but also due to reduced evaporation. Open water/moss evaporation was lower from the highcentered polygons as the surface was water-limited due to the deeper water tables (~ 30 cm). The simulated water table in the flat scenario rarely dropped below 10 cm depth, which was within the parameterized zone of water accessible for evaporation (Sphagnum moss has shown to effectively transport water from 10-15 cm deep water table through capillary flow (Price et al. 2009)). Hence, the position of the water table resulted in similar total evapotranspiration amongst the flat and low-centered polygon scenario, while reduced at the high-centered polygons. Future directions The modeling analysis presented a first-order approach in simulating the role of low- and high-centered polygons on arctic wetland hydrology. Neither the freeze-thaw dynamics within the active layer nor the permafrost were represented, both which have shown to be important in tundra wetland hydrology. Consequently, the modeling did not include the differential distribution of lateral and vertical hydrologic barriers caused by the presence of ice-rich frozen ground. In addition, the trough network was continuous. Therefore, both the lateral hydrologic connectivity and the (liquid) soil water storage were likely overestimated, which suggest an overall underestimation in surface water storage. A representation of frozen ground would likely result in an increased hydrologic sensitivity to polygon type, although any disconnected channels (troughs) could partly offset the differences between ice-wedge polygon type on watershedscale fluxes and stocks.
Conclusions The model experiments presented a first order approach in evaluating the role of microtopography on watershedscale hydrology. A shift from low-centered to high-centered polygon dominated landscape results in drastic changes to watershed-scale water storage, runoff, and evapotranspiration. Low-centered polygons promote extensive ponding, while high-centered polygons enhance runoff. Evapotranspiration is suppressed at high-centered polygon landscapes as the near-surface soil moisture is reduced. Therefore, not accounting for the role of microtopographical variability on hydrology can have dramatic consequences when estimating regional scale water and energy exchange. It is necessary to account for
A. K. Liljedahl et al. the microtopography and the dynamic role of geomorphology in regulating tundra microclimate in order to reduce the uncertainty in present and future pan-Arctic hydrologic fluxes and stocks.
Acknowledgments The Atmospheric Radiation Measurement Program provided radiation measurements. B. Cable and J. Long provided technical assistance. Financial support for this research was provided through the National Science Foundation (grants 0652838, 0632263, and 0421588), and student grants from the Swedish-America Foundation, Gemzeus Foundation, American Water Resources Association-Alaska Section, and the Center for Global Change and Arctic System Research.
References Bharati, L., Rodgers, C., Erdenberger, T., Plotnikova, M., Shumilov, S., Vlek, P., & Martin, N. 2008. Integration of economic and hydrologic models: Exploring conjuctive irrigation water use strategies in the Volta Basin. Agr. Water Manag. 95: 925-936. Bockheim, J.G., Everett, L.R., Hinkel, K. M., Nelson, F.E., & Brown, J. 1999. Soil organic carbon storage and distribution in arctic tundra, Barrow, Alaska. Soil Sci. Soc. Am. J. 63: 934-940. Bowling, L.C., & Lettenmaier, D.P., 2010. Modeling the effects of lakes and wetlands on the water balance of arctic environments. J. Hydrometeorol. 11(2): 276295. doi: 10.1175/2009JHM1084.1 Brown, J., & Johnson, P.L., 1965. Pedo-ecological investigations at Barrow, Alaska. Tech. Rep., 159:32, 32 pp., US Army CRREL, Hanover, USA. Brown, J., Everett, K.R., Webber, P.J., MacLean, S.F., & Murray, D.F., 1980. The coastal tundra at Barrow, in An arctic ecosystem: the coastal tundra at Barrow, Alaska, editors Brown, J., Tieszen, P.C., and Bunnell, F.L., pp. 1-29, Dowden, Hutchinson and Ross Inc., Stroudsburg, PA. Chapin III, F.S., Sturm, M., Serreze, M.C., McFadden, J.P., Key, J.R., Lloyd, A.H., McGuire, A.D., Rupp, T.S., Lynch, A.H., Schimel, J.P., Beringer, J., Chapman, W.L., Epstein, H.E., Euskirchen, E.S., Hinzman, L.D., Jia, G., Ping, C.-L., Tape, K.D., Thompson, C.D.C., Walker, D.A., & Welker J.M. 2005. Role of land-surface changes in arctic summer warming. Science 310: 657-660. Donner, N. 2007. Hydrological windows in low-centered arctic polygons: A landscape ecological perspective on polygon mires. M.S. thesis, Greifswald University, Germany. Ellis, C.J., & Rochefort, L., 2004. Century-scale development of polygon-patterned tundra wetland, Bylot Island (73° N, 80° W). Ecol. 85(4): 963-978. Engstrom, R., Hope, A., Kwon, H., Stow, D., & Zamolodchikov, D. 2005. Spatial distribution of near surface soil moisture and its relationship to
5
microtopography in the Alaskan Arctic coastal plain, Nordic Hydrol. 36(3): 219-234. Fortier, D., Allard, M., & Shur, Y., 2007. Observation of rapid drainage system development by thermal erosion of ice wedges on Bylot Island, Canadian Arctic Archipelago. Permafrost and Periglac. Process. 18: 229-243 Hinkel K.M., Eisner, W.R., Bockheim, J.G., Nelson, F.E., Peterson, K.M., & Dai, X. 2003. Spatial extent, age, and carbon stocks in drained thaw lake basins on the Barrow Peninsula, Alaska. Arctic, Antarctic, and Alpine Res. 35: 291-300. Hinkel, K.M., Frohn, R.C., Nelson, F.E., Eisner, W.R., & Beck, R.A., 2005. Morphometric and spatial analysis of thaw lakes and drained lake basins in the western Arctic Coastal Plain, Alaska, Permafrost Periglacial. 16(4): 327-341. Jasper, K., Gurtz, J., & Lang, H., 2002. Advanced flood forecasting in Alpine watershed by coupling meteorological observations and forecasts with a distributed hydrological model, J. Hydrol. 327: 4052. Jorgenson, M.T., Shur, Y.L., & Pullman, E.R., 2006. Abrupt increase in permafrost degradation in Arctic Alaska, Geophys. Res. Lett., 33, L02503, doi:10.1029/2005GL024960. Kane, D.L., Gieck, R.E., & Bowling, L.C., 2003. Impacts of surficial permafrost landforms on surface hydrology. In Proceedings of the Eight International Conference on Permafrost, edited by Phillips, Springman and Anderson, pp. 507-511, Balkema Publishers, Zurich, Switzerland. Kane, D.L., Gieck, R.E., & Hinzman, L.D., 2008. Water balance for a low-gradient watershed in Northern Alaska. In Proceedings Ninth International Conference on Permafrost, edited by D. L. Kane and K. M. Hinkel, University of Alaska Press, Fairbanks, AK. Krause, S., Jacobs, J. & Bronstert, A., 2007. Modelling the impacts of land-use and drainage density on the water balance of a lowland-floodplain landscape in northeast Germany. Ecol. Modell. 200: 475-492. Liljedahl, A. K. 2011. The hydrologic regime at sub-arctic and arctic watersheds: present and projected. PhD Dissertation, University of Alaska, Fairbanks, AK. Lindenschmidt, K.-E., Ollesch, G., & Rode, M., 2004. Physically-based hydrological modeling for nonpoint dissolved phosphorous transport in small and medium sized river basins. Hydrol. Sci. J. 49(3): 495510. Minke, M., Donner, N., Karpov, N., De Klerk, P., & Joosten, H., 2007. Distribution, diversity, development and dynamics of polygons mires: Examples from Northeast Yakutia (Siberia). Peatlands Int. 1: 36–40. Minke, M., Donner, N., Karpov, N., De Klerk, P., & Joosten H., 2009. Patterns in vegetation composition, surface height and thaw depth in polygon mires in the Yakutian Arctic (NE Siberia): A microtopographical
A. K. Liljedahl et al. characterization of the active layer. Perm. Perigl. Process. 20: 357-368. Mueller, G., Broll, G., & Tarnocai, C., 1999. Biological activity as influenced by microtopography in a cryosolic soils, Baffin Island, Canada. Perm. Periglac. Process. 10: 279-288. Myers, J. P., & Pitelka, F.A., 1979. Variations in summer temperature patterns near Barrow, Alaska: Analysis and ecological interpretation. Arct. Alp. Res. 11: 131-144. Olivas, P. C., Oberbauer, S., & Kuchy, A., 2011. Effects of fine-scale topography on CO2 flux components of Alaskan Coastal Plain Tundra: Response to contrasting growing seasons. Arctic, Antarctic, and Alpine Res. 43(2): 256-266. Ostendorf, B., Hilbert, D. W., Kostner, B., Tappeiner, U., & Tasser, E., 2001. The importance of understanding spatial pattern for scaling up plot-level matter and energy fluxes to regional scales. Syst. Analys. Model. Sim. 41(3): 391-408. Price, J., Edwards, T.W.D., Yi, Y., & Whittington, P.N., 2009. Physical and isotopic characterization of evaporation from Sphagnum moss. J. Hydrol. 369: 175-182. Rovansek, R.J., Hinzman, L.D., & Kane D.L., 1996. Hydrology of a tundra wetland complex on the Alaskan Arctic Coastal Plain, U.S.A. Arctic, Alp Res. 28(3): 311-317. Schulla, J., 1997. Hydrologische Modellierung von Flussgebieten zur Abschatzung der Folgen von Klimaanderungen (Hydrological modelling of river basins for estimating the effects of climate change). Zurcher Geographische Schriften 69, ETH Zurich, Switzerland. Schulla, J., & Jasper, K., 2007. Model description WaSiMETH, Internal Report. Institute for Atmospheric and Climate Science, ETH Zurich, Switzerland. Sellers, P.J., Heiser, M.D., Hall, F.G., Verma, S.B., Desjardins, R.L., Schuepp, P.M., & MacPherson, J.I., 1997. The impact of using area-averaged land surface properties - topography, vegetation condition, soil wetness - in calculations of intermediate scale (approximately 10 km2) surface-atmosphere heat and moisture fluxes. J. Hydrol. 190:269-301. Shiklomanov, N.I., Streletskiy, D.A., Nelson, F.E., Hollister, R.D., Romanovsky, V.E., Tweedie, C.E., & Brown, J., 2010. Decadal variations of active-layer thickness in moisture-controlled landscapes, Barrow, Alaska. J. of Geophys. Res. doi:10.1029/2009JG001248. Sommerkorn, M., 2008. Micro-topographic patterns unravel controls of soil water and temperature on soil respiration in three Siberian tundra systems. Soil Biol. Biochem. 40: 1792-1802, doi:10.1016/j.soilbio. 2008.03.002. Tarnocai, C., 2006. The effects of climate change on carbon in Canadian peatlands. Global Plan. Ch., 53, 222– 232.
6
Tarnocai, C., & Zoltai, S.C., 1988. Wetlands of Arctic Canada. In Wetlands of Canada. Ecological Land Classification Series No. 24., pp. 29-53, Environment Canada and Polysciences Publications Inc., Montreal, Canada. Teh, Y. A., Mazeas, O., Artwood, A.R. Abel, T., & Rhew R.C., 2009. Hydrologic regulation of gross methyl chloride and methyl bromide uptake from Alaskan Arctic tundra. Glob. Ch. Biol. 15: 330-345, doi: 10.1111/j.1365-2486.2008.01749.x. van Everdingen, R.O., 1998. Multilanguage glossary of permafrost and related ground-ice terms, International Permafrost Association, The Arctic Institute of North America, Calgary, Canada. Walker, D.A., Epstein, H.E., Gould, W.A., Kelley, A.M., Kade, A.N., Knudson, J.A., Krantz, W.B., Michaelson, G., Peterson, R.A., Ping, C.-L., Raynolds, M.K., Romanovsky, V.E., & Shur, Y., 2004. Frost-boil ecosystems: Complex interactions between landforms, soils, vegetation and climate. Perm. Periglac. Process. 15: 171-188. Walsh, J.E., 2008. Climate of the Arctic Marine Environment. Ecol. App. 18(2): 3-22. Webber, P.J., 1978. Spatial and temporal variation of the vegetation and its productivity. In Vegetation and Production Ecology of an Alaskan Arctic Tundra, edited by L.L. Tieszen, pp. 37-112, Springer-Verlag, New York, NY. Webber, P.J., Miller, P.C., Chapin III, F.S., & McCown, B.H., 1980. The vegetation: Pattern and succession, in An arctic ecosystem: the coastal tundra at Barrow, Alaska, edited by J. Brown et al., pp. 30-56, Dowden, Hutchinson and Ross Inc., Stroudsburg, PA. Woo, M.-K., & Guan, X.J., 2006. Hydrological Connectivity and Seasonal Storage Change of Tundra Ponds in a Polar Oasis Environment, Canadian High Arctic, Perm. Perigl. Process. 17: 309-323. Zona, D., Oechel, W.C., Peterson, K.M., Clements, R.J., Paw, K.T., & Ustin, S.L., 2009. Characterization of the carbon fluxes of a vegetated drained lake basin chronosequence on the Alaskan Arctic Coastal Plain. Global. Ch. Biol. doi: 10:1111/j.13652486.2009.02107.x Zona, D., Oechel, W.C., Richards, J.H., Hastings, S., Kopetz, I., Ikawa, H., & Oberbauer, S., 2011. Light stress avoidance mechanisms. In Sphagnum dominated wet coastal Arctic tundra ecosystem in Alaska, Ecology 92(3): 633-644.