Advances in Computer Science and Information Technology (ACSIT) p-ISSN: 2393-9907; e-ISSN: 2393-9915; Volume 3, Issue 3; April-June, 2016, pp. 157-162 © Krishi Sanskriti Publications http://www.krishisanskriti.org/Publication.html
Image Classification using Data Mining Techniques Santosh Kumar Dash1 and Mrutyunjaya Panda2 1
M.Tech Student, Department of Computer Science Utkal University, Bhubaneswar, India 2 Reader, Department of Computer Science Utkal University, Bhubaneswar, India E-mail:
[email protected],
[email protected]
Abstract—Data Mining and Knowledge Discovery is an emerging field of research that have been attracting many researchers to extract meaningful pieces of information from the dataset. Image Analysis and Knowledge Discovery from an Image is also taking the front position in both Data Mining and Image Analysis area. In this paper, we use three very popular data mining techniques such as: Naive Bayes, Decision tress(J48) and Random Forest algorithm on various images, freely available on the Internet for our analysis. The images are: medical image, satellite image, and scenery image. Experiments are conducted for a Normal image at first with the above three algorithms followed by a noisy one by applying Gaussian noise to it and then a Kuwahara filtering process at the second to check the effectiveness of the model. From the experimental results, it is observed that Random Forest algorithm outperforms the others in getting best classification accuracy. Keywords: Image, Data Mining, Gaussian noise, Kuwahara Filter, Accuracy.
1. INTRODUCTION Image classification is taken as growing field of both computer vision and data mining. The Classification bridges the huge gap between pixels and unskilled computers. We all know computer vision is the field of acquiring, processing, analyzing and understanding images which are later used for knowledge discovery from high-dimensional image data. Knowledge discovery is also important because it gives a basic model for selection, preprocessing, transformation, data mining and interpretation of datasets [20]. Here, experiments are performed on features extracted from different image data sets and then, efficient Data mining technique is applied for image classification. In our daily life, we are taking billions of images such as satellite images, medical images, scenery images and so on. We are also uploading those images on social websites such as YouTube, Facebook, Twiter, Instagram, etc. It is now very complex and critical task for data science engineers and researchers to obtain the meaningful information from massive data sets. The Internet is now the biggest platform for collecting images. From those Internet-based image data sets, we can use data mining tools and efficient algorithms for getting meaningful information.
Motivation: Image data classification is one of the evolving areas, and many researchers have been working on this particular field. Image mining and classification can be applied effectively to different areas such as Human computer Interaction, computer vision [18], cloud computing, machine learning and so on. This motivates us to explore data mining techniques on images for efficient classification. Objective: The objective of the paper is to address the following:
Feature extraction from various images Region of Interest (ROI) calculation Application of Data Mining techniques for classification
2. RELATED WORK The author discusses about a framework to classify a satellite Image based on nearest clustering algorithm [5]. Here, the algorithm is applied on testing data set to get confusion matrix and also applied on satellite images to generate a thematic map as output. The accuracy assessment has been done using confusion matrix and kappa coefficient. In [8], authors have shown interest in image data mining using medical data. Here they have taken C4.5 classification algorithm and Random Forest Tree classification algorithm. They reported 100 percent classification accuracy on SPECTF Heart, Orthopedic (Vertebral Column) ailments, Thyroid and Dermatology infection datasets while Binary Logistic Regression and CSMC4 also give 100 percent classifier accuracy on the SPECTF Heart Dataset and Multinomial Logistic Regression too classifies the Dermatology dataset with 100 Percent accuracy. In [15], Land slide image data is taken for data mining purpose. Vegetation Index and the thresholds are of each attribute on target categories. A conventional approach, C4.5 Decision Tree Analysis, is used as a comparison. And it helps to analyze the landslide problems and thus facilitates the informed decision-making process. The author discuses on classification using machine learning algorithm on Hepatitis-C
Santosh Kumar Dash and Mrutyunjaya Panda
158
virus detected image [16]. Here, 15 binary attributes together with a class attribute and five continuous attributes. The dataset contains 155 records and it is three stage based. Overall the result has been collected with 89% accurate classification. The author discuses on effective use of frequent item set mining for image classification [4]. They have proposed a new and effective scheme for applying frequent item set mining to image classification tasks. They refer to the new set of obtained patterns as frequent local histograms or FLHs, they pay special attention to keeping all local histograms information during the mining process and to select the most relevant reduced set of FLH patterns for classification. In [11], comparison is based on traditional Classification tree results to stochastic gradient boosting for three remote sensing based data sets, an IKONOS image from the Sierra Nevada Mountains of California, a Probe-1 hyperspectral image from the Virginia City mining district of Montana, and a series of Landsat images from the Greater Yellowstone Ecosystem. Here, SGB has shown overall accuracy of IKONOS classification from 84% to 95% and the probe-1 classification from 83% to 93%. The Authors discuss on “Diagnosis of Lung Cancer Prediction System Using Data Mining Classification Techniques” [10]. Here, they have used Naïve Bayes classifier and naive creedal classifier. By using generic lung cancer symptoms such as age, sex, wheezing, shortness of breath, pain, on shoulder, chest, and arm, they have taken this type of data set for prediction using data mining algorithms. Here, authors have written article on feature selection and then they review its developments with the growth of data mining [14]. They review FSDM and the papers of FSDM10, which shows vibrant research field of some contemporary interests, new applications, and ongoing research efforts
3.2. Scenery Image Fig. [2] is taken from wallpaper HD website. This is the picture of river house scenery which is situated in Switzerland [17].
Fig. 2. Scenery Image
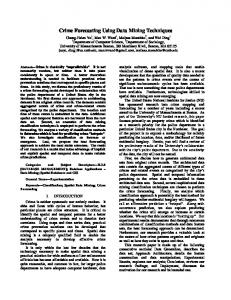
3.3. Satellite Image Fig. [3] shows the common volcanic activity in the Vanuatu archipelago- a chain of islands east of northern Australia in the South Pacific Ocean. On April 25, 2015, the Operational Land Imager (OLI) on Landsat 8 [19] acquired this image of a plume from Ambrym, an active volcanic island of Vanuatu.
3. IMAGE DATA SET USED This section provides some idea about images taken for our analysis. 3.1. Cancer Image This picture Fig. [1] is taken from Pharmaceutical Journal [9]. Pharmaceutical Journal is one of the best Journals which provide a platform for pharmacists and pharmaceutical scientists throughout the world.
Fig. 3: Satellite Image
3.4. Specification of Images Table 1 presents the detailed specifications obtained from Fig. 1, Fig. 2 and Fig. 3, for cancer, scenery and Satellite image respectively; according to their size, pixels and color models. Fig. 1: Cancer Image
Advances in Computer Science and Information Technology (ACSIT) p-ISSN: 2393-9907; e-ISSN: 2393-9915; Volume 3, Issue 3; April-June, 2016
Image Classification using Data Mining Techniques
159
Table 1: Specification of images SL No 1 2 3
Name
Size
Pixels
Cancer Image Scenery Image Satellite Image
859KB 1.3MB 2.1MB
580*379 720*450 900*600
Color Model
RGB RGB RGB
4. PROPOSED METHODLOGY
Scenery
Blank Region
41
52
117
108
Non-cancerous Region Vegetation
265
273
121
79
1
73
143
151
Houses
342
189
126
102
Water
127
275
124
122
Sky
223
12
105
78
Volcanic
480
244
148
67
45
346
128
79
2990
4
120
70
The proposed methodology adopted in this paper is shown in Fig. 4.
Satellite Land Water
Here all types of ROI are rectangular in nature. So there are four different types paramenter of ROI such as are x-axis, yaxis, w-width and h-height of the class. Fig. 4: Experimental Model
For all image analysis, we have three images such as: Normal image, normal image corrupted by Gaussian noise and noisy image applied to a filter.The normal image is taken for training the model and the other two : noisy and filtered images are taken for testing . At first, the whole normal image is taken as both for training and testing the image classification model. Secondly, we have added random noise to the normal image. The noise is generally Gaussian distributed with a mean zero and standard deviation of 25. This is considered as a testing image for experiment 2.
Fig. 4. Normal Image
For experiment 3, we have used Kuwahara [1] non- liner smoothing filter with different sampling window width for different noisy images obtained after adding Gaussian noise to the normal image. The advantages of the Kuwahara filter is its ability to reduce adaptive noise and performs smoothing in the picture while preserving the edges. 4.1 Region of Interest (ROI) The Region of Interest (ROI) used for image classiifcation is highlighted in Table 2 against each. Table 2: Specification on Region of interest (ROI) co-ordinates Image ROI/ Class xywhAxis Axis Width height Fig. 5. Noisy Image Cancer
Cancer Region
301
43
183
195
Advances in Computer Science and Information Technology (ACSIT) p-ISSN: 2393-9907; e-ISSN: 2393-9915; Volume 3, Issue 3; April-June, 2016
Santosh Kumar Dash and Mrutyunjaya Panda
160
Fig. 6. Filtered Image Fig. [4-6]. Cancer image classes shown in colors
Fig. 10. Normal Image
Fig. 11. Noisy Image Fig. 7. Normal Image
Fig. 8. Noisy Image
Fig. 12. Filtered Image Fig. [10-12]. Satellite image classes shown in colors
From the cancer image, total 105 attributes and 57880 instances formed. From scenery image, total 105 attributes with 57763 instances created. And finally in the case of satellite total, 105 attributes with 28438 instances formed.
Fig. 9. Filtered Image Fig. [7-9]. Scenery image classes shown in colors
The regions of interests (ROI) are obtained as shown in above Fig. s. In Fig. 5, Fig. 6 and Fig. 7, the red color shows cancer region, the green color shows non-cancerous region and purple color shows blank region. Here, blank region indicates out the breast region in the image. In Fig. 8, Fig. 9 and Fig. 10, the red color shows vegetation region, the green color shows house region, the purple color shows water region and the yellow color shows sky region. In Fig. 11, Fig. 12 and Fig. 13, the red
Advances in Computer Science and Information Technology (ACSIT) p-ISSN: 2393-9907; e-ISSN: 2393-9915; Volume 3, Issue 3; April-June, 2016
Image Classification using Data Mining Techniques
color shows volcanic region, the green color shows land region and the purple color shows water region. Then, the relevant files features are exported then applied to the classifiers for obtaining classifier accuracy and root mean square error (RMSE). 4.2. Classifiers Used
5. EXPERIMENTAL RESULTS AND DISCUSSION All the experiments are carried out in Intel core i3 2 GHz processor with 1 TB HDD, 4 GB RAM, Windows 10 Operating system. Here, Fiji [7] image analysis tool is used for our experiment with Data mining application in java environment [6] Various experimental results obtained in terms of classification accuracy and RMSE (root mean square error) with the following conditions are provided in Table 3 and Table 4. i) The features are extracted from the training set. Here, an original image is used for training and testing in order to build the classifier model. ii) The features are extracted from the original image are used for training while the features obtained after applying Gaussian noise to the original image is taken for testing the model. iii) The features extracted from original image is taken for training and the features obtained after applying Kuwahara Filter [1] to the noisy image taken for testing the model. From Table 3, it can be observed that Random Forest algorithm gives better accuracy in comparison to others for Cancer image; J48 is better in scenery image in comparison to others and for satellite image, Random forest is better for normal and filtered image, Naïve Bayes is better for noisy image. Similarly, From Table 4, Random forest algorithm provided low RMSE for cancer image for all conditions while better only in cases of noisy and filtered Scenery images and satellite image. This makes us to conclude that Random forest algorithm is a suitable choice for the image classification techniques under study here.
Cancer Image Scenery
Image Satellite Image
Table 3: Accuracy in Percentage Image Naïve J48 Type Bayes 92.17 99.86 Normal 71.38 69.84 Noisy 71.95 72.99 Filtered 99.35 99.99 Normal 56.55 73.74 Noisy
Random Forest 99.98 79.35 80.48 70.95 73.32
Filtered Normal Noisy Filtered
74.40 97.76 58.85 61.33
83.95 99.99 34.90 35.18
75.37 100 53.97 65.99
Table 4: Root Mean Square Error Images
Here, three different classifiers are used for our experiments such as: Decision Tree (J48) [13], Naïve Bayes [14] and Random Forest [3].
Images
161
Cancer Image Scenery Image Satellite Image
Image Type
Naïve Bayes
J48
Random Forest
Normal Noisy Filtered Normal Noisy Filtered Normal Noisy Filtered
0.216 0.4351 0.4282 0.4564 0.465 0.3564 0.1205 0.5229 0.5073
0.0264 0.4484 0.4372 0.0059 0.3623 0.2832 0.0069 0.6588 0.6574
0.0258 0.2918 0.2827 0.4382 0.3227 0.2391 0.0099 0.3593 0.3371
6. CONCLUSION AND FUTURE WORK In this paper, Decision tree, Naïve Byes and random forest data mining techniques are applied to classify the region of interest from images in order to get the meaning ful observations. The filtered image enhances the classification accuracy in comparison to the noisy ones for all images taken into considerations. However, in order to get more accurate results, more filtering options with large scale images are to be considered in future. REFERENCES [1] Bartyzel, K. 2015. Adaptive Kuwahara filter. Signal, Image and Video Processing. (2015), 1–8. [2] Borges, L.C., Marques, V.M. and Bernardino, J. 2013. Comparison of Data Mining Techniques and Tools for Data Classification. Proceedings of the International C* Conference on Computer Science and Software Engineering (Porto, Portugal, 2013), 113–116. [3] Breiman, L. 2001. Random forests. Machine learning. 45, 1 (2001), 5–32. [4] Fernando, B., Fromont, E. and Tuytelaars, T. 2012. Effective use of frequent itemset mining for image classification. Computer Vision–ECCV 2012. Springer. 214–227. [5] Goswami, A.K., Sharma, S. and Kumar, P. Nearest Clustering Algorithm for Satellite Image Classification in Remote Sensing Applications. [6] Hall, M., Frank, E., Holmes, G., Pfahringer, B., Reutemann, P. and Witten, I.H. 2009. The WEKA data mining software: an update. ACM SIGKDD explorations newsletter. 11, 1 (2009), 10–18. [7] Ignacio Arganda-Carreras, J.S. Albert Cardona Verena Kaynig 2011. Trainable Weka Segmentation (Fiji). [8] Jacob, S.G. and Ramani, R.G. 2012. Mining of Classification Patterns in Clinical Data Through Data Mining Algorithms. Proceedings of the International Conference on Advances in Computing, Communications and Informatics (Chennai, India, 2012), 997–1003.
Advances in Computer Science and Information Technology (ACSIT) p-ISSN: 2393-9907; e-ISSN: 2393-9915; Volume 3, Issue 3; April-June, 2016
Santosh Kumar Dash and Mrutyunjaya Panda
162
[9] Journal, P. Breast Cancer Image, http://www.pharmaceuticaljournal.com. [10] Krishnaiah, V., Narsimha, D.G. and Chandra, D.N.S. 2013. Diagnosis of lung cancer prediction system using data mining classification techniques. International Journal of Computer Science and Information Technologies. 4, 1 (2013), 39–45. [11] Lawrence, R., Bunn, A., Powell, S. and Zambon, M. 2004. Classification of remotely sensed imagery using stochastic gradient boosting as a refinement of classification tree analysis. Remote sensing of environment. 90, 3 (2004), 331–336. [12] Liu, H., Motoda, H., Setiono, R. and Zhao, Z. 2010. Feature Selection: An Ever Evolving Frontier in Data Mining. FSDM. 10, (2010), 4–13. [13] Quinlan, J.R. 2014. C4. 5: programs for machine learning. Elsevier. [14] Rish, I. 2001. An empirical study of the naive Bayes classifier. IJCAI 2001 workshop on empirical methods in artificial intelligence (2001), 41–46. [15] Wan, S., Lei, Tc. and Chou, Ty. 2010. A novel data mining technique of analysis and classification for landslide problems. Natural hazards. 52, 1 (2010), 211–230. [16] Yasin, H., Jilani, T.A. and Danish, M. 2011. Hepatitis-C classification using data mining techniques. International Journal of Computer Applications. 24, 3 (2011), 1–6. [17] River House Bern Switzerland Scenery Wallpaper, www.wallpaperhd.pk. [18] Grabner, H. and Bischof, H. 2006. On-line boosting and vision. Computer Vision and Pattern Recognition, 2006 IEEE Computer Society Conference on (2006), 260–267. [19] Ambrym Volcano, P. from 2015. www.landsat.visibleearth.nasa.gov [20] Fayyad, Usama, Gregory Piatetsky-Shapiro, and Padhraic Smyth."From data mining to knowledge discovery in databases." AI magazine 17.3 (1996): 37.
Advances in Computer Science and Information Technology (ACSIT) p-ISSN: 2393-9907; e-ISSN: 2393-9915; Volume 3, Issue 3; April-June, 2016