Implementation and Evaluation of Network Intrusion Detection Systems Monis Akhlaq1, Faeiz Alserhani1, Irfan Awan1,2, John Mellor1, Andrea J. Cullen1, and Abdullah Al-Dhelaan2 1
Informatics Research Institute, University of Bradford, Bradford, BD7 1DP, United Kingdom {m.akhlaq2,f.m.f.alserhani,i.u.awan, j.e.mellor,a.j.cullen}@bradford.ac.uk 2 Computer Science, KSU Saudi Arabia
[email protected]
Abstract. Performance evaluation of Network Intrusion Detection Systems (NIDS) has been carried out to identify its limitations in high speed environment. This has been done by employing evasive and avoidance strategies simulating real-life normal and attack traffic flows on a sophisticated Test-Bench. Snort, an open source Intrusion Detection System, has been selected as an evaluation platform. In this paper, Snort has been evaluated on host and virtual configurations using different operating systems and hardware implementations. Evaluation methodology is based on the concept of stressing the system by injecting various traffic loads (packet sizes, bandwidth and attack signatures) and analyzing its packet handling and detection capacity. We have observed few performance issues with Snort which has resulted into packet drop and low detection rate. Finally, we have analyzed the factors responsible for it and have recommended techniques to improve systems packet handling and detection capability. Keywords: Host platform, Network Intrusion Detection Systems (NIDS), operating systems (OS), packet drop, performance evaluation, Snort, Traffic, virtual platform.
1 Introduction The recent era has witnessed a tremendous increase in the usage of computer network applications. The rapid inception of these systems in almost every circle of our life has made them attractive target to malicious activities. In response, various techniques have been designed to ensure security and stability of these systems among them Network Intrusion Detection Systems (NIDS) has gained substantial importance. NIDS are designed to prevent intrusion into a computer system or a network by providing information on a hostile activity that may have incurred to challenge1 Security Attributes. Intrusion Detection Systems (IDS) of any type (host based or network 1
Security Attributes: Confidentiality, Integrity, Privacy and Non Repudiation of data exchanged in a computer network.
D. Kouvatsos (Ed.): Next Generation Internet, LNCS 5233, pp. 988–1016, 2011. © Springer-Verlag Berlin Heidelberg 2011
Implementation and Evaluation of Network Intrusion Detection Systems
989
based) operate via network or system users. They can also be controlled via sensors configured to report suspected activity back to the central system or administrator. IDS generally fall into two key categories: anomaly-based (behaviour-based) and signature-based (knowledge-based) [1]. Today, variety of open source and commercial NIDS are available, this can be said that the NIDS has established their importance, however; their performance remains a debatable issue. Anomaly-based IDS apply various application logics to determine the network threats. They work by establishing a “normal” profile for a system or a network and later generating alerts by observing the deviations from this norm. Signature-based IDS use predefined attack signatures to detect threats and generate alerts. The signature definitions represent known system and network vulnerabilities, for example specific viruses/worms or known patterns of malicious activity like log file editing etc. These systems need continuous update and evaluation by IDS vendors or administrators [2]. A typical scenario of employing NIDS in a network is its implementation on the server with minimum active services. This set-up is quite susceptible to insider attacks especially in high speed environments. The current NIDS are also threatened by resource crunch attempts such as Distributed Denial of Service (DDoS) attacks which has increased from few megabits in the year 2000 to 40 Gbps in 2010 [3]. The performance criteria of NIDS demands that every single packet (header and payload) passing through the network need to be evaluated with the same link speed; however the massive increase in speed and throughput has generated performance issues. Sending a large amount of traffic or using computationally expensive techniques like fragmentation can also compromise NIDS and force it to start dropping the packets. NIDS can be implemented as software-based or hardware-based. Software-based NIDS are more configurable, easy to update and require less maintenance; however their performance is quite slow. On the other hand, hardware-based NIDS can handle a large volume of traffic. They are expensive, require more maintenance and are hard to update. The choice between the two is a trade-off between cost and performance. We have felt a need to investigate the performance of software-based systems in current day high speed conditions using different implementations scenarios. Quite few efforts have also been made to measure the performance of NIDS. Most of the evaluation methodologies are based on testing the IDS in a moderate traffic conditions. Furthermore, some of these approaches have used previously saved data sets instead of real-time traffic which looks quite unrealistic. The actual performance of the systems was gauged under limited conditions and under a simulated non realistic network flow. The results obtained during these investigations could not portray actual performance output of NIDS. We have endeavored to evaluate the system on realistic network conditions providing NIDS different levels of hardware support in order to analyze its performance more practically. The recent development of multi-core systems has also added few more opportunities to deploy software-based system; these shall also be investigated in this paper. The aim of our work is to provide the answers to the following questions: •
Is it possible to deploy the current software-based NIDS such as Snort [4] at rate more than 500 Mbps using commodity hard-ware? Also to identify the limits of incoming traffic, a system can handle effectively in terms of packet loss.
990
• •
M. Akhlaq et al.
Is the use of different operating systems (OS) (in normal desktop and server machines), hardware resource (single and multi-core processors) and configurations (host and virtual) affect the NIDS performance? Do the software-based NIDS can catch up with the advancement in network speed once implemented on normal hardware or there is no space for softwarebased NIDS anymore?
Our research has focused on signature-based IDS with an emphasis on evaluating its performance in high-speed traffic conditions. We have selected Snort [4] as a test platform because of its popularity and status as a de-facto IDS standard. We are confident that the results obtained in this research would also be applicable to other IDS available in the market. The test environments selected for the research has a significant edge over [5] and our results develop a new understanding of IDS performance limitations. Our evaluation methodology is based on the concept of analyzing the system capacity in terms of its packet handling capability by implementing it into different hardware configurations and testing platforms. We have achieved this by establishing three different Test-Benches where every setup has been assigned specific evaluation task. Test-Bench I implements the Snort on mid range commodity hardware (limited processing power and system memory). The results obtained on this platform describe the efficacy of NIDS implementation at this level. The Test-Bench II and III utilize high range commodity hardware built on Intel Xeon Dual Quad-Core processor using 4.0 GB RAM. These Test-Benches analyzed the system performance on host and virtual configurations, respectively. We have also analyzed the system capability by observing its response to known attacks in Test-Bench I; however this criterion has not been considered for other Test-Benches. This paper is organized into sections. Section 2 gives an overview of Snort. Sections 3, 4 & 5 describe Test-Benches I, II and III respectively. Section 6 presents the analysis of results obtained and finally in Section 7 few solutions are recommended to improve the performance of the system in high speed conditions. Conclusions follow in Section 8. Finally, a list of acronyms can be found in Appendix I and string matching algorithms are revised in Appendix II.
2 Overview of Snort Open source software has gained tremendous popularity and acceptance among academia and research community. Apart from being free of cost there are several other qualities which has made them popular. Few advantages of open source software are access to source code, detailed documentation and online forum to discuss implementation and operational issues. This research has focused on a widely accepted open source software tool, Snort which has received great acceptance in the IDS market. Snort is capable of performing real-time traffic analysis and packet logging on the network. It performs protocol analysis and can detect variety of network threats by using content/ signature matching algorithms. Snort can be configured as a packet sniffer, packet logger and NIDS. As packet sniffer, it reads the packets off the network and in a packet logger mode, it logs packets to the storage device. NIDS mode enables the Snort to analyze the network traffic against set of defined rules in order to detect intrusion threats.
Implementation and Evaluation of Network Intrusion Detection Systems
Input
Packet Sniffer
Preprocessor
991
Detection Engine Logging Alert Rules
Plug-Ins
Packet Matching
Yes No
Discard
Fig. 1. Snort Architecture
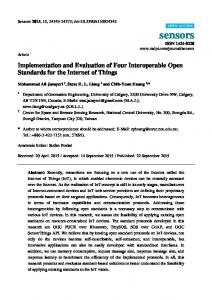
Snort architecture consists of four basic components: sniffer, pre-processor, detection-engine and output as shown in Fig. 1. In its most basic form, Snort is a packet sniffer. However, it is designed to receive packets and process them through its preprocessors. A pre-processor takes the raw packets and evaluates them against certain plug-ins for example the RPC (Remote Procedure Call) plug-in, Hypertext Transfer Protocol (HTTP) plug-in, etc. The plug-ins check for certain types of behaviour by undertaking packet inspection. Once the packet is determined to have a particular “behaviour”, it is then sent to the detection engine. Snort handles many kinds of preprocessors and their affiliated plug-ins, including IP fragmentation handling, port scanning and flow control. It also includes analysis of richly featured protocols such as the HTTPinspect pre-processor handles etc [6]. Snort being a signature based IDS uses rules to check for hostile packets in the network. Rules are sets of requirements used to generate an alert and have a particular syntax. For example, one rule that checks for peer-to-peer file sharing services looks for the string “GET” in connection to the service running on any port other than Transport Control Protocol (TCP) port 80. If a packet matches the rule, an alert is generated. Once an alert is triggered, the alert can be sent to multiple places such as a log file, a database or generates a Simple Network Management Protocol (SNMP) trap [7]. On successful detection of a hostile attempt, the detection engine sends an alert to a log file through a network connection into the required storage (output) [6]. Snort can also be used as Intrusion Prevention System (IPS) [6]. Snort 2.3.0 RC1 integrated this facility via Snort-inline into the official Snort project [4]. The main objective of Snort and other NIDS is to effectively analyze all packets passing through the network without any loss. The performance of majority of running applications depends upon memory and processing power. In the context of NIDS, this performance dependency includes Network Interface Cards (NIC), Input and Output (I//O) disk speed and OS. In recent years, technologies have advanced in both hardware and software domains, multi-core systems have been introduced to offer powerful processing functionality also software are progressing well in providing more functionalities. Snort, which was developed in early 1990’s, doesn’t support multi-threading. Detection engine component of Snort represent the critical part, where pattern matching function is performed. Recent Virtual Resource Tree (VRT) rules library contains more
992
M. Akhlaq et al.
than 8000 rules; this augments the need of an effective pattern matcher. Snort is using three different pattern matching algorithms: Aho-Corasick, modified Wu-Manber and low memory key-word trie (lowmem) [6,8]. Further details of these algorithms can be found in Appendix II. Modifications have been made in these algorithms to analyze their performances. We have conducted memory usage and performance comparison tests on different pattern matching algorithms and the results are shown in Table 1. This can be concluded that the pattern matching component of IDS is a major hurdle in the performance issues once related to system hardware. Quite significant amount of memory is utilized to match approximately 8000 rules in a noticeable time. Table 1. Performance Measurements – Pattern Matching Algorithms Algorithms (8,296 Rules) Aho-Corasick (full) [6] Aho-Corasick (sparse) [6] Aho-Corasick (std) [6] Wu-Manber [8] Wu-Manber (low) [8]
Memory usage Mega Bytes (MB) 640 240 1080 130 75
Packet processing time(seconds) 620 714 665 635 655
3 Test-Bench I The network is composed of six machines using Pro-Curve Series 2900 switch [9] as shown in Fig. 2 and it is similar to that adopted in [10]. The Test-Bench I comprises a number of high performance PCs running open source tools to generate background traffic, run attack signatures and monitor network performance. Traffic Generation Hosts
PC 2
PC 1 Win XP SP2
Win XP SP 2
Win XP SP2
Win XP SP2 Attacking Hosts
Receiving Hosts
Linux 2.6
Linux 2.6
Win XP SP2 Virtual Platform
Win XP SP 2
Snort on Hosts Platform
Fig. 2. Test-Bench I
Virtual Platform
Implementation and Evaluation of Network Intrusion Detection Systems
993
The hardware description of the network is shown in Table 2. The network components are described below. Table 2. Network Description- Test-Bench 1 Machine Type
Hardware Description
Network traffic/ back
Dell Precision T3400, Intel Quad-Core, Q6600 2.40 Traffic Generators: NetCPS [10],
Tools Used
ground traffic generator
GHz. 2 GB RAM,
(Win XP SP2)
Card (Broadcom NetXtremo Gigabit Ethernet).
PCIe, IGbps RJ45, Network Tfgen [11], Http Traffic Gen [12], LAN Trrafic Version 2 [13] and D-ITG Version 2.6 [14]
Network ground
traffic/ traffic
back Dell Precision T3400, Intel Quad-Core, Q6600 2.40 Traffic Generators: D-ITG
generator GHz. 2 GB RAM, PCIe, IGbpss RJ45, Network Version 2.6 [14] and hping
(Linux 2.6)
Card (Broadcom NetXtremo Gigabit Ethernet).
Attack Machine
Dell Precision T3400, Intel Quad-Core, Q6600 2.40 Attack Traffic Generator:
• Win XP SP2
GHz. 2 GB RAM,
• Linux 2.6
Card (Broadcom NetXtremo Gigabit Ethernet).
IDS Machines
Dell Precision T3400, Intel Quad-Core, Q6600 2.40 • IDS:Snort [4], Traffic Monitor:
• Snort – Win XP SP2
GHz. 2 GB RAM, PCIe, IGb/s RJ45, Network Card Bandwidth Monitor [17] on Win
• Snort – Linux 2.6
(Broadcom NetXtremo Gigabit Ethernet).
Version 2 [15]
PCIe, IGbps RJ45, Network Metasploit framework [16]
XP SP2 • IDS:Snort and Traffic Monitor: nload [18] on Linux 2.6.
Switch
ProCurve Series 2900 [9], 10Gbps switch with 24x1 Gbps ports and 2x10 Gbps 3CR17762-91-UK ports.
3.1 Traffic Generators Two machines are configured to generate network traffic on Windows XP SP 2 [20] and Linux 2.6 [21] respectively as shown in Fig. 2. Distribution of network traffic is TCP (70%), User Datagram Protocol (UDP) (20%) and Internet Control Message Protocol (ICMP) (10%). 3.2 Attacking Host Two machines are configured to generate attacks/ exploits on Windows XP SP 2 and Linux 2.6 as shown in Fig. 2. 3.3 IDS Machine (Snort) In the Test-Bench I, Snort is operated on both host and virtual machines for both Windows and Linux platforms. This has been done to analyze the performance of Snort using the limited resources of a virtual machine and also with the full processing capability of host computer. We have selected Snort version 2.8.3 [4] for evaluation. Snort was also tested for its accuracy on the different OS platforms (Windows XP SP2 & Linux 2.6). The platforms were tested by injecting a mixture of heavy network traffic and scripted attacks through the Snort host. Snort.conf file in its default
994
M. Akhlaq et al.
configuration was selected for evaluation. The performance of Snort was also been evaluated under the following variant conditions: • • •
Generating attacks from different operating system hosts. Varying traffic payload, protocol and attack traffic in different scenarios, named as Alpha, Bravo, Charlie, Delta and Echo (as shown in Table 3). Subjecting it to hardware constraints of virtual machine configurations. Table 3. Test-Bench Scenarios Network Traffic Network Traffic
Attack Traffic
IDS: Snort
Scenario
Generator PC1
Generator PC2
Generator – Metasploit
Alpha
Host Win XP SP2
Host Win XP SP2
Host Linux 2.6
Virtual Win XP SP2
Bravo
Host Win XP SP2
Host Win XP SP2
Host Linux 2.6
Virtual Linux 2.6
Charlie
Host Win XP SP2
Host Win XP SP2
Host Linux 2.6
Host Win XP SP2
Delta
Host Win XP SP2
Host Win XP SP2
Host Linux 2.6
Host Linux 2.6
Echo
Host Win XP SP2
Host Win XP SP2
Host Win XP SP2
Host Linux 2.6
3.4 Results Snort was evaluated on the basis of network traffic that ranged from 100 Mbps to 1.0 Gbps (divided into five different test scenarios). The other parameters selected for evaluation include network utilization, CPU usage and Snort CPU usage. Snort performance in terms of packets analyzed, packets dropped, alerts/ log and detection status have also been considered for critical evaluation. 3.4.1 Scenario Alpha Snort was configured to run using performance limiting configuration of a Windows XP SP 2 virtual machine. The results obtained are shown in Fig. 3. It was subjected to heavy background traffic and attack exploits (from a well resourced Linux host). They demonstrate that the performance of Snort deteriorates markedly as network traffic load increases. 3.4.2 Scenario Bravo Snort was configured to run using the performance-limiting configuration of a Linux virtual machine and the attacker is a well resourced Linux host. The results obtained, as shown in Fig. 4 identify the similar performance limitations as found in scenario alpha. However, an improvement can be observed when Snort runs on the same operating system as that of the attacking host. 3.4.3 Scenario Charlie Snort was configured to run using a well-resourced Windows platform and the attacker on a Linux host. The results obtained are shown in Fig. 5. Snort performance
Implementation and Evaluation of Network Intrusion Detection Systems
995
declines as a result of being run on a different operating system platform to the attacker. However, an improvement can be observed in comparison to the equivalent virtual scenario. 3.4.4 Scenario Delta Snort and the attacker both configured using well resourced Linux platform as hosts. The results obtained are shown in Fig. 6. Comparatively an improved performance for Snort can be observed in this scenario as both attacker and Snort are using same OS (Linux).
Attack Platform: Host Linux 2.6 vs Snort Platform: Virtual Windows Parameter
100 – 200 Mbps
500 – 700 Mbps
800 Mbps – 1.0 Gbps
Network Utilization
12 %
56%
90% 95 – 100%
CPU Usage
50 – 70%
90 – 100%
Snort CPU Usage
40 – 50%
80 – 90%
90-98%
Packets Analysed
72.5%
66%
38 %
Packets Dropped
27.5%
34%
62 %
Alerts & Log
100%
75%
20%
100 80 100-200 Mbps
60 40
500-700 Mbps
20 0
800Mbps - 1.0 Gbps Network CPU Usage Snort CPU Packets Utilization Usage Analysed
Packets Dropped
Alerts & Log
Fig. 3. Results – Scenario Alpha
Attack Platform: Host Linux 2.6 vs Snort Platform: Virtual Linux 2.6 Parameter
100 – 200 Mbps
500 – 700 Mbps
800 Mbps – 1.0 Gbps
Network Utilization
12 %
54 %
90%
CPU Usage
50 – 70%
88 - 95%
90 – 100%
Snort CPU Usage
40 – 50%
75 - 85%
90-95%
Packets Analysed
75 %
62 %
45%
Packets Dropped
25 %
38 %
55 %
Alerts & Log
100%
50 %
30 %
100 80 60
200 - 400 Mbps
40
500 - 700 Mbps
20
800 MBPS - 1.0 Gbps
0 Network CPU Usage Snort CPU Packets Utilization Usage Analysed
Packets Dropped
Alers & Logged
Fig. 4. Results – Scenario Bravo
996
M. Akhlaq et al.
Attack Platform: Host Linux 2.6 vs Snort Platform: Host Windows Parameter
100 – 200 Mbps
500 – 700 Mbps
800 Mbps – 1.0 Gbps
Network Utilization
13%
53%
90%
CPU Usage
20 – 30%
30 - 35%
35 – 40%
Snort CPU Usage
15 – 20%
20 - 25%
25-30%
Packets Analysed
98.2 %
38 %
27 %
Packets Dropped
1.8 %
62 %
73 %
Alerts & Log
100%
50 %
20 %
100 80 60
200 - 400 Mbps
40
500 - 700 Mbps 800 Mbps - 1.0 Gbps
20
Column1
0 Network CPU Usage Snort CPU Packets Utilization Usage Analysed
Packets Dropped
Alerts & Log
Fig. 5. Results – Scenario Charlie
Attack Platform: Host Linux 2.6 vs Snort Platform: Host Linux 2.6 Parameter
100 – 200 Mbps
500 – 700 Mbps
800 Mbps – 1.0 Gbps
Network Utilization
21%
55%
95%
CPU Usage
18 – 25%
29 - 36%
38 – 43%
Snort CPU Usage
15 – 20%
22 - 27%
29-36%
Packets Analysed
98.5%
47 %
32 %
Packets Dropped
1.5%
53 %
68 %
Alerts & Log
100%
50 %
30 %
100 80 60
200 - 400 Mbps
40
500 - 700 Mbps
20
800 Mbps - 1.0 Gbps
0 Network CPU Usage Snort CPU Packets Utilization Usage Analysed
Packets Dropped
Alerts & Log
Fig. 6. Results – Scenario Delta
3.4.5 Scenario Echo Snort is configured to run on a well-resourced Linux platform and the attacker on a Windows host as shown in Fig. 7. Similar results to those in scenario Charlie obtained, where the operating system platform used Snort and attacker are reversed.
Implementation and Evaluation of Network Intrusion Detection Systems
997
Attack Platform: Host Windows vs Snort Platform: Host Linux 2.6 Parameter
100 – 200 Mbps
500 – 700 Mbps
800 Mbps – 1.0 Gbps
Network Utilization
15%
54 %
96%
CPU Usage
25 – 30%
32 - 35%
38 – 45 %
Snort CPU Usage
18 – 22%
22 - 26%
27-35%
Packets Analysed
99 %
42 %
35 %
Packets Dropped
1%
58 %
65 %
Alerts & Log
100%
60 %
30 %
100 80 60
200 - 400 Mbps
40
500-700 Mbps
20
800Mbps - 1.0 Gbps
0 Network CPU Usage Snort CPU Packets Utilization Usage Analysed
Packets Dropped
Alerts & Log
Fig. 7. Results – Scenario Echo
4 Test-Bench II Fig. 8 describes the Test-Bench II that Snort has been implemented on a fully resourceful host machine built on dual quad core processor using 4.0 Gb RAM, the configuration of the network machines are shown in Table 4. Snort been respectively evaluated on the fully resourceful platforms built on Windows Server 2008 [22], Linux Server 2.6 and Free Berkley Software Distribution (BSD) 7.0 [23] respectively. Traffic Generation Hosts
Win XP SP2
Linux 2.6
Win XP SP2
Win XP SP2 Attacking Hosts
Receiving Hosts
Linux 2.6
Linux 2.6
Win XP SP2
Linux 2.6
Free BSD 7.0
Respective Snort Hosts
Fig. 8. Test-Bench II
998
M. Akhlaq et al. Table 4. Network Description- Test-Benches II and III Machine Type
Hardware Description
Network traffic/ back
Dell Precision T3400, Intel Quad-Core, Q6600 2.40 Traffic Generators: NetCPS [10],
ground traffic generator
GHz. 2 GB RAM,
(Win XP SP2)
Card (Broadcom NetXtremo Gigabit Ethernet), L2 [12], LAN Trrafic Version 2 [13]
PCIe, IGbps RJ45, Network Tfgen [11], Http Traffic Gen
cache 2 x 4.0 MB, FSB 1066 MHz. Network
traffic/
Tools Used
and D-ITG Version 2.6 [14]
back Dell Precision T3400, Intel Quad-Core, Q6600 2.40 Traffic Generators: D-ITG
ground traffic generator
GHz. 2 GB RAM,
(Linux 2.6)
Card (Broadcom NetXtremo Gigabit Ethernet), L2 Version 2 [15]
PCIe, IGbps RJ45, Network Version 2.6 [14] and hping
Cache 2 x 4.0 MB, FSB 1066 MHz.
IDS Machine
Dell Precision T5400, Intel Xeon Dual Quad-Core IDS: Snort [4] 2.0 GHz, 4 GB RAM, L2 cache 2x6MB, FSB 1066 MHz,
PCIe, Network Interface Card, 10 Gbps
Chelsio, HD: 1000 GB, Buffer 32 MB, SATA. Receiving Hosts
Dell Precision T3400, Intel Quad-Core, Q6600 2.40 • Win XP SP2 – LAN Traffic
• Win XP SP2
GHz. 2 GB RAM, PCIe, IGb/s RJ45, NIC 10 Gbps Generator
• Linux 2.6
Chelsio on Win XP SP2 host and Linux 2.6 host has • Linux 2.6 – D-ITG Traffic
Switch
ProCurve Series 2900 [9], 10Gbps switch with 24x1 Gbps ports and 2x10 Gbps
Broadcom NetXtremo Gigabit Ethernet.
Generator
3CR17762-91-UK ports.
The system performance is gauged in terms of its packet handling capacity of the application built on respective platforms for different types of network traffic. 4.1 Evaluation Methodology 4.1.1 UDP Traffic The evaluation methodology is based on the following specifications: • • • •
Different packet sizes (128, 256, 512, 1024 and 1514 bytes) were generated and Snort’s performance at the following traffic-load was evaluated: 750 Mbps, 1.0 Gbps, 1.5 Gbps and 2.0 Gbps respectively. Varying traffic payload: UDP and Mixed TCP, UDP and ICMP Traffic. Snort’s performance characteristics were evaluated - packets received, packets analysed, packets dropped and CPU usage at various packet sizes and band widths levels. Duration of test: 1, 5 and 10 minutes, we have taken the average value of the results obtained.
The response of the IDS System (Snort) on UDP traffic injected in various packet sizes and bandwidths is shown in Table 5; each scenario is discussed in following paragraphs: 4.1.2 Mixed Traffic The mixture of TCP (70%), UDP (20%) and ICMP (10%) traffic was generated replicating realistic network flow as follows:
Implementation and Evaluation of Network Intrusion Detection Systems
• • •
999
Generating random packet sizes and observing the response of system – packet handling capacity. Traffic bandwidth limited to 1.0 Gbps – supporting commodity hard-ware on account of system implementation as a Test-Bench. Recording packet drop statistics in all three Snort platforms built on Free BSD, Linux and windows respectively. Table 5. Host-based Configuration Results – UDP Traffic (Packet loss %) Traffic (Bandwidth) 750 Mbps
1 Gbps
1.5 Gbps
2 Gbps
OS Free BSD Linux Windows Free BSD Linux Windows Free BSD Linux Windows Free BSD Linux
128 Bytes 15.40 56.91 51.76 52.60 72.70 68.05 66.70 77.60 80.60 74.07 78.04
256 Bytes 9.450 52.67 50.62 32.15 69.04 66.82 62.03 71.50 74.70 69.80 75.80
512 Bytes 3.29 27.83 25.32 28.40 65.88 61.97 46.22 67.32 70.23 65.30 69.60
1024 Bytes 6.64 6.72 6.83 25.04 55.26 53.60 41.60 57.10 68.31 50.54 59.30
1514 Bytes 6.26 6.40 6.35 24.89 53.35 52.90 40.80 55.50 64.60 49.40 57.30
4.2 Results 4.2.1 UDP Traffic – 750 Mbps Performance of all operating systems linearly improved from smaller packet size (128 Bytes) to larger one (1514 Bytes); however Free BSD shows a significant edge over the others in all ranges of packet sizes as shown in Fig. 9.
Fig. 9. Results: Packet Dropped (%), UDP Traffic – 750 Mbps
4.2.2 UDP Traffic – 1.0 Gbps Increase in the bandwidth shows decline in the performance of system result into more packet loss as shown in Fig. 10. Considerably uniform response has been
1000
M. Akhlaq et al.
Fig. 10. Results: Packets Dropped (%), UDP Traffic – 1.0 Gbps
observed in all categories of packet sizes from all platforms tested respectively. This scenario also showed a comparatively improved performance from Free BSD however not an ideal one. 4.2.3 UDP Traffic – 1.5 Gbps A further increase in the traffic bandwidth result into more packet loss by the system. Approximately similar performance was observed in all packet sizes, the response indicates Free BSD performed better followed by Linux and Windows at last as shown in Fig. 11.
Fig. 11. Results: Packets Dropped (%), UDP Traffic – 1.5 Gbps
4.2.4 UDP Traffic – 2.0 Gbps At 2.0 Gbps of traffic input, performance of Windows seemed totally compromised at 128 Bytes of packet sizes, the platform lost approximately all the input traffic and performed no evaluation. It gradually increased for higher packet sizes, in a similar pattern as observed for the lower traffic bandwidths. This, however; displayed a highly compromised performance from all platforms identifying the strong limitations
Implementation and Evaluation of Network Intrusion Detection Systems
1001
Fig. 12. Results: Packets Dropped (%), UDP Traffic – 2.0 Gbps
to handle the input traffic reaching 2.0 Gbps as shown in Fig. 12. Practically, the system build on Free BSD, Linux and Windows platforms once subjected to 2.0 Gbps of input traffic suffer heavy packet loss. 4.2.5 Mixed Traffic The main reason to conduct this test is to ascertain the performance of system in realistic network conditions. The results here also followed quite similar pattern of system response. Table 6 describes the results obtained, Free BSD showed quite good performance in terms of handling mixed traffic for the bandwidth of 1.0 Gbps on a multi-core implementation. Table 6. Host-based Configuration Results – Mixed Traffic Operating System FreeBSD Linux Windows
Dropped Packets 21.7 % 27.2 % 26.3 %
5 Test-Bench III Virtualization is a framework for abstracting the resources of a PC into multiple execution platforms by creating multiple machines on a single computer. Each machine operates on the allocated hardware and can afford multiple instances of applications [24]. This concept has been successfully incepted within the industry/ business community. The mechanics of system virtualization to implement network security tools has been considered as an appropriate choice for academia dealing with information security [25, 26]. The concept has been developed to address the issues related to reliability, security, cost and complexity of the network/systems. It has successfully been used for the processing of legacy applications, ensuring load balancing requirements, resource sharing and tasking among virtual machines by using autonomic computing techniques. The technique has also shown merits in the situation where an application failure on one
1002
M. Akhlaq et al.
Traffic Generation Hosts
Win XP SP2
Linux 2.6
Win XP SP2
Win XP SP2 Attacking Hosts
Receiving Hosts
Linux 2.6
Linux 2.6 Virtual Platform – Win Sever 2008
Win XP SP2
Linux 2.6
Free BSD07.0
Snort on Virtual Hosts
Fig. 13. Test-Bench III
machine does not affect the other. In addition, ease of isolation allows multiple OS platforms to be built on one machine running variable instances of applications. This has made the concept quite fascinating for the research community. As discussed in [10], the Test-bench III is distributed into three parts and configured around a ProCurve series 2900 switch [9] as shown in Fig. 13. The basic idea of the evaluation process revolves around packet capturing and evaluation by virtual platforms and Snort. We have selected two machines for traffic generation: Linux 2.6 and Windows XP SP2 platforms respectively. Similarly, the traffic reception machines were also deployed to fulfill network requirements. Details of the traffic generation tools are shown in Table 2 and 4. The virtual platform running Snort has been configured on a dual quad-core processor. The machine hardware details are listed in Table 4. The system is built on the Windows 2008 Server platform and three separate virtual platforms have been createdWindows XP SP2, Linux 2.6 & Free BSD 7.1. Snort is running simultaneously on all the virtual machines and similar traffic-loads and type are injected onto all platforms. 5.1
Evaluation Methodology
In order to ascertain the capability of Snort to handle high-speed network traffic on virtual platforms we proceed as follows: • • •
Parallel Snort sessions were run on all virtual machines. The machines were injected with similar traffic-load characteristics (UDP and TCP Traffic) for 10 minutes. Different packet sizes (128, 256, 512, 1024 and 1460 bytes) were generated and Snort’s performance at the following traffic-load was evaluated: 100 Mbps, 250 Mbps, 500 Mbps, 750 Mbps, 1.0 Gbps and 2.0 Gbps respectively.
Implementation and Evaluation of Network Intrusion Detection Systems
• • •
1003
Snort’s performance characteristics were evaluated - packets received, packets analysed, packets dropped and CPU usage at various packet sizes and band widths levels. Packets received were compared at both the host OS and the virtual platforms running the Snort applications. During the course of the tests, no changes were made in OS implementation specifically Linux using New Application Program Interface (NAPI) [27] and2 MMP and Free BSD using Berkley Packet Filter (BPF) [28].
5.2 Results The results are distributed over UDP and TCP traffic types respectively. It was observed that the total packets transmitted from the traffic-generating PCs was equivalent to the number of packets received at the host machine/ OS running virtual platforms as shown in Table 7; however, this is not the case once the system found3 non responsive. 5.2.1 UDP Traffic The results below are described in relation to packet size, bandwidth (i.e. traffic-load), and the virtual OS platform running the Snort application: 5.2.1.1 Snort Response for Packet Sizes of 128 and 256 Bytes •
Linux shows quite good performance for these packet-sizes upto 250 Mbps traffic-load; its performance declined at higher bandwidth levels as shown in Fig. 14. The system found non responsive at the traffic-loads of 750 Mbps and above. Table 7. Packets Received at Host Operating Systems Total Packets Received at OS (Millions) – UDP Bandwidth
128 Bytes
256 Bytes
512 Bytes
1024 Bytes
100 MB
60
35.82
17.77
10.56
6.96
250 MB
178.1
94.14
48.00
18.34
20.22
358.3
148.29
92.56
46.2
39.00
144.72
91.56
45.23
167.40
78.00
500 MB
System Non Responsive
750 MB
System Non Responsive
1.0 GB
1460 Bytes
System Non Responsive
2.0 GB
Total Packets Received at OS (Millions) – TCP
2 3
Bandwidth
50 Connections
100 Connections
200 Connections
100 MB
10
26.7
21.60
250 MB
31.86
39.763
48.69
500 MB
67.90
108.56
84.098
750 MB
80.29
113.72
124.58
1.0 GB
102.51
118.144
148.982
2.0 GB
147.54
170.994
221.28
Modified Device Drivers Packet Handling Procedures. In non responsive situation we consider 100% packet loss.
1004
•
Windows shows good performance for 128 Bytes packet sizes at 100 Mbps loading only. Its performance is compromised at higher loading levels as shown in Fig. 14. The system also found non responsive at traffic-loads of 750 Mbps and above. Free BSD performs slightly better than Windows as shown in Fig. 14. The system also found non responsive at traffic-loads of 750 Mbps and above.
% - Pkts Rx by Snort
•
M. Akhlaq et al.
Packet Size – 128 Bytes 120 100 80 60 40 20 0
Windows SP 2 Linux 2.6 Free BSD 7.1
% - Pkts Rx by Snort
100 Mbps 250 Mbps 500 Mbps 750 Mbps 1.0 Gbps
120
UDP Traffic
2.0 Gbps
Packet Size – 256 Bytes
UDP Traffic
100 80
Windows SP 2 Linux 2.6 Free BSD 7.1
60 40 20 0 100 Mbps 250 Mbps 500 Mbps 750 Mbps 1.0 Gbps
2.0 Gbps
Fig. 14. Snort Packets Received (%) - UDP Traffic (128 Bytes & 256 Bytes)
5.2.1.2 Snort Response for Packet Sizes of 512 and 1024 Bytes •
•
•
Linux shows quite good performance for traffic-load up to 500 Mbps for all packet sizes as shown in Fig. 15. The Linux however system found non responsive at traffic-loads of 1.0 Gbps and above for 512 Bytes packet sizes and at 2.0 Gbps for packet sizes of 1024 Bytes. Windows also performed satisfactorily at traffic-loads of 250 Mbps and 500 Mbps for packet sizes of 512 Bytes and 1024 Bytes respectively as shown in Fig. 15. The system found non responsive at traffic-loads of 1.0 Gbps and above for packet size of 512 Bytes and 2.0 Gbps for packet sizes of 1024 Bytes. Free BSD responds a bit better than Windows as shown in Fig. 15. The system found non responsive at traffic-loads greater than 1.0 Gbps for packet sizes of 512 Bytes and 2.0 Gbps for packet sizes of 1024 Bytes.
5.2.1.3 Snort Response for Packet Size of 1460 Bytes • • •
Linux shows significantly better performance for packet sizes of 1460 Bytes of packet for traffic-loads up to 1.0 Gbps however, the system found non responsive at 2.0 Gbps loading as shown in Fig. 16. Windows also shows good performance upto750 Mbps loading. The system found non responsive at 2.0 Gbps traffic-load as shown in Fig. 16. Free BSD responds a bit better than Windows as shown in Fig.16. The system found non responsive at 2.0 GB traffic-load as shown in Fig. 16.
% - Pkts Rx by Snort
Implementation and Evaluation of Network Intrusion Detection Systems
Packet Size – 512 Bytes
UDP Traffic
120 100 80
Windows SP 2 Linux 2.6 Free BSD 7.1
60 40 20 0 100 Mbps 250 Mbps 500 Mbps 750 Mbps 1.0 Gbps
% - Pkts Rx by Snort
1005
2.0 Gbps
UDP Traffic
Packet Size – 1024 Bytes 120 100 80 60
Windows SP 2 Linux 2.6 Free BSD 7.1
40 20 0 100 Mbps 250 Mbps 500 Mbps 750 Mbps 1.0 Gbps 2.0 Gbps
Fig. 15. Snort Packets Received (%) - UDP Traffic (512 Bytes & 1024 Bytes)
5.2.2 TCP Traffic We have included the results of 512 Bytes packet sizes in this section due to paucity of space. The results have been accumulated on the basis of successful connections (50, 100 and 200 respectively). 5.2.2.1 Snort Response for 50 Connections of 512 Bytes
% - Pkts Rx by Snort
Linux exhibits quite good performance up to 750 Mbps loading however, its performance declined at higher traffic-loads as shown in Fig. 16. Packet Size – 1460 Bytes
UDP Traffic
120 100 80
Windows SP 2 Linux 2.6 Free BSD 7.1
60 40 20 0 100 Mbps 250 Mbps 500 Mbps 750 Mbps 1.0 Gbps
% - Pkts Rx by Snort
•
2.0 Gbps
Packet Size – 512 Bytes 120 100
TCP Traffic 50 Connections
80 Windows SP 2 Linux 2.6 Free BSD 7.1
60 40 20 0 100 Mbps 250 Mbps 500 Mbps 750 Mbps 1.0 Gbps 2.0 Gbps
Fig. 16. Snort Packets Rx (%) - UDP (1460 Bytes) & TCP (50 Connections)
1006
• •
M. Akhlaq et al.
Windows was acceptable up to 250 Mbps loading and its performance reduced for higher traffic-loads as shown in Fig. 16. Free BSD performed a bit better than Windows as shown in Fig. 16.
5.2.2.2 Snort Response for 100/ 200 Connections of 512 Bytes •
• •
Linux exhibits quite good performance up to 250 Mbps loading with minimum packet loss, however, its response linearly declined for higher traffic-loads. Windows also exhibits a similar performance level up to 250 Mbps loading levels and its performance declined for higher traffic-loads as shown in Fig. 17. Free BSD performs a bit better than Windows as shown in Fig. 17. Overall the performance of both categories (100 and 200 Connections is quite similar for packet size 512 Bytes.
6 Analysis 6.1 Test-Bench 1
% - Pkts Rx by Snort
As expected, the performance of Snort was found to be dependent on its supporting hard-ware components (CPU, memory, NIC etc). In the virtual scenarios, Snort was found to be less accurate for all categories of background traffic. Conversely, the performance of Snort improved when run natively on its host machine by utilizing all of the available hardware resources. The statistics for percentages of dropped packets are shown in Fig. 18. Resource constraints in the virtual machine have affected the overall performance of Snort resulting in a high number of packets dropped and a reduction in alerts logged. Packet Size – 512 Bytes 120 100
TCP Traffic 100 Connections
80 Windows SP 2 Linux 2.6 Free BSD 7.1
60 40 20 0 100 Mbps 250 Mbps 500 Mbps 750 Mbps 1.0 Gbps
% - Pkts Rx by Snort
•
120 100
Packet Size – 512 Bytes
2.0 Gbps
TCP Traffic 200 Connections
80 Windows SP 2 Linux 2.6 Free BSD 7.1
60 40 20 0 100 Mbps 250 Mbps 500 Mbps 750 Mbps 1.0 Gbps 2.0 Gbps
Fig. 17. Snort Packets Received (%) - TCP Traffic (100 & 200 Connections)
Implementation and Evaluation of Network Intrusion Detection Systems
1007
Packets Dropped Statistics 80 70 60 50
Alpha
40
Bravo Charlie
30
Delta Echo
20 10 0 100 Mbps - 400 Mbps
500 - 700 Mbps
800 Mbps - 1.0 Gbps
Fig. 18. Packets Dropped
•
• • • • • •
•
Background traffic plays a significant role in the performance of Snort. The higher the traffic, the less is the performance of Snort. The impact of background traffic can be ascertained by analyzing the statistics of alerts generated in different categories as shown in Fig. 19. Traffic within the range of 100 – 400 Mbps has no significant impact on the performance of Snort when run natively on host machines. However, its performance declines in a virtual setup. Snort was found to be accurate in all scenarios. A slight increase in background traffic, in the range of 500 – 700 Mbps causes deterioration in the performance of Snort. This degradation is approximately the same in all scenarios. With high background traffic levels, ranging from 800 Mbps – 1.0 Gbps Snort start bleeding. The number of alerts and log entries suffer significant reduction, thus identifying an evident limitation in Snort’s detection capability. Snort was found to be more effective in the configuration where both attacker and host are on the same OS. Snort performance is significantly reduced in the 1.0 Gbps scenarios. System performance in relation to packet capture capabilities also found dependent on CPU usage. Higher the CPU usage lesser would be the packet captured for analysis by Snort application. Packets received at virtual platform for evaluation by Snort are significantly less than the packets captured at host platform. However, lesser amount of packets received by virtual platforms result in improved packets analysis statistics by Snort. For example in Windows virtual platform, Snort analyzed 38% of the total packets received at system level whereas in host Windows configuration, this value reduced to 27%. Better packets analysis percentage of virtual platform is due to the fact that the Snort analyzed considerably lesser amount of packets whereas the packets captured for analysis at host level are significantly more thus by no means virtual platform performed better than the fully resourceful host. The performance of Snort on a Linux platform was observed to be comparatively better than that of Windows. The results shown in Fig. 20 are based on the
1008
•
M. Akhlaq et al.
scenarios in which the Snort and attacker are on well resourced host machines (Scenario Charlie and Delta). In general, Snort was found to be inaccurate when handling traffic levels above 500 Mbps. There was also a significant performance decline when the traffic load exceeded 500 Mbps.
Alerts & Logged Statistics 120
100
80 Alpha Bravo
60
Charlie Delta
40
Echo 20
0 100 - 400 Mbps
500 - 700 Mbps
800 Mbps - 1.0 Gbps
Fig. 19. Alerts & Log (Success Rate)
Linux vs Windows 120
100
80 Charlie (200 - 400 Mbps) Delta (200 - 400 Mbps))
60
Charlie (500 - 700 Mbps) Delta (500 - 700 Mbps)
40
Charlie (800 Mbps - 1.0 Gbps) Delta (800 Mbps - 1.0 Gbps)
20
0 Network Utilization
CPU Usage
Snort CPU Packets Packets Alerts & Usage Analysed Dropped Log
Fig. 20. Comparison - Snort on Linux & Win
6.2 Test-Bench II The shaded cells in Table 5 indicate the case of I/O disk bottleneck, when the queue for I/O reading and writing exceeds an acceptable limit and the hosting machine is no longer able to process all the traffic (detailed discussion ahead). The overall assessment of system performance indicates following:
Implementation and Evaluation of Network Intrusion Detection Systems
1009
• Snort running on Free BSD has achieved the greatest performance in comparison to other OS for all traffic volumes and packet sizes. • Windows and Linux showed quite similar performance in all scenarios. • Small sizes of UDP packets are computationally expensive and the performance of Snort declines for increase in traffic bandwidth. • Considering the 1024 Bytes as an average packet size for normal real life traffic, the raw processing rate of Snort application showed acceptable performance till bandwidth of 750 Mbps for all OS and 1.0 Gbps for Free BSD. • We have also recorded the CPU and memory usage of the system for packet size 1024 Bytes (UDP Traffic) as shown in Fig. 21. It has been observed that more than 60 % of the hardware strength is available for the traffic ranging from 100 Mbps to 2.0 Gbps. • The non highlighted results in Table 5 also indicates the Snort design to support multi-core architecture, this is also under the evaluation phase in our test-lab. 6.3 Test-Bench III •
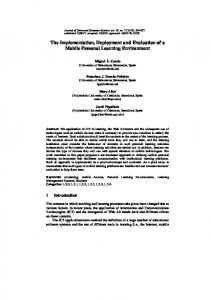
The dynamics of virtualization requires the Host OS and the Virtual Machine Software (VMware Server [29]) to be stored in the physical memory (RAM) of the host machine. The virtual machines (Windows XP SP 2, Linux 2.6 and Free BSD 7.0) running on VMware Server have been respectively allocated virtual RAM and disk space on the physical hard drive of the host machine. The processes/ applications running on the virtual machines use these simulated virtual RAMs and hard disks for the various operations shown in Fig. 22 [10].
The Test-Bench has multiple instances of Snort and packet-capture libraries running on different virtual platforms each with a different OS. The packets captured by each virtual machine are less than the packets received by the Network Interface Card (NIC), thus identifying packet loss somewhere in between. The basic cause of packet loss at each OS apart from the losses incurred by Snort during evaluation is the bottleneck caused by a low disk data transfer rate. The memory and storage for each virtual machine has actually been allocated on the physical storage resources (i.e. hard disk) of the host machine. Packets received by the NIC without any loss are transferred to the hard disk buffer at the Peripheral Component Interconnect (PCI) rate (4/8 Gbps). From this buffer, these packets are required to be written to the disk at the buffer- to-host transfer rate of 300 MB/sec (SATA Hard Drive [30]); thus a huge gap between the disk-transfer rate and the incoming traffic load exists. In addition, traffic is fed to all virtual machines simultaneously (in parallel mode), the disk is physically only able to write to one location at a time. Thus any disk-write instance to a virtual machine will cause packet drops on another. There are also some additional packet losses due to context switching within the hard disk. In order to augment our analytical stance of showing hardware as one of the major bottlenecks for the efficacy of the virtualization concept for NIDS in high-speed networks we have utilized the disk queue length counter as shown in Fig. 10. In normal circumstances, the average disk queue length should be three or less (its ideal value) [31]. However; in our test network, it is observed to be always greater than the ideal value for the traffic ranges measured at 2.0 Gbps [10].
1010
M. Akhlaq et al.
Fig. 21. CPU & Memory usage
Virtualization Concept NIC
Parameters
2.0 Gb Traffic Win SP 2
Linux2
Free BSD
Virtual Machine, VMware Server 2.0 Gb
Buffer (16 MB)
Virtual Window s Memory Hard Disk
Virtual Linux
Virtual BSD
Memory Hard Disk
Memory Hard Disk
Host OS
• Host OS – Win Sever 2008 • Physical RAM – 4.0 GB • Hard Drive – 1.0 TB, SATA 300 MB • PCIe – 4/8 GB • Virtual Machine - VM Ware Server • Virtual OS – Win XP SP2, Linux 2.6 & Free BSD 7.1 •Traffic Injected – 2.0 Gbps (max) • Buffer to host data transfer rate 300 MB/s • NIC – 10 GB PCI-X, PCIe (Manufacturer: Chelsio)
Limitations - Packet Drop • Context switching between virtual machines • Less buffer to host data transfer rate • Asynchronous write mechanism for available storage device
Host Hard Drive
Fig. 22. Virtualization Concept
7 Recommendations 7.1 Processor Speed Snort has shown a dependency on the hardware strength of host system. Our results identify a decline in the performance of Snort once CPU usage touches 50%. The increase in CPU usage is due to the processing overheads incurred when presented with high background traffic levels. Snort system hardware therefore needs to be compatible with the network traffic load it needs to process. We propose a simple mathematical formula to select a processor for the host system running Snort depending on network traffic loads as follows:
Implementation and Evaluation of Network Intrusion Detection Systems
Ct = Nt x K; K = 4.8
1011
(1)
where Ct stands for processor speed in GHz, Nt is the maximum value of anticipated network traffic in Gbps and K is constant. The value of K is based on the statistics from the results obtained in this research work. We have verified our proposed formula in different scenarios and found it satisfactory. 7.2 Protocol Oriented Analysis During our testing work, we also explored a technique which incorporates the analysis of traffic based on protocols. This was undertaken by creating a number of mirror ports on the network switch. The host Snort machines are configured to respond to a specific protocol, thus considerably reducing the processing required to be performed. These protocol-oriented engines reduce the numbers for packet dropped, increase efficiency and reduce response time. The proposed architecture is shown in Fig. 23. The concept also addresses the limitation of Snort being a non multithreaded application [32].
Protocol Oriented Analysis Network Traffic
Switch
UDP
TCP
ICMP
HTTP
Any Other
Snort running on all machines Fig. 23. Protocol Oriented Analysis
7.3 Serialization Concept Another technique enables the re-evaluation of dropped packets by the Snort engine. Packets dropped by the Snort engine on account of processing overheads and overflow are analyzed by a parallel logic designed to handle packets based on certain attributes. The flow diagram as shown in Fig. 24 can be a good supplement to the Snort packet-dropping weakness under high traffic conditions. We have discussed this concept in our work based on Comparator Logic in [33].
1012
M. Akhlaq et al.
The dropped packets belonging to a complete session can be reassessed and packets showing incomplete sessions get deleted. Similarly, packets showing protocol violations get deleted and others get a chance to be re-evaluated. Other suitable parameters could also be incorporated into the architecture. 7.4 Dynamic Configuration Site specific NIDS configuration that maximizes the analysis under predefined resource constraints as presented in [34] can also be implemented for Snort.
8 Conclusions This chapter has focused on ways of determining the efficacy of the widely deployed open-source NIDS, namely Snort, in high-speed network environments. The current development in hardware technologies has opened broad prospects for legacy applications particularly software-based deployed at network edges. Multi-core systems are available and widely used to offer intensive computational opportunities. The test scenarios employed, involved the evaluation of application under different traffic conditions and observing the response of system to known attack signatures.
Serialisation Concept Parallel Logic
Packets Dropped Snort
Session Status Incomplete
Complete
Deleted
Protocol Statistics Violated
Satisfied
Add on options Deleted
Fig. 24. Serialization Concept
The results obtained have shown a number of significant limitations in Snort at commodity level. It was confirmed that the underlying host hardware plays a prominent role in determining overall system performance. It was also shown that performance is further degraded as the number of virtual instances of NIDS is increased, irrespective of the virtual OS used. This hardware dependency is exacerbated when running Snort as a virtual machine and it is to be anticipated that running a large number of Snort instances would lead to
Implementation and Evaluation of Network Intrusion Detection Systems
1013
major degradations in performance and detection levels. In general, any limitations in system configuration would result in poor performance of the IDS and thus, it could be concluded that commodity hardware is not the ideal platform for IDS implementation in high speed environment. The results obtained have shown a number of significant limitations in the use of virtual NIDS, where both packet-handling and processing capabilities at different traffic loads were used as the primary criteria for defining system performance. Furthermore, it was demonstrated a number of significant differences in the performance characteristics of the three different virtual OS environments in which Snort was run. The performance of Snort was analyzed under realistic network conditions. The results obtained identify a strong dependency of Snort on the host machine configuration. It can be ascertained that Snort is not suitable for all network implementations with high volume of traffic above 750 Mbps. During the course of this study, the suitability of some techniques was identified towards the enhancement of the performance of Snort and they can form the basis of the enhancement of the recommended solutions in future research works. Acknowledgement. The authors are extremely grateful to Professor Demetres Kouvatsos for his advice and assistance. His in-depth reviews has definitely improved the quality of this work.
References 1. John, D., Tessel, S., Young, F.L.: The Hackers Handbook. Auerbach Publications, New York (2004) 2. Intrusion Detection Systems (IDS) Part 2, Classification; methods; techniques, http://www.windowsecurity.com/articles/ IDS-Part2-Classification-methods-techniques.html04 3. Infrastructure Security Report- ARBOR Networks, http://www.arbornetworks.com/report 4. Snort, http://www.Snort.org 5. Paulauskas, N., Sjudutis, J.: Investigation of the Intrusion Detection System “Snort” Performance. Journal of Electrical and Electronics Engineering (2008) 6. Andrew, R.B., Joel, E.: Snort IDS and IPS Toolkit, Syngress, Canada (2007) 7. Case, J., Fedor, M., Schoffstall, M., Davin, J.: Simple Network Management Protocol (SNMP), Network Security Research Group, RFC 1157 (1990) 8. Wu, S., Manber, U.: AGREP, A Fast Approximate Pattern-Matching Tool. In: Proc. of USENIX Winter 1992 Technical Conference, San Francisco, CA, pp. 153–162 (1992) 9. ProCurve Series 2900 Switch, http://www.hp.com/rnd/products/switches/ HP_ProCurveSwitch2900Seriesoverview.htm 10. Akhlaq, M., Alserhani, F., Awan, I.U., Mellor, J., Cullen, A.J., Mirchandani, P.: Virtualization Efficacy for Network Intrusion Detection Systems in High-speed Networks. In: Weerasinghe, D. (ed.) IS&DF, vol. 41, pp. 26–41. Springer, Heidelberg (2010) 11. NetCPS, http://www.netchain.com/NetCPS 12. Tfgen, http://www.st.rim.or.jp/~yumo/pub/tfgen 13. Http Traffic Generator, http://www.nsauditor.com/
1014
M. Akhlaq et al.
14. LAN Traffic V2, http://www.topshareware.com/lan-traffic-v2/ downloads/1.htm 15. D-ITG V2.6, http://www.grid.unina.it/Traffic/index.php 16. Hping V 2, http://www.hping.org/download.html 17. Metasploit Framework, http://www.metasploit.com/ 18. Bandwidth Monitor, http://www.sourceforge.net/projects 19. Nload, http://www.sourceforge.net/projects/nload/ 20. Windows XP SP2, http://www.softwarepatch.com/windows/xpsp2.html 21. Linux 2.6, http://www.kernel.org/ 22. Windows Server 2008, http://www.microsoft.com/windows_server2008/ en/us/default.aspx 23. Free BSD 7.1, http://www.freebsd.org/where.html 24. An Introduction to Virtualization, http://www.kernelthread.com/ publications/virtualization 25. Business value of virtualization: Realizing the benefits of integrated solutions, http://h18000.www1.hp.com/products/servers/management/vse/ Biz_Virtualization_WhitePaper.pdf 26. Virtualization, http://www.windowsecurity.com/whitepapers/ Virtualization.html 27. Linux NAPI, http://www.linuxfoundation.org/collaborate/ workgroups/networking/napi 28. Berkley Packet Filter, http://www.freebsd.org/releases/ 7.1R/relnotes.htm 29. VM Ware Server, http://www.vmware.com/products/server/ 30. SATA Technology, http://www.serialata.org/ 31. Disk Queue Length Counter, http://www.windowsnetworking.com/ articles_tutorials/ 32. Alserhani, F., Akhlaq, M., Awan, I.U., Cullen, A.J., Mellor, J., Mirchandani, P.: Evaluating Intrusion Detection Systems in High Speed Networks. In: Proceeding of Fifth IEEE Conf. of Information Assurance and Security, IAS (2009) 33. Subhan, A., Akhlaq, M., Alserhani, F., Awan, I., Cullen, A., Mellor, J., Mirchandani, P.: Smart Logic - Preventing Packet Drop in High Speed Network Intrusion Detection Systems. In: Weerasinghe, D. (ed.) IS&DF, vol. 41, pp. 57–65. Springer, Heidelberg (2010) 34. Akhlaq, M., Alserhani, F., Subhan, A., Awan, I.U., Mellor, J., Mirchandani, P.: High Speed NIDS using Dynamic Cluster and Comparator Logic. In: Proc. of 2010 IEEE 10th International Conference on Computer and Information Technology (CIT), pp. 575–581 (2010)
Implementation and Evaluation of Network Intrusion Detection Systems
1015
Appendix I: List of Acronyms BSD - Berkley Software Distribution BPF - Berkley Packet Filter CPU - Central Processing Unit DDoS - Distributed Denial of Service Attack D-ITG - Distributed Internet Traffic Generator FSB - Front Side Bus Gbps - Giga bits per second GB - Giga Bytes HTTP - Hypertext Transfer Protocol ICMP - Internet Control Message Protocol IDS - Intrusion Detection Systems I/O - Input and Output IPS - Intrusion Prevention Systems MB - Mega Bytes MMP - Modified Device Drivers Packet Handling Procedures NIDS - Network Intrusion Detection Systems NIC - Network Interface Card NAPI - New Application Program Interface OS - Operating System Pkts - Packets PC - Personal Computer PCI X - Peripheral Component Interconnect Extended PCIe - Peripheral Component Interconnect Express RX - Received RPC - Remote Procedure Call RJ45 - Registered Jack Serial 45 SNMP - Simple Network Management Protocol TCP - Transmission Control Protocol UDP - User Datagram Protocol VRT - Virtual Resource Tree VM Ware - Virtual Machine Software Win XP SP2 - Windows XP Service Pack Serial 2
Appendix II Aho-Corasick Algorithm. The algorithm is multi-pattern exact matching algorithms, based on FSA (finite state automata). In pre-processing stage, Aho-Corasick constructs a state machine called Trie from the strings to be matched. Aho-Corasick state machine implementation can be based on either of two – Non Deterministic Finite Automata (NFA) or Deterministic Finite Automata (DFA). We have considered NFA which mainly comprise Full, Sparse and Standard (Std) bands. The Full matrix representation is one in which all the states have a next state entry for each of the possible input values. However, this kind of a data structure is too memory consuming, and hence not a suitable data structure for storage purposes. In the Sparse storage format, the data structure is a bit different. The elements of the new storage matrix will be the number of valid state transitions for the given state, the valid transitions and the corresponding next state. This kind of a storage helps us
1016
M. Akhlaq et al.
reduce memory, but speed may be compromised because the random access into the matrix is now lost in this modified structure. Finally the Standard mode is the high memory and high performance type. Aho, Alfred V.; Margaret J. Corasick (June 1975). "Efficient string matching: An aid to bibliographic search". Communications of the ACM 18 (6): 333–340 Wu-Manber Algorithm. The algorithm is a high performance multi-pattern matching algorithm, it has two broad types Wu Manber and Wu Manber (Low). The regular Wu Manber algorithm has two stages. It uses the bad-character shift and considers the characters from the text in blocks of size B instead of one by one and, consequently, expands the effect of bad-character shift. Wu-Manber algorithm uses a hashing table to index the patterns in the actual matching phase. The best performance of Wu-Manber algorithm is O(Bn/m), where n is the text size and m is minimum length of the pattern. The running time of the Wu-Manber algorithm does not increase in proportion to the size of the pattern set. The performance of the Wu-Manber algorithm is dependent on the minimum length of the patterns. In pre-processing stage, the Wu-Manber algorithm builds three tables, a SHIFT table, a HASH table and a PREFIX table. SHIFT table is used to determine how many characters in the text can be shifted (skipped) when the text is scanned. The HASH and PREFIX tables are used when the shift value is 0 to determine which pattern is a candidate for the match and to verify the match. Compared with the regular Wu-Manber algorithm, the improved Wu-Manber (low) algorithm has three differences, which make it more efficient: 1) a rarest substring with fixed length is chosen for each original pattern as representative to better the quality of the Boyer-moore like SHIFT table; 2) a second Boyer-moore SHIFT table is computed to improve the likelihood of shifting text sliding window continuously; 3) a simple hash function with good randomness property is crafted to build a balanced hash table to accelerate the searching speed of possible matching patterns. Reference, Boyer Moore: Boyer R. S., Moore J. S: A fast string searching algorithm. In Communications of the ACM. 1977,20 (10), pp. 762-772 (1977).