Jan 18, 2006 - software-based GPS receivers, high data processing efficiency is required to obtain real-time performance. There are two basic approaches to ...
Implementation and Testing of a Real-Time Software-Based GPS Receiver for x86 Processors Shahin Charkhandeh, M.G. Petovello, R. Watson and G. Lachapelle Position, Location and Navigation (PLAN) Group Department of Geomatics Engineering, University of Calgary Calgary, Alberta, Canada, T2N 1N4
BIOGRAPHY Shahin Charkhadeh is an MSc student in the Department of Geomatics Engineering at the University of Calgary. He has a BSc in software engineering from the same university. His area of specialization is software receiver design and algorithms.
Using this approach, computational improvements of greater than 70% are realized over the standard (integer math) implementation. Initial results indicate that tracking performance of the software receiver is reasonable and that position and velocity accuracies are at the meter and decimeter per second level, respectively. INTRODUCTION
Dr. Mark Petovello holds a PhD from the Department of Geomatics Engineering at the University of Calgary where he is a senior research engineer in the Position, Location and Navigation (PLAN) group. He has been involved in various navigation research areas since 1998, including satellite-based navigation, inertial navigation, reliability analysis, and dead-reckoning sensor integration. Rob Watson is a Research Engineer with the PLAN Group. He completed his MSc in Geomatics Engineering in 2005, following a BSc in Electrical Engineering in 2002, both at the University of Calgary. His research interests include signal processing for indoor and highsensitivity GPS, and modernized GPS tracking. Dr. Gerard Lachapelle is a professor in the above department, where he is responsible for teaching and research related to location, positioning and navigation. He has been involved with GPS developments and application since 1980. More info on http://plan.geomatics.ucalgary.ca ABSTRACT Given the demanding computational requirements of software-based GPS receivers, high data processing efficiency is required to obtain real-time performance. There are two basic approaches to accomplish this: reducing the number of computations required, or improving the efficiency with which the computations are carried out. This paper takes the latter approach, primarily by using the MMX technology available on x86-compatible processors to more rapidly perform the Doppler removal and code correlation computations. Other computational saving methods are also described.
A typical GPS software receiver performs the entire baseband signal processing in the software module. This allows developers to modify and test new algorithms without making any changes to the hardware. Also, expanding a GPS software receiver in order to add support for new signal structures is easier and cheaper compared to traditional receivers. This is an appealing characteristic since we will see the arrival of many new signals such as L2C and L5 in the near future. Doppler removal and correlation of GPS signal requires millions of complex operations in a second, the execution of which is governed by both a processor’s speed and the availability of GPS data samples. If a software receiver operates slower than the rate required to process incoming data, it can lose lock on the signal and never track it properly. Moore’s law states that the number of transistors and resistors on a chip doubles every 18 months. In simple terms, the computational power available to us approximately doubles every 18 month. This will enable us to develop a multi-channel GPS receiver on low-end general purpose processors much more easily in the future. The PLAN (Position, Location And Navigation) Group developed its first software receiver (GNSS_SoftRx™) during the past three years. The post-mission version has already been used by numerous PLAN Group students for many research projects (Ma et al 2004, Skone et al 2005, Zheng & Lachapelle 2005). The current work focuses on expansion and optimization of this receiver in order to gain better performance, with
The Institute of Navigation National Technical Meeting (ION NTM 2006), Monterey, California, USA, January 18-20.
1/8
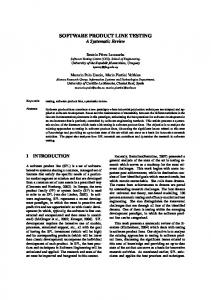
the ultimate goal of real time operation. The work mainly addresses difficulties that are faced when developing a GPS software receiver and the necessary steps taken to overcome them. Also, the importance of using MMX technology is reviewed with respect to how it can benefit and enhance the performance of a software receiver. Finally the result of the changes and the tracking performance of the receiver are presented. SYSTEM ARCHITECTURE The overall architecture of the software receiver is described in detail in Ma et al (2004) and is shown in Figure 1. Acquisition
Antenna
Tracking Loop
Sub-frame Synchronization
Measurement Derivation
Navigation Solution
Front End Amplifier
Inner Clock Generation
Receiver Monitoring
Figure 1: Overall architecture of the receiver Here we briefly describe each component. The front end is the only hardware section of this receiver. It is based on a NovAtel Euro-3M™ GPS receiver, from which the raw IF samples are extracted and written to a PC’s hard disk. The current version of the receiver works in post mission mode and reads data from a data file. Acquisition consists of a sequential bin search method described in Kaplan (1996) and uses the Tong detector method. Acquisition consists of two steps: noise floor determination followed by coarse acquisition. The tracking component has a DLL code tracking loop and FLL frequency tracking. A PLL operating in real time will be implemented in the future (the post-mission version already has this capability). The measurement and navigation solution components of the current receiver are unchanged from the previous version described in detail in Ma et al (2004).
COMPUTATIONAL BOTTLENECKS The most computationally expensive task of a GPS receiver is IF signal processing, which includes Doppler removal and correlation with the local code. A receiver
typically needs to process GPS data acquired at a sampling rate of 2.5 MHz to 5 MHz for C/A code. Additionally, the receiver must perform other operations such as tracking and solution calculation in parallel with the signal processing operations. Although the latter tasks typically run at a slow rate (0.1 to 10 Hz), the computational requirements must still be considered, as they consume some computational resources in the receiver. Furthermore, the additional processing requirements for interfacing with an RF front-end in real time must be considered. To satisfy these requirements, it is assumed for purposes of this work that only 50% of the computer’s resources are available to the signal processing component of the receiver. This is likely a conservative benchmark. To illustrate the number of operations required, consider receiving 1 ms of data at a 5 MHz sampling rate (complex data). To track 6 satellites, the computation of 3 correlation values (early, prompt and late) requires a GPS receiver to generate 60,000 sine and cosine values and perform 300,000 multiplications and 240,000 additions (Heckler & Garrison 2004). DOPPLER REMOVAL As mentioned above, during the tracking for one satellite, assuming a sampling rate of 5 MHz and a complex GPS data, a receiver needs to generate 5000 (1 ms, length of C/A code) sine and cosine values and multiply these by 5000 samples of the incoming data. Computing all of these complex values in real time is not possible with the current processors in the software. There are two major issues that need to be addressed: 1) Generation of the sine and cosine values. 2) Mixing the GPS data with sine and cosine values. Generation of sine and cosine values Computing a large number of sine and cosine values in real time is computationally too expensive for the GPS software receiver. This is a challenging task in the software since it does not have the same level of parallelism as hardware. As a solution to this problem, these values can be computed and stored in memory. Later, they can be used in real time to perform the Doppler removal. There are two methods that have been developed to do this more efficiently. A table-look-up method reduces this time significantly. In this method, sine and cosine values for all possible phases are calculated and stored in an array. Software needs to use the estimated frequency of the GPS signal to index into this array and get the right sine and cosine value. However, the indexing requires that the data be processed on a sample by sample basis and the memory look up in each step is time consuming. So despite the fact that this method enhances the performance, the gain is not enough for the receiver to perform in real time. This is the method
The Institute of Navigation National Technical Meeting (ION NTM 2006), Monterey, California, USA, January 18-20.
2/8
that was used in the prior version of the GNSS_SoftRx™. Better performance (30% improvement) can be accomplished with the second method, however. The second method is called Table grid method. In this method sine and cosine values are computed based on some grid frequencies and saved in a table (Ledvina & Psiaki 2003).With table grid method, decrease of C/N0 is expected from using an inexact frequency. However, this has no effect on the accuracy of the solution, nor does it significantly reduce the tracking sensitivity. Ledvina et al (2003) shows that the worst case SNR loss in the case of T=0.001 s is 0.44 dB where T is the coherent integration time. Since table frequencies are not as precise as the frequency of the incoming signal, there will be a need to do an extra phase rotation at the end of the correlation to compensate for the frequency error. The theory of this rotation is described below. In the ideal case, I and Q represent the complex GPS signal received from a single satellite, having the form
I = AC cos(2"f r Ts k + ! 0 ) Q = AC sin( 2"f r Ts k + ! 0 ) where A is the average amplitude of the carriers, C is the PRN of the satellite, fr is the observed carrier frequency, Ts is the sampling frequency, k is an integer sampling unit, and Φ0 is the initial carrier phase. Mixing with an ideal local carrier, the quantities I’ and Q’ (in phase and quadrature phase after Ideal Doppler removal) are given as follows (brief derivation given only for I’, it is analogous for Q’):
I $$ = AR(& )
sin(%#fTs N ) ˆ 0) cos(%#fTs N + ! 0 " ! %#fTs (1)
Q $$ = AR(& )
sin(%#fTs N ) ˆ 0) sin(%#fTs N + ! 0 " ! %#fTs
These values are the ideal post-correlation values, and are together referred to as Equation 1. In contrast to the ideal frequency removal given above, the results of using the frequency grid table method are given below. Using this method, only an approximate frequency reference fT is available, where fˆ = f + !f T
sin(& ( f " fˆ )Ts N ) $ & ( f " fˆ )Ts ˆ 0) cos(&#f T Ts N + &#f 0Ts N + ! 0 " ! sin(& ( f " fˆ )Ts N ) Q%% = AR (' ) $ & ( f " fˆ )T I %% = AR (' )
s
ˆ 0) sin(&#f T Ts N + &#f 0Ts N + ! 0 " ! In order to match the ideal form of Equation 1, we need to rotate the resultant correlation values according to the following relations, based on the frequency error between the table and the desired local frequency:
ˆ ) + Q$$. sin(!#f N + " ˆ ) I $$ = I $$. cos(!#fT N + " 0 T 0 ˆ ˆ Q$$ = Q$$. cos(!#f N + " ) % I $$. sin(!#f N + " ) T
ˆ 0 ) + Q sin( 2$fˆTs k + ! ˆ 0) I = I cos( 2$fˆTs k + ! ˆ 0) I ' = AC cos( 2$ ( f r # fˆ )Ts k + ! 0 # ! '
I ' = AC cos( 2$"fTs k + "! ) Q ' = AC sin( 2$"fTs k + "! )
fˆ is the frequency of the local carrier being ˆ is the initial phase offset used for demodulation, and ! 0 In the above,
of that local carrier. After correlating I’ and Q’ with the local PRN code and integrating for some period NTs, I’’ and Q’’ are the final correlation values for the in phase and quadrature channels:
T
and !f T is the difference between the actual frequency and the table frequency. Using this approximate frequency, the correlation values are calculated in a similar manner to that used before:
0
T
0
ˆ = " + 2!f T " 0 p p p Where
! p and fP are the phase and the frequency of the
previous correlation interval. This method was proposed by Ledvina et al (2003). Mixing the GPS data with sine and cosine value In addition to forming the sine and cosine values, mixing the signals is a time consuming task as well. It requires 20,000 multiplications and 10,000 additions of the incoming data against the sine and cosine values for one satellite in 1 ms. MMX instructions are used to perform this operation. The result of improvement in performance is shown in Table 1 in page 4.
The Institute of Navigation National Technical Meeting (ION NTM 2006), Monterey, California, USA, January 18-20.
3/8
CORRELATION LOCAL CODE
BETWEEN GPS DATA AND CODE TRACKING
The next step after Doppler removal is the correlation of GPS data with the local code. Assuming a 5 MHz sampling rate, this is equal to performing 30,000 multiplications and 30,000 additions per 1 ms for one satellite (early, prompt and late correlation). Results of the performance tests show that by using standard (integer math) C operators, this task can not be completed in real time for more than 1 satellite. MMX instructions can help the software to speed up these operations. This will be explained in more detail in the next section. MMX TECHNOLOGY MMX technology is a set of SIMD (Single Instruction, Multiple Data) instructions available on the Intel platform and on x86-compatible processors. It was developed to enhance multimedia and communication systems. SIMD has two advantages that enhance the performance of the software. SIMD treats the data as blocks. Therefore, several pieces of data can be loaded with one operation. This will reduce the memory access time while dealing with large quantity of data. The other advantage of SIMD is that it has a set of operations which work in parallel on a set of data. MMX has eight 64-bit registers that can be used to load data. If GPS data is represented with 8 bit (char) variables then MMX can load 8 samples in parallel from the memory and perform multiplications and additions in parallel on this data. Heckler & Garrison (2003) first proposed using MMX technology in GPS software receiver. Correlation across the C/A code boundaries may introduce a processing loss due to data bit boundaries. A solution to this problem was purposed in Heckler & Garrison (2003). The correlation is achieved in three steps: 1) Correlate the GPS data with local code to the code roll over point. 2) Perform the tracking and use the new Doppler to correlate the remaining data. Add this value to the value of first step in the next epoch to make a 1 ms correlation value. 3) Perform the tracking on this 1 ms of data. Another important technique used in the receiver to enhance its performance is the use of the pre-computed C/A code table. Two periods of C/A code were computed one after the other in memory at the appropriate sampling frequency. Therefore, there is no need to do a wrap around while performing a 1 ms correlation. It is noted that C/A code Doppler was not considered.
Inside a GPS receiver, a second order DLL (Delay Lock Loop) is used to track the C/A code of the signals. Although all the discriminators discussed by Ward (1996) can be used in the receiver, the normalized dot product discriminator has been chosen. This discriminator for 1/2 chip correlator spacing, produces nearly true error output within ±1 / 2 chip of input error. The discriminator output is calculated as
(! ( I E # I L ) " I P + ! (Q E # Q L ) " Q P ) / 2 N Where N is normalization factor, given as 2
N = I P + QP
2
This is described by Julien (2005). IP and QP are the in phase and quadrature values of correlation. In order to save time and increase the performance, the early minus late code can be calculated off line and stored and used during the correlation process. This will reduce the number of correlators per satellite from six to four (since you require one correlator for each of I and Q) and increase the computational performance of the receiver. This is pure code tracking. Carrier aiding has not been implemented in the real time version of the software yet. CARRIER TRACKING Carrier tracking is performed by using a 2nd order FLL (Frequency Lock Loop). The decision-directed cross product discriminator has been implemented for this receiver. This discriminator is optimal at high SNR and has a slope proportional to signal amplitude. The calculations required to generate the carrier phase discriminator output are given below:
dot = I P1 * I P 2 + QP1 * QP 2 cross = I P1 * QP 2 + I P 2 * QP1 discrim =
sign(dot )cross t 2 ! t1
C/N0 estimation is done based on an algorithm discussed by Van Dierendonck (1996). The estimation result depends on the a priori knowledge of bit transition. Averaging many C/N0 improves the estimation. TEST SETUP
The Institute of Navigation National Technical Meeting (ION NTM 2006), Monterey, California, USA, January 18-20.
4/8
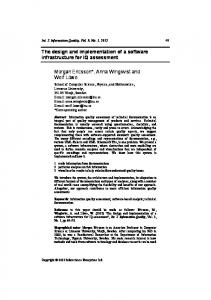
Figure 2 shows a test and data gathering set up. GPS RF samples are gathered with the NovAtel Euro-3M™ card. The Euro-3MTM board has an intermediate frequency (IF) of 70.42 MHz and front–end bandwidth of 16 MHz. The 6-bit output samples (3-bit L1 and 3-bit L2) are synchronized with a 40 MHz sampling clock. In order to process the sampled data in real-time using a software receiver, the output IF samples are further decimated to 5 MHz during post processing of the data. In future, when interfacing with hardware, the down sampling will be implemented in the FPGA. It is apparent that the new sampling rate is lower than twice the front-end bandwidth, which in turn, will cause a band aliasing. However, because the main lobe of L1 C/A-code is about 2 MHz wide, the signal degradation is not very significant. To improve our results further, a 2 MHz FIR filter can be added into the FPGA to improve the signal quality. The Altera UP2 FPGA (Altera University Program 2), takes in 6-bit output samples, as well as the synchronized 40 MHz sampling clock. Several 1-bit in/8-bit out serialto-parallel shift registers, D-latches, and one 3-bit counter are implemented in the FPGA. The output of the FPGA board can be 1-bit, 2-bit, or 3-bit L1 samples. The NI (National Instruments) data acquisition card (6534) has a DMA (Dynamic Memory Access) capability that increases the speed of transferring data to the PC. There are APIs available to the user to interface its software with NI card. In this version of the software, the NI card writes the data to the file, which is later used by receiver as the source of input data. In the real time version, an interface will be implemented so that NI card can pack 1 ms of data and send it to correlation component of the software receiver.
noted that the remaining two satellites can still be “tracked” in the sense that the Doppler and code phase is constantly being updated. The real problem is that receiver cannot successfully synchronize with the subframe in order to compute a pseudorange measurement. It was observed that C/N0 for these satellites were lower than other 6. Increasing the coherent and non-coherent integration time and implementing a FIR filter in the front end may fix this problem and improve satellite availability. PERFORMANCE TIME Table 1 summarizes the performance test results. For each version of the code or each platform, 30 independent runs were made. The result in the table is the average time to process 30 seconds of GPS data while tracking 6 satellites. Table1. Performance comparison Processor Algorithm Processing Improvement time (s) with MMX Pentium 4 No MMX 70.1 ( 1.7 GHz) 256 MB With 19.0 72.9% RAM MMX Pentium 4 (2.43GHz) 512 MB RAM
No MMX
63.0
-
With MMX
18.5
70.6%
The above results show a significant improvement in speed with MMX technology. In the “No MMX” version, the processing algorithm is exactly the same except that the MMX instructions are not used, but rather normal integer mathematics. It can be observed that reaching the real time speed with simple C operators is impossible with current high-end general purpose processors. Further testing has shown that each satellite increases the processing time by approximately 2.5 seconds (for 30 seconds of data). Therefore, we can conclude that the current system is well capable of tracking 8 satellites in real time.
Figure 2: Data collection and test setup Data was gathered on the roof top antenna range at the University of Calgary while 8 satellites were visible. The receiver was able to successfully track 6 satellites. The following results analysis is based on processing time, tracking performance, and position accuracy. It should be
The performance measures given in Table 1 include all core signal processing, navigation processing, and receiver monitoring. The processing times do not include, however, additional processing that will be necessary to enable real-time delivery of data samples from the RF front end to the software receiver, as the current version reads data from previously recorded files. The processor requirements for this task have not yet been determined. However, it seems reasonable that less than 30% of the processor’s power will be required for this task, meaning that tracking of at least 6 channels in real time will be feasible (and likely more).
The Institute of Navigation National Technical Meeting (ION NTM 2006), Monterey, California, USA, January 18-20.
5/8
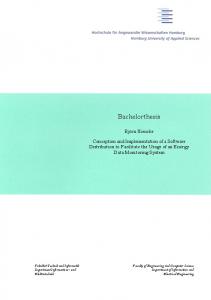
TRACKING PERFORMANCE This section presents some tracking results. All of the results were obtained from PRN 23 (elevation of 44°), but are indicative of other satellites. Figure 3 shows the C/N0 ratio calculated by the receiver. As it was expected, signal is strong since it was gathered on the roof top.
Figure 4: DLL discriminator output (PRN 23) FLL discriminator output is shown in Figure 5. It is clear that FLL is behaving nicely since the result of the discriminator is within the stability range ( ±250 Hz) for the decision-directed cross product discriminator.
Figure 3: Estimated C/N0 for PRN 23 Stability region and linear tracking region are the two typical figures of merit used to characterize the performance of a discriminator. When in its stability region, the discriminator response will have the same sign as the input error. This means that discriminator will react in the correct direction and will converge towards zero error. The linear region, on the other hand, is defined as the region where discriminator response is equal to the input error. This means that for a certain input error, the discriminator will react perfectly. Figure 4 shows the DLL discriminator value for PRN 23 during tracking. It can be observed that, most of the time, the discriminator value remains within the linear tracking range of the dot product discriminator, which is ±75 m when using a 0.5 chip early-late spacing. It can also be observed that this value always remains in the stable region of the discriminator which is ±300 m. Therefore, it shows a good code tracking performance for the receiver.
Figure 5: FLL discriminator output (PRN 23) Figure 6, showing the Doppler for PRN 23 during the tracking, also confirm this result. A 1 ms integration (FLL Bandwidth of 10 Hz , second order loop) was used in the test. Doppler appears somewhat noisy, which could be due to the short integration time (1 ms).
The Institute of Navigation National Technical Meeting (ION NTM 2006), Monterey, California, USA, January 18-20.
6/8
integration time or tracking loop bandwidth. Table 2 shows the RMS errors for position (north, east and up) and their corresponding DOP. The errors are within the reasonable range (meter level). Table 2 results also show a direct relation between the DOP and the size of errors.
Figure 6: Doppler value for PRN 23 It is also important to look at the IP and QP values during the tracking. When the signal is correctly tracked the Q component is minimized, and therefore appears to have a noise-like behavior, while the I component contains all of the signal power and indicates the transition of the navigation data bits. Figure 7 shows this situation and the data bits are clearly visible.
Figure 8: Scatter plot of North and East errors
Figure 9: Position error versus time Figure 7: IP and QP value during tracking POSITION ACCURACY The following graphs show the position accuracy which was obtained using the software receiver. The U of C’s roof top antenna range has precisely known coordinates for comparison with software receiver results. The solution was computed using the PLAN group’s C3NAVG2™ software. C3NAVG2 ™ uses a simple epochby-epoch least squares algorithm. Even though C3NAVG2™ offers a carrier-smoothing option, it could not be used herein due to the absence of carrier phase measurements from the software receiver. Consequently, the results shown in Figures 8 and 9 were obtained using the software receiver pseudorange measurements only. The level of accuracy obtained here is slightly worse than that obtained with typical commercial receivers. However, this accuracy could be improved by tuning some tracking loop parameters such as coherent
Table 2. Position error statistics Parameter North East Up DOP 1.3 0.7 2.2 RMS Error 5.1 m 2.5 m 17.0 m As mentioned above a static receiver was used in the experiment. Figure 10 shows the velocity errors which have an RMS value of 0.14 m/s for north, 0.11 m/s for east and 0.29 m/s up.
The Institute of Navigation National Technical Meeting (ION NTM 2006), Monterey, California, USA, January 18-20.
7/8
Division(September 21-24, 2004, Long Beach, CA) 947955 Julien, O. (2005) Design of Galileo L1F Receiver Tracking Loops. PhD Thesis, published as Report No. 20227, Department of Geomatics Engineering, The University of Calgary. Kaplan, E. D. (1996), Understanding GPS, Principles and Applications, Boston: Artech House, Inc.
Figure 10: Velocity error versus time CONCLUSION AND FUTURE WORK In this paper the development and initial testing of a highperformance GPS software receiver developed by PLAN group was reviewed. The effects of MMX technology and re-designed algorithms on the speed of the software were also examined in this paper. It was shown that an improvement in processing speed of over 70% is achievable through MMX technology, yielding a receiver that is well capable of tracking 6 channels in real time. Code and carrier tracking performance were satisfactory despite the short integration time used. RMS of position and velocity error was at meter and decimeter per second level. Interfacing the software with the front end is one of the major tasks remaining to be done, as well as further development of PLL tracking and extending the coherent integration time to more than 1 ms.
Ledvina, B.M., M.L. Psiaki, S.P. Powel, and P.M. Kintner (2003), A12-Channel Real-Time GPS L1 Software Receiver, Proc. of institute of Navigation National Technical Meeting (January 22-24, 2003 Anaheim, CA) 767- 783 Ma, C, G. Lachapelle & M.E. Cannon, Implementation of a Software Receiver, ION GNSS 17th International technical Meeting of Satellite Division (September 21-24, 2004, Long Beach, CA) 882-893. Skone, S., G. Lachapelle, D. Yao, W. Yu and R. Watson (2005) Investigating the Impact of Ionospheric Scintillation using a GPS Software Receiver. Proceedings of GNSS 2005 (Session C3, Long Beach, CA, 13-16 September). Tsui, James B-Y. (2000), Fundamentals of Global Positioning System Receivers: A Software Approach, John Wiley & Sons Inc. Van Dierendonck, A.J. (1996), Global Positioning System: Theory and Applications, Volume I, Chapter 8: GPS Receivers, AJ Systems, Los Altos, CA 94024. Inc. Zheng, B. and G. Lachapelle (2005) GPS Software Enhancements for Indoor Use. Proceedings of GNSS 2005 (Session C3, Long Beach, CA, 13-16 September).
The SSE2 (Streaming SIMD Extension 2) extension, which is similar to MMX and is offered by Intel, may further improve the performance of the real-time receiver on general purpose platforms. SSE2 has 128 bit registers, which in turn double the amount of parallelism in the software. Further improvements in performance are expected with the use of SSE2. REFERENCES Akos, D.M., P.L. Normak, A. Hansson, A. Rosenlind, Enge.P,(2001), Real-Time GPS Software Radio Receiver, Proc, of institute of Navigation 2001 National Technical Meeting (January 22-24, 2001,Long beach, CA) 809-816. Heckler,G.W & James L.Garrison (2004), Architecture of a Reconfigurable Software Receiver, ION GNSS 17th International technical Meeting of Satellite
The Institute of Navigation National Technical Meeting (ION NTM 2006), Monterey, California, USA, January 18-20.
8/8