Implicit Profiling for Contextual Reasoning About Users’ Spatial Preferences E. Mac Aoidh1 , M. Bertolotto1 , D. Wilson2 1
School of Computer Science and Informatics, University College Dublin. {eoin.macaoidh, michela.bertolotto}@ ucd.ie 2 Department of Software and Information Systems, University of North Carolina at Charlotte.
[email protected]
Abstract. Information overload is a well documented problem in many application domains. A way of addressing this problem is by creating user profiles and by filtering out all irrelevant information while presenting the users only with information that matches their interests. Our focus is on the spatial domain. We follow an implicit profiling approach by logging users’ mouse movements as they interact with spatial data. The logged information is analysed to support context reasoning about each user’s level of interest in the spatial features shown to him. These inferred interests are used to calculate an interest model for each individual user. Based on this interest model we can filter the information returned to the user, reducing information overload and tailoring the content to suit the users spatial preferences. In this paper we present our approach and discuss the implementation of the system we are developing for capturing users’ spatial interactions and generating user profiles.
1
Introduction
Given the ever increasing information overload problem in the most diverse application domains, effective ways of overcoming the practical impediments it generates are being researched. Personalisation techniques aim at enhancing and enriching user experience in interacting with a system by presenting only information that is relevant to the user’s personal interests. However, such techniques must address several challenges. Inferring user interests and understanding when they change are examples of critical issues within this research area. Effective solutions to these challenges should result in the ability to deliver personalised content to the user. These solutions are currently lacking in many research fields. Our focus is on spatial applications, i.e., domains in which spatial data is being handled and manipulated for diverse tasks. Our approach implicitly monitors all user interactions with the system. In particular we log all mouse movements. This logged information is then analysed to support contextual reasoning about the level of interest users have in the spatial features presented to them. Our aim is to provide effective personalisation to assist users in completing their tasks.
By creating a visualisation of a user’s logged interactions, we wish to expose the mapping between a user’s task, and their interface behaviour. The visualisation tool was created as an aid for the system developers to improve the system design, and to fine tune the personalisation technique implemented within the system. This paper details our work in progress, and presents preliminary evidence based on a small sample of volunteers to suggest that users can be distinctly categorised based on their interaction behaviour, and that these categorisations may allow us to make inferences as to the user’s context and preferences using CBR techniques. Some of the issues we are currently researching in order to provide a visualisation of user interactions, and to use this visualisation tool to lead to the personalisation of user sessions are also addressed. The case study for our work is provided by the spatial data contained in the TArcHNA (Towards Archaeological Heritage New Accessibility) system. Such a system is being developed in the context of an EU funded project aimed at improving the dissemination of archaeological heritage information through the use of digital maps and an interactive, adaptive GIS interface that relates the Etruscan archaeological findings with their surrounding area. Different kinds of users of the TArcHNA system have different information manipulation needs depending on their context. For example tourists on holiday in the area might require a general overview of the entire dataset, a sampling of the data to gain an understanding of the heritage site. In contrast, an archaeology student using the system remotely over a number of sessions, might be interested in a specific subset of information. Although our experiments are conducted with this specific dataset, we have adopted a flexible approach, which could adapt to data from any domain, for example the dataset could be changed to recreational amenities in a particular area, or cultural sites in another area. The remainder of the paper is organised as follows: Section 2 discusses related work. Section 3 provides an outline of our information collection, visualisation, and interest model creation techniques for personalisation. Section 4 outlines our preliminary experiments, and provides an indication of our early results. Finally, we conclude with some thoughts on future work.
2
Related Work
Some approaches to personalisation applicable to areas like GIS (Geographic Information Systems) and LBS (Location-based Services) have been proposed, such as those outlined in [1–3]. In order to produce personalised applications, a user profile must be obtained by explicit or implicit techniques. Explicit techniques interrupt the user’s natural browsing patterns to obtain feedback and can be irritating for the user, often proving detrimental to the user’s experience in the long run. Implicit techniques (discussed in detail by [4]) are unobtrusive to the user’s behaviour and go unnoticed as he goes about his task. We have adopted an implicit approach to profiling. Actions such as zooming in on a feature inherently indicate an interest, while others, such as removing a feature from a map indicate disinterest. Studies have shown that by personalising a user’s session,
his interaction experience can be improved (for example in terms of the content provided for future sessions being more relevant to the user, allowing him to focus on the required information [1, 5]). An overview of the approach we are following is presented in [6] and [7]. In this paper we present new approaches to study users’ behaviour by subdividing them into categories characterised by specific browsing patterns. Research such as [8] and [9] have successfully shown a correlation between user’s thoughts, eye movements and mouse movements with non-spatial data. This field remains unexplored in relation to spatial data. Cox & Silva [9] conducted eye tracking and mouse movement correlation studies in non spatial (file menu selection) experiments. They identified three distinct groups; 1) Mouse On Side (MOS) where the user left his mouse to the side of the menu while his eyes located the target, once the target was located the mouse was moved to the target. 2) Mouse Hovering Target (MHT) Where the user hovered his mouse over the target while his eyes scanned the remainder of the menu, and 3) Mouse With Eyes (MWE) which is characterised by the user’s mouse closely following the user’s eye movements. Though we do not make use of eye tracking, we have identified user categories with evidence of similar parallels to Cox & Silva’s categories. The relevance of these categories to our work are discussed in section 4.1.
3
Approach
The TArcHNA system contains both geographic, spatial information and archaeological information. It has been developed as a Java web-based application. The interface and its functionality are based on OpenMap [10]; an open source Java-based mapping toolkit provided by BBN Technologies. The system implementation is documented in detail in [11]. Both desktop and mobile, on-location versions of the system are available, however our current research focuses on the desktop application. The user interface consists of two interconnected browsers, displayed side by side. The spatial browser displays the map to the user, and allows for browsing of the map. When a user clicks on an object to view its corresponding archaeological information, it is displayed in the information browser on the opposite side of the display. As the user interacts with the system, his actions are logged by both browsers. The spatial browser logs each and every mouse movement. The latitude, longitude, duration in each position, and map scale at the time of movement are recorded in an Oracle 9i spatial database. In addition to this information, the user’s map browsing pattern is also recorded. This includes pan, zoom and re-centering actions. The archaeological information browser logs mouse dwell time (if any) and location in relation to the underlying textual information displayed in the browser. An interest determining algorithm (described in detail in [6]) considers each element of logged information, and performs a series of calculations to produce an ordered list of the mapped objects deemed to be of interest for a given session.
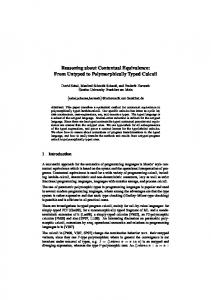
Fig. 1. Approach
The importance of a mapped object to a given user is determined by its proximity to areas which the user’s mouse dwelled in for any length of time. This distance is weighted according to the length of the dwell time and further weighted according to the map scale. By using this algorithm with information collected from the user’s browsing habits, we can implicitly determine his contextual interests by using non-intrusive methods. We also provide a visualisation interface (see figure 2), which allows for the recreation and examination of any aspect of a user’s session with respect to the logged information at any given temporal moment. This visualisation interface was produced as an aid to the interest determining algorithm development. It has allowed us to identify two distinct categories of user based on their mouse movements during our preliminary experiments which are discussed in further detail in the results section. Figure 1 details the approach we have adopted. While the user executes his task, all of his interactions are logged. When his task is complete the logged information is transmitted to a spatial database. This logged interaction information can be visualised with the visualisation interface. The interest determining algorithm runs on the information logged during a particular session and computes a ranked list of interests for that session. A ranked list of interests is produced for each session. By combining lists over multiple sessions for the same user, a user interest profile is produced. It is updated each time a new ranked list is completed. By keeping an average profile we deal with the issue of interests changing over time. In addition to automatically keeping the average the user will have the ability to access and modify his own profile.
4
Preliminary experiments
We recently conducted a series of small-scale preliminary experiments. There were twelve subjects involved in our experiments, eight of whom were from the
department of computer science. Three of the subjects were very experienced with spatial data, the remainder were indifferent. Each user was given a variety of tasks to complete, each task represented by a separate session. All of the tasks were repeated by three different users, giving us realistic data for 70 sessions, with each session completed by three different users for comparison purposes. The tasks were designed to focus users on one or two (unspecified) map objects of their choice, and required the user to state in a written answer which map objects they had examined for their answer. The evaluation of our algorithm (currently underway) compares the ranked object names output by the algorithm for the session to the object names given by the user on his answer sheet.
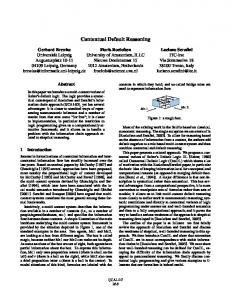
Fig. 2. Lazy mouse-mover: The visualisation interface shows where the user’s mouse rested at locations greater than 40ms. Circle sizes correspond to mouse resting duration. The crosses represent objects of archeological significance.
4.1
Results
In addition to evaluating our algorithm we sought to identify categories of users based on their mouse movements. To date we have identified two distinct movement groups; lazy mouse-movers and fast & frequent mouse-movers. These mouse-movement groups bear significant similarities to movement groups identified by Cox & Silva [9] during eye and mouse-tracking experiments with menu selection tasks as discussed in section 2. Lazy mouse-movers are comparable to Cox & Silva’s MOS (Mouse On Side) and MHT (Mouse Hovering Target). These users make slow mouse movements and only move the mouse when necessary. They rest the mouse in the last place it was used until it needs to be moved again to perform another task. Figure 2
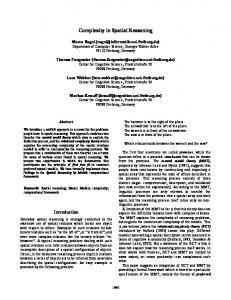
Fig. 3. Fast & frequent mouse-mover: Movements shown are places where the mouse rested for longer than 40ms. Notice the fewer number of points and the distance between each point; indicating the speed of movement.
shows a visualisation of a lazy mouse-mover’s movements for the same task as a fast & frequent mouse mover, who’s movements are illustrated in figure 3. Fast & frequent mouse-movers make exhaustive use of the mouse. The mouse is clearly used as a marker to aid the user’s thought process as he looks at the screen. These users are comparable to Cox & Silva’s MWE (Mouse With Eyes) group. Though we do not make use of eye-tracking software it is quite evident that the user’s mouse follows his eye, and thought patterns as illustrated by figure 3. The user’s mouse moves quickly and is shown to rest in no more than 20 locations for longer than 40ms, in comparison to the lazy mouse-mover in figure 2, whose mouse moves slowly, and rests in more locations at closer proximity to each other. Interests are disclosed for both kinds of user by visualising their movements, however there are distinct differences between their mannerisms. In both of the identified movement categories, the user’s thought process is reflected by his mouse interaction patterns. This is verified by examining the answers given by the users in question. Their answers identified objects in the areas where their mouse hovered longest. While it is possible to identify the objects of interest for both categories of user, they are identified with different patterns of movement. In our small scale trials the users portraying characteristics leaning toward the lazy classification were experienced users of spatial data. Fast & frequent characteristics were more synonymous with inexperienced users. We envisage that knowing the user’s mouse movement behavioural group will be of assistance in improving accuracy when determining the user’s interests, as it would be possible to modify the algorithm to work more efficiently for a specific type of user, than our current general implementation, whose accuracy is limited
by the need to cater for all kinds of user. Further to this, it would be possible to glean information about the user’s experience context, allowing for inferences to be made as to their context as a tourist or an expert user. CBR techniques could be used to enhance the accuracy of interest predictions made by our algorithm by analysing other user’s interests in similar movement categories.
5
Conclusion
In this paper we have outlined our approach to our on-going work on determining a user’s context based on his movements. We provide methods to identify a user’s context both visually with our visualisation interface, and mathematically through our algorithm. This paper focuses on the visualisation of movements to determine context. These techniques are a means for strengthening current methods for the production of an implicitly generated interest model. The resulting interest model will allow us to personalise the user’s future sessions. Eliminating extraneous data, recommending relevant data and even personalising the interface. This has the overall effect of improving the user’s experience with the system. Our future work entails a detailed examination of the results of our preliminary experiments. Further development of the system will follow, incorporating improvements deemed necessary by the experiments, followed by a detailed set of experiments including experiments using data from a different domain such as hotels in a major city. Acknowledgements: The support of the TArcHNA project, funded under the EU Culture 2000 Programme is gratefully acknowledged.
References 1. J. Weakliam, M. Bertolotto, and D. Wilson. Implicit Interaction Profiling for Recommending Spatial Content. In Proceedings of the 13th annual ACM international workshop on Geographic information systems, pages 285 – 294, Bremen, Germany, 2005. 2. T. Reichenbacher. The world in your pocket towards a mobile cartography. In Proceedings of the 20th International Cartographic Conference, pages 2514–2521, Beijing, China, August 610 2001. 3. K. Cheverst, K.and Mitchell and N. Davies. The role of adaptive hypermedia in a context-aware tourist guide. Communications of the ACM, 45(5):47–51, May 2002. 4. M. Claypool, P. Le, M. Waseda, and D. Brown. Implicit Interest Indicators. In Proceedings of the International Conference on Intelligent User Interfaces (IUI’01). ACM, January 14-17 2001. 5. J. Budzik and K.J. Hammond. User Interactions with Everyday Applications as Context for Just Intime Information Access. In Proceedings of Intelligent User Interfaces (IUI2000). ACM, 2000.
6. E. Mac Aoidh and M. Bertolotto. Improving spatial data usability by capturing user interactions. In Proceedings of AGILE 2007 (Lecture Notes in GeoInformation and Cartography), (in press). Springer-Verlag, 2007. 7. E. Mac Aoidh, M. Bertolotto, and D. Wilson. Capturing spatial interactions to personalise cultural heritage access. In Proceedings of the International Workshop on Personalization Enhanced Access to Cultural Heritage (held in conjunction with UM07) (in press), 25-29 June 2007. 8. F. Mueller and A. Lockerd. Cheese: Tracking Mouse Movement Activity on Websites a Tool for User Modeling. In Proceedings of the Conference on Human Factors in Computing System (CHI’2002), 2002. 9. A.L. Cox and M.M. Silva. The Role of Mouse Movements in Interactive Search. In Proceedings of the 28th Annual CogSci Conference, pages 1156–1162, Vancouver, Canada, July 26-29 2006. 10. Openmap. http://openmap.bbn.com/. 11. E. Mac Aoidh, A. Koinis, and M. Bertolotto. Improving Archaeological Heritage Information Access Through a Personalised GIS Interface. In Web and Wireless Geographical Information Systems, 6th International Symposium, W2GIS 2006, pages 135–145, Hong Kong, December 2006.