International Journal of Advanced Computational Engineering and Networking, ISSN: 2320-2106,
Volume-4, Issue-9, Sep.-2016
IMPROVIESED GENETIC ALGORITHM FOR FUZZY OVERLAPPING COMMUNITY DETECTION IN SOCIAL NETWORKS 1
HARISH KUMAR SHAKYA, 2KULDEEP SINGH, 3BHASKAR BISWAS 123
Indian Institute of Technology, Varanasi, (UP) India, India Email:
[email protected],
[email protected],
[email protected] 1
Abstract: Community structure identification is an important task in social network analysis. Social communications exist with some social situation and communities are a fundamental form of social contexts. Social network is application of web mining and web mining is also an application of data mining. Social network is a type of structure made up of a set of social actors like as persons or organizations, sets of pair ties, and other interaction socially between actors. In recent scenario community detection in social networks is a very hot and dynamic area of research. In this paper, we have used improvised genetic algorithm for community detection in social networks, we used the combination of roulette wheel selection and square quadratic knapsack problem. We have executed the experiment on different datasets i.e. Zachary’s karate club [31], American college football [39], Dolphin social network [32] and many more. All are verified and well known datasets in the research world of social network analysis. An experimental result shows the improvement on convergence rate of proposed algorithm and discovered communities are highly inclined towards quality. Index term: community detection, genetic algorithm, roulette wheel selection, optimization problem, which involves a quality function first defined by Newman and Girvan [3],
I. INTRODUCTION A social network is a branch of data mining which involves finding some structure or pattern amongst the set of individuals, groups and organizations. A social network involves representation of these societies in the form of a graph with the individuals as the vertices and the relationship among the individuals being represented by the edges [1]. Certain individuals of a social network are said to belong to a community if they have large number of interconnections. Similarly two individual communities will have less number of connections between them. In normal terms, community structure is defined as the groups of vertices such that the number of edges within the individuals of each group is greater than the number of edges that connect the individuals of this group to the rest of the groups in the community network. This complete process of finding the exact community structure of any given social network is called community detection in social network [2].Community structure in any given social network gives us an indication of some important pattern which may be hidden on normal analysis, and thus can help us to understand a lot of processes and phenomenon of social networks and communities better. This also helps when someone makes an application using the social network and its communities. The validity of the methods used for community detection in social networks is based on the “goodness” of the found communities, which is evaluated with the help of some quality function. The problem of identifying different communities in given social networks has been changed into an
and this quality function, called modularity, gave an approximate measure of the validity of the formed community structure. For each subset, the partition is said to be better, if the number of excess of links in each module is larger than the number of excess of links in the random case. So, the best partition of the given social network will be the one in which the modularity has maximum value. Optimizing the value of the modularity of a community structure is a challenging task, since when the size of the social network increases, the number of partition will increase in at least exponential relation with the size. It has been recently proved that optimizing the modularity of a community structure for a given social network is an NP-complete problem, [4] so it is not possible to find the exact optimum value of modularity in polynomial time with the help of a deterministic algorithm but we can find a good approximate solution in polynomial time using various techniques, like greedy agglomeration [5][6], simulated annealing[7][8][9], extremal optimization [10] and spectral division [11]. Community detection in social networks can be done with the help of genetic algorithm [12].The basic structure of a genetic algorithm involves three steps: Selection operation, crossover operation and mutation operation [13]. Selection operation involves selecting a certain fraction of individuals from the network as it is and copying them to the next generation. This selection is made for the best communities. This is in
Improviesed Genetic Algorithm for Fuzzy Overlapping Community Detection in Social Networks 43
International Journal of Advanced Computational Engineering and Networking, ISSN: 2320-2106,
time complexity O(m2n) for a graph with n vertices and m edges. The steps of this algorithm include centrality computation, removal of edge with largest centrality, recalculation of centrality and iteration of the cycle from step 2. Modularity Maximization [17]: This is the most widely used method. Modularity function measures quality of the community structure. In modularity maximization method, we search over all possible division of the network and obtain the division with high modularity. But this solution n intractable. Approximate solutions are made. Some of these approximate optimization method include greedy algorithms, simulated annealing and spectral optimization. The first greedy algorithm was proposed by Newman. This algorithm tends to form large community. In simulated annealing, the probabilistic procedure is followed and the global optimum of a function is found. Modularity optimization fails to detect clusters smaller than a particular value called resolution limit. In Fuzzy community detection algorithms, we define a soft membership vectors or belonging vector for each node. This is used to quantify association strength in each community. The following researches have been made in this field: Nepusz used simulated annealing [18] method. He converted the problem into a non-linear constraint optimization problem. Zhang used spectral clustering [19] framework and proposed an algorithm to do effective division of social network into communities. He used Fuzzy C-Means clustering [20] (FCM) to obtain the soft assignment. Users specify an upper bound to the number of communities. If this upper bound is k then, only the top k-1 Eigen vectors are computed. Both, accuracy and time complexity rely on the value of k. In 2007, Newman and Leicht used a mixture models [21] and provided an appropriate Fuzzy community detection method. This was possible only due to probabilistic nature of the algorithm. In this, the number of communities is same as the mixture models. This number needs to be specified in advance. Researchers are being made in the field of fuzzy community detection using evolutionary algorithms. The following models were developed in the past: Modularity-based Model: In 2004, Newman and Girvan devised an evaluation criteria called modularity denoted by Q. This criterion takes into account that the number of edges within a community are maximised and the inter-community edges are minimised. Higher the value of modularity, the better the solution is. However, this approach had several drawbacks [22]. Firstly
consistence with biological genetics assuming that a certain fraction of best or most fit individuals will survive. The crossover operation is like reproduction in biology. This involves mixing the genes of two individuals. Similarly in case of community detection, two individuals are crossover to form a new individual in next generation. This individual has some of the genes of one parent and some of them of the other one. Mutation operation is identical to biological mutation in which some of the individuals adapt to form new species with changed genetic material. Similarly, in community detection using genetic algorithm, we modify the genes or characteristics of some percentage of individual to form a new species in next generation. Three types of partitions, possibilistic partitions, fuzzy partitions, and crisp/hard partitions for communities are possible. For fuzzy community partition, fuzzy c-means clustering [14] is used. II. LITERATURE REVIEW Community detection is an important research topic in the field of complex networks. Genetic algorithms have been used as an effective optimization technique to solve this problem. The earliest method was called the minimum-cut method. Then hierarchical clustering method came up. This was followed by Girvan Newman algorithm which was further optimized using modularity maximization. The algorithms in detail are:
Volume-4, Issue-9, Sep.-2016
Minimum-Cut Method [15]: In this method the number of partition was predetermined and then the network was divided. It was ensured that the division was such that the community was of approximately the same size. Also the number of intergroup edges is minimized. This method is less than ideal as it finds only a fixed a number of communities. Hierarchical Clustering [16]: In hierarchical clustering, a similarity measure is defined. This quantifies topological type of similarity between nodes. Method used includes cosine similarity, jaccard index and haming distance between adjacency matrix rows. Similar nodes where grouped into one community. Two methods were used for this grouping: Single linkage clustering and complete linkage clustering. In the former, two groups are different iff all pair of nodes in different groups have similarity less than a given value. In the later, all pair of nodes within a group has similarity greater than a threshold. Girvan Newman Algorithm: Edges that lie between two communities are identified and removed. Identification is performed by between-ness measure in which a number is assigned to each edge. This number is large if edge lie between many pair of nodes. This algorithm gives quality result but is slow with
Improviesed Genetic Algorithm for Fuzzy Overlapping Community Detection in Social Networks 44
International Journal of Advanced Computational Engineering and Networking, ISSN: 2320-2106,
optimizing Q has been categorised as an NPhard problem. Secondly, large Q values don’t always prove better community partition as random networks with no community structures can also have high Q values. Thirdly and most importantly, Q has a resolution limitation, i.e. community with sizes smaller than a threshold value are not detected. Multi-resolution Model [23]: This model was introduced to overcome the resolution limitation problem of modularity model. Pizzuti, in 2008, proposed a genetic algorithm for community detection using multi-resolution model. In this a community score evaluation is done taking into consideration that the number of edges within a community are maximised and the inter-community edges are minimised. General Model: As we know for the best community partition dense links within the community should exist and sparse links between two communities should exist. Pizzuti and Pizzuti proposed an algorithm called MOGANet. In this he used fast elitist genetic algorithm for sorting which was nondominated. They defined two parameters, Community Scores (CS) and Community Fitness (CF). Butul and Kaya improved the MOGANet by using meta-heuristics [24]. They used enhanced firefly algorithm [25] followed by harmony search algorithm [26] and chaotic local search. Zhang and Li proposed a decomposition based method [27]. Signed Model: Signed networks are networks in which the vertices have friendly or hostile relation between each other depending on the sign assigned to them. Gong, in 2014, proposed a PSO framework which included two parameters, Signed Ratio Association (SRA) and Signed Ratio Cut (SRC). In 2013, Amelio and Pizzuti put forward a model using NSGA2 framework. Overlapping Model [28]: A consideration was taken that a node that connects multiple communities with similar strength may be fuzzy. For example, if a node i has l links to both community A and B then i must be a fuzzy node. Dynamic Model: Dynamic model takes into consideration evolving networks. This is a model which can be used in case some of the nodes or edges disappear. Dynamic networks help in predicting change tendency. Thus community detection is challenging in dynamic networks. In 2010, Folino and Pizzuti used Temporal Smoothness Framework, i.e. they ignored changes in the community for a short period
Volume-4, Issue-9, Sep.-2016
of time. A bi-objective optimization problem was proposed to solve community detection in dynamic networks. Normalized mutual Information [29] (NMI) is a similarity index used in Information Theory. Given A and B as two partitions of network NMI (A, B) gives the similarity between the two partitions. If NMI (A, B) = 1 the partition is same. If NMI (A, B) = 0 then the partition is completely different. III. PROPOSED WORK In this paper, we have done different type of experiments on genetic algorithm and check the performance of modified GA. I have done the modification in the algorithm but not change in internal architecture. Input: In this Genetic algorithm, input datasets in the form of adjacency matrix and some other input parameters given below in Table 1. And Table 2. Parameter Value Description m 1.7 Used in determining the membership of each node cp 0.1 Percentage of individual selected directly npc 10 Number of individuals with given number of partition pm 1.0 Mutation percentage pc 0.9 Cross-over percentage Occmax 10 Number of occurrences of generation with termination condition 10-5 Termination condition
ᵋ
tmax cmin
100 2
Number of iterations Minimum number of partitions of social network cmax 10 Maximum number of partitions of social network Table 1: Values of different parameters Output: partition and the cover matrix (U). Terminal condition: return the best individuals. Dataset Symbol Vertices Edges Karate K 34 78 Dolphin D 62 159 PolBooks P 105 441 Football F 115 613 Jazz J 198 2742 Sawmill S 36 62 LesMis L 77 254 Words W 112 425 Metabolic M 453 2025 Table 2: Description of the datasets used We proposed the following two changes in GAFCD [30] to improve the final modularity value and NMI value for the fuzzy community detected: While calculating the modularity value (Q-value), we calculated the contribution of each community
Improviesed Genetic Algorithm for Fuzzy Overlapping Community Detection in Social Networks 45
International Journal of Advanced Computational Engineering and Networking, ISSN: 2320-2106,
separately, while also maintaining the combined Qvalue of each individual of the population. Q value was given by the trace of a c*c matrix, where c=number of communities. The matrix was given by U*B*U'. So for all of the c communities present in this matrix, we stored the diagonal values in a vector called Q per community. In the fuzzy crossover function, after applying Roulette wheel selection for calculating the optimal number of communities in the crossover child, random selection of individual communities was done from the union of the communities of the two parents. Instead of doing a random selection in this step, we used the Q per community vector calculated above to select the individual communities from the union. We applied Roulette wheel selection in this step. Experiment analysis The experiment was conducted on Microsoft Windows 10 Home Single Language ©2015 64 bit operating system using a MATLAB 11 programming platform with Intel (R) Core-i5 1.70 GHz processor and 8.0 GB RAM. Datasets description In this experiment, we have to use the number of well known datasets in the form of adjacency matrix. All the employed dataset description is given below. 1) KARATE: This dataset is about study of a karate club network by Zachary. The network consists of 34 members of a karate club as nodes and 78 connections among members representing friendships in the club which was observed over a period of two years [31].
Volume-4, Issue-9, Sep.-2016
to indicate the frequency with which they discussed work matters with each of their colleagues on a 5 point scale ranging from less than once a week to several times a day. Two employees were linked in the communication network if they rated their contact as three or more. We do not know whether both employees had to rate their tie in this way or that at least one employee had to indicate strength of three or more [35]. 7)LESMIS: Co-appearance network in the novel LesMis [36]. 8) WORDS: Adjacency network of common adjectives and nouns in the novel David Copperfield by Charles Dickens [37]. 9) METABOLIC: KEGG Metabolic pathways can be realized into network. Substrate or Product compound are considered as Node and genes are treated as edge [38]. IV. EXPERIMENTAL RESULT & ANALYSIS We compare MGAFCD with GAFCD, MSFCM and GALS on 10 real-world data sets that are described in Table II. Metabolic Network is an undirected, weighted graph, but it has 15 loops or selfconnections (none of the algorithms here can handle these loops). Here, we simply remove these loops to make Metabolic Network a simple graph. Karate and LesMis datasets are weighted and undirected, while all the other data sets are undirected and unweighted. . The different steps involved in SGA are: Initialization: Before evolution, a population of individuals are randomly initialized. Fitness Evaluation: In every iteration, the competitiveness of individuals is first evaluated on the basis of a quality function and a fitness score is assigned to each individual by this quality function. m= 1.7, npc=10. 10 partitions with each community size from cmin to cmax are generated and taken as single individuals. Population size=npc*(cmax-cmin+1) Survival of the Fittest: Individuals are selected for crossover and mutation with pre-define probabilities pc and pm respectively. pc= 0.9, pm=1.0, cp=0.1 Evolution: The selection process guarantees that an individual with a higher fitness score will be chosen with a higher probability. Iteration: After a new generation is produced, SGA terminates and returns the best individual of the current generation if some stopping conditions are satisfied. Number of iterations=100
2) DOLPHIN: Bottlenose dolphin’s network study of dolphins living in Doubtful Sound, New Zealand is also used for evaluating communities. The network was divided into two groups depending on the association patterns of dolphins [32]. 3) POLBOOKS: A network of books about recent US politics sold by the online bookseller Amazon.com. Edges between books represent frequent copurchasing of books by the same buyers. The network was compiled by V. Krebs and is unpublished, but can found on Krebs' web site [33]. 4) FOOTBALL: A dataset showing the fixtures, results and attendance of football games played by Leeds United football teams [39]. 5) JAZZ: This is the collaboration network between Jazz musicians. Each node is a Jazz musician and an edge denotes that two musicians have played together in a band [34]. 6) SAWMILL: This is a communication network within a small enterprise: All employees were asked
Improviesed Genetic Algorithm for Fuzzy Overlapping Community Detection in Social Networks 46
International Journal of Advanced Computational Engineering and Networking, ISSN: 2320-2106,
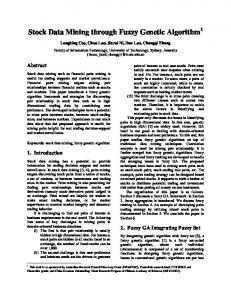
Figure 3: Jazz, Q=0.4452, c=4 Figure 4: Metabolic, Q=0.4447, c=9
Figure 1: Dolphin, Q=0.5285, c=5 Figure 2: Karate, Q=0.4449, c=4
nodes respectively. This partition gave a Q value of 0.4449. Figure 3 represents partition of Jazz dataset. It forms 4 communities with 53.4, 62, 21.6 and 61 nodes respectively. This partition gave a Q value of 0.4452. Figure 4 represents partition of metabolic dataset. It forms 9 partitions with 36.75, 60, 44, 11, 74, 107.25, 7, 93 and 20 nodes respectively. This partition shows a Q value of 0.4447.
In this paper, Fig 1,2,3,4 represents fuzzy community partitions of our given dataset or social network. In these figures, relative sizes of each of the communities are shown. Figure 1 represents partition of Dolphin dataset. It forms 5 communities with 12, 20, 9, 16 and 5 nodes respectively. This partition gives Q value as 0.5285. Figure 2 represents partition of Karate dataset. It forms 4 communities with 5, 6, 11 and 12
Algo. MSFCM
mean Q
GAFCD
std Q GALS
Volume-4, Issue-9, Sep.-2016
K
D
P
F
0.4129
0.3963
0.4596
0.5266
0.0001
0.0043
0.0009
0.4449
0.5285
0 0.4449
S
L
W
M
0.398
0.3279
0.4897
0.0052
0.2588
0.0008
0.02
0.0001
0.0108
0.0013
0.0118
0.5272
0.6046
0.4452
0.5501
0.5667
0.3107
0.4261
0.0001
0
0
0
0
0
0.0009
0.0014
0.5282
0.5272
0.6045
0.4448
0.5501
0.5313
0.3094
0.4153
0.0004
0
0.0003
0.0001
0
0.0013
0.002
0.0068
0.4449
0.5285
0.5275
0.6046
0.4452
0.5503
0.5667
0.3107
0.4415
0
0
0
0
0
0
0
0.0005
0.005
0
J
MGAFCD
Improviesed Genetic Algorithm for Fuzzy Overlapping Community Detection in Social Networks 47
International Journal of Advanced Computational Engineering and Networking, ISSN: 2320-2106,
MSFCM
Q
best
GAFCD
c GALS
MGAFCD
Volume-4, Issue-9, Sep.-2016
0.4132
0.3991
0.4601
0.5268
0.4078
0.328
0.4971
0.0083
0.2876
3
4
3
10
4
5
5
9
7
0.4449
0.5285
0.5272
0.6046
0.4452
0.5501
0.5667
0.3126
0.4287
4
5
5
10
4
4
6
7
9
0.4449
0.5285
0.5272
0.6046
0.4449
0.5501
0.5439
0.3121
0.428
4
5
5
10
4
4
6
7
18
0.4449
0.5285
0.5275
0.6046
0.4452
0.5503
0.5667
0.3126
0.4447
4
5
5
10
4
4
6
7
9
Table 3: Compared Performance Of Community Detection Algorithms Table 3 shows the values that we compared between the MSFCM, GAFCD, GALS and our algorithm, GAFCD. It involves modularity values, i.e. Qbest, Qstd and Qmean. In that experiment, MGAFCD modularity values increased by an approximate factor of 0.02 in the metabolic dataset and more datasets. We also received improved values of Qstd in comparison to MSFCM, GALS algorithm for all datasets. For some of the smaller datasets like Dolphin, Qstd decreased (and thus improved) in comparison to GAFCD. But, for some of the bigger datasets like Metabolic, this value increased, making the communities found a bit inconsistent, though with better modularity. In datasets like Karate, Dolphin and Football, partition found is crisp as was in the implementation of GAFCD. But for datasets like Jazz and Metabolic, fuzzy communities are observed. GAFCD and MGAFCD has same number of communities for Metabolic dataset but different Q values. This is in consistence with the fact that we have selected the optimal number of communities in the way similar to the way GAFCD did. But, we have improved the algorithm in selection of communities that form the next generation individual. Thus, it shows same number of communities but different modularity value.
communities ranging from 2 to c1+c2. We calculated average fitness for all the communities with a given number of partitions. Then Roulette Wheel selection was done to obtain the optimised number of communities in the child. Then mutation was done which involved modifying each column of partition using qpip solver assuming that the other columns remain the same. The modification we did proved effective for large dataset like metabolic as it used informed selection. It was not quite effective for smaller datasets as random selection and informed selection will select almost the same set of communities. Also, mutation operator will modify the partition of smaller datasets easily thus eliminating the need for informed selection. Whereas, in case of large datasets, the modification increased the modularity values and made a difference. We can further modify the algorithm by including nonmutated partitions in the set as well. In the future, we will put our efforts to enable our GAFCD workable for large social networks. With the assumption that large social networks are usually sparse graphs, we will attempt to reduce the time cost for computing Qg for a fuzzy partition. Meanwhile, we will work towards a new effective and but more efficient algorithm to replace the current mutation operator.
CONCLUSION & FUTURE WORK
REFERENCES
We have a successfully modified the existing GAFCD algorithm. The existing GFCD algorithm did the following: It made a fuzzy partition of the network using one step FCM initialization. It treated each partition as an individual. The modularity value for the partition was used as the objective function to evaluate each partition. These partitions were then sorted according to these modularity values. Then certain percentage of individuals was directly selected for the next generation. Next, crossover was done. In this we combined the two parents. Suppose parent 1 has c1 communities and parent 2 has c2 communities. Then the child made can have the number of
[1]
[2] [3]
[4]
[5]
Wasserman, Stanley; Faust, Katherine (1994). "Social Network Analysis in the Social and Behavioral Sciences". Social Network Analysis: Methods and Applications. Cambridge University Press. pp. 1– 27.ISBN 9780521387071. S. Fortunato, “Community detection in graphs,” Physics Reports, vol. 486, pp. 75–174, 2010. M. E. J. Newman and M. Girvan, “Finding and evaluating community structure in networks”, Phys. Rev. E 69, 026113, 2004. U. Brandes, D. Delling, M. Gaertler, R. Goerke, M. Hoefer, Z. Nikoloski and D. Wagner, “Maximizing modularity is hard”, physics/0608255 in www.arxiv.org. M. E. J. Newman, “Fast algorithm for detecting community structure in networks”, Physical Review E 69, 066133, 2004.
Improviesed Genetic Algorithm for Fuzzy Overlapping Community Detection in Social Networks 48
International Journal of Advanced Computational Engineering and Networking, ISSN: 2320-2106, [6]
[7]
[8]
[9] [10]
[11]
[12]
[13] [14]
[15]
[16]
[17]
[18]
[19]
[20] [21]
[22]
[23]
A. Clauset, M. E. J. Newman and C. Moore, “Finding community structure in very large networks”, Phys. Rev. E 70, 066111, 2004. R. Guimer`a, M. Sales-Pardo and L. A. N. Amaral, “Modularity from fluctuations in random graphs and complex networks”, Phys. Rev. E 70, 025101(R), 2004. R. Guimer`a and L. A. N. Amaral, “Functional cartography of complex metabolic networks”, Nature 433, pp. 895-900, 2005. J. Reichardt and S. Bornholdt, “Statistical mechanics of community detection”, Physical Review E 74, 016110, 2006. J. Duch and A. Arenas, “Community detection in complex networks using extremal optimization”, Phys. Rev. E 72, 027104, 2005. M. E. J. Newman, “Modularity and community structure in networks”, Proc. Natl. Acad. Sci. USA 103, pp. 8577–8582, 2006. Pizzuti, “Community detection in social networks with genetic algorithms,” in Proceedings of the 10th annual conference on Genetic and evolutionary computation. ACM, 2008, pp. 1137–1138. John Holland, Adaptation in Natural and Artificial Systems (1975), University of Michigan Press, ISBN 0-262- 58111-6 Zhang et al. 2007a Identification of overlapping community structure in complex networks using fuzzy c-means clustering. Physica A374, 483–490. Goemans, Michel X.; Williamson, David P. (1995), "Improved approximation algorithms for maximum cut and satisfiability problems using semidefinite programming", Journal of the ACM 42 (6): 1115– 1145, doi:10.1145/227683.227684 Hastie, Trevor; Tibshirani, Robert; Friedman, Jerome (2009). "14.3.12 Hierarchical clustering". The Elements of Statistical Learning (PDF) (2nd ed.). New York: Springer. pp. 520– 528. ISBN 0-387-84857-6. Retrieved 2009-10-20. Newman, M. E. J. (2006). "Modularity and community structure in networks". Proceedings of the National Academy of Sciences of the United States of America 103 (23): 8577– 8696. arXiv:physics/0602124. Bibcode:2006PNAS..103.8577 N. doi:10.1073/pnas.0601602103. PMC 1482622. PMID 167 23398. Kirkpatrick, S.; GelattJr, C. D.; Vecchi, M. P. (1983). "Optimization by Simulated Annealing". Science 220 (4598): 671– 680. Bibcode:1983Sci...220..671K.doi:10.1126/science.220.4 598.671. JSTOR 1690046. PMID 17813860 Arias-Castro, E. and Chen, G. and Lerman, G. (2011), "Spectral clustering based on local linear approximations.", Electronic Journal of Statistics 5: 1537– 1587, doi:10.1214/11-ejs651 "Fuzzy Clustering". reference.wolfram.com. Retrieved 201604-26. Dinov, ID. "Expectation Maximization and Mixture Modeling Tutorial". California Digital Library, Statistics Online Computational Resource, Paper EM_MM,http://repositories.cdlib.org/socr/EM_MM, December 9, 2008 Andrea Lancichinetti and Santo Fortunato (2011). "Limits of modularity maximization in community detection". Physical Review E 84: 066122. arXiv:1107.1155.Bibcode:2011PhRvE..84f6122L. d oi:10.1103/PhysRevE.84.066122 Ju Xiang, Xin-Guang Hu, Xiao-Yu Zhang, Jun-Feng Fan, Xian-Lin Zeng, Gen-Yi Fu, Ke Deng and Ke Hu (2012).
[24]
[25]
[26]
[27]
[28]
[29]
[30]
[31]
[32]
[33]
[34]
[35]
[36]
[37]
[38]
[39]
Volume-4, Issue-9, Sep.-2016
"Multi-resolution modularity methods and their limitations in community detection". European Physical Journal B 85 (10): 1–10. doi:10.1140/epjb/e2012-30301-2 Goldberg, D.E. (1989). Genetic Algorithms in Search, Optimization and Machine Learning. Kluwer Academic Publishers. ISBN 0-201-15767-5. Yang, X. S. (2009). "Firefly algorithms for multimodal optimization". Stochastic Algorithms: Foundations and Applications, SAGA 2009. Lecture Notes in Computer Sciences 5792. pp. 169–178. arXiv:1003.1466 Original Harmony Search: Geem ZW, Kim JH, and Loganathan GV, A New Heuristic Optimization Algorithm: Harmony Search, Simulation, 2001. Gottlob, Georg; Nicola Leone; Francesco Scarcello (2000). "A comparison of structural CSP decomposition methods". Artificial Intelligence 124 (2): 243– 282.doi:10.1016/S0004-3702(00)00078-3 Aliprantis, Charalambos D.; Brown, Donald J.; Burkinshaw, Owen (April 1988). "5 The overlapping generations model (pp. 229–271)". Existence and optimality of competitive equilibria (1990 student ed.). Berlin: Springer-Verlag. pp. xii+284. ISBN 3-540-52866-0.MR 1075992. Kraskov, Alexander; Stögbauer, Harald; Andrzejak, Ralph G.; Grassberger, Peter (2003). "Hierarchical Clustering Based on Mutual Information". arXiv:q-bio/0311039 Jianhai Su and Timothy C. Havens, Fuzzy Community Detection in Social Networks Using a Genetic Algortihm. 2014 IEEE International Conference on Fuzzy Systems (FUZZ-IEEE) W. W. Zachary, “An information flow model for conflict and fission in small groups,” Journal of Anthropological Research, vol. 33, pp. 452– 473, 1977. D. Lusseau, K. Schneider, O. J. Boisseau, P. Haase, E. Slooten, and S. M. Dawson, “The bottlenose dolphin community of doubtful sound features a large proportion of long-lasting associations,” Behavioral Ecology and Sociobiology, vol. 54, pp. 396–405, 2003. V. Krebs, “Books about U.S.A. politics.” [Online]. Available: http://www.orgnet.com/ [26] P. M. Gleiser and L. Danon, “Community structure in jazz,” Adv. Comlex System, pp. 656–573, July 2003. J. H. Michael and J. G. Massey, “Modeling the communication network in a sawmill,” Forest Products, vol. 47, pp. 25–30, 1997. D. E. Knuth, The Stanford GraphBase: a platform for combinatorial computing. Addison-Wesley Reading, 1993, vol. 4. M. E. J. Newman, “Finding community structure in networks using the eigenvectors of matrices,” Phys. Rev. E, vol. 74, p. 036104, Sep 2006. [Online]. Available: http://link.aps.org/doi/10.1103/PhysRevE.74.036104 J. Duch and A. Arenas, “Community detection in complex networks using extremal optimization,” Phys. Rev. E, vol. 72, p. 027104, Aug 2005. [Online]. Available: ttp://link.aps.org/doi/10.1103/PhysRevE.72.027104 R. Guimera, L. Danon, A. D ` ´ ıaz-Guilera, F. Giralt, and A. Arenas, “Self-similar community structure in a network of human interactions,” Phys. Rev. E, vol. 68, p. 065103, Dec 2003. [Online]. Available: http://link.aps.org/doi/10.1103/PhysRevE.68.065103 M. Girvan and M. E. J. Newman. Community structure in social and biological networks. Proceedings of the National Academy of Sciences, 99:7821–7826, 2002.
Improviesed Genetic Algorithm for Fuzzy Overlapping Community Detection in Social Networks 49