Improving Appearance-Based Object Recognition in Cluttered Backgrounds Andrea Selinger and Randal C. Nelson Department of Computer Science University of Rochester Rochester, NY 14627 fselinger,
[email protected] Abstract Appearance-based object recognition systems are currently the most successful approach for dealing with 3D recognition of arbitrary objects in the presence of clutter and occlusion. However, no current system seems directly scalable to human performance levels in this domain. In this paper we describe a series of experiments on a previously described object recognition system that try to see which, if any design axes of such systems hold the greatest potential for improving performance. We look at the potential effect of different design modifications and we conclude that the greatest leverage lies at the level of intermediate feature construction.
1. Introduction Object recognition is an important and much-researched problem in the study of both machine and human vision. The model-based approaches that were used until recently are severely limited in the sort of objects they can represent, and obtaining models is typically a difficult and timeconsuming process. Appearance-based object recognition methods have been proposed in order to make recognition systems more general, and more easily trainable from visual data. Most of these operate by comparing a two-dimensional, image-like representation of object appearance against many prototype representations stored in a memory, and finding the closest match. An influential example is Murase and Nayar [4]. A significant problem with this method and other early appearance-based schemes (such as Swain’s color indexing [11]) is that matches are generally made to image representations of complete objects. This requires that the image be first segmented into regions that represent entire objects. Unfortunately this kind of bottom-up high-level perceptual grouping seems to be infeasible in the presence of clutter, and is impossible in the presence of occlusion.
Later appearance-based work has addressed this problem by matching the appearance of multiple object fragments, rather than whole-object appearances. Examples include Huang and Camps [2] who use principal components of segmented regions for indexing, Schmid and Mohr [8] who use local differential invariants, Mel [3] who uses stored feature channels representing multiple low-level cues, Wang and Ben-Arie [12] who use vectorial eigenspaces derived from a small set of model shapes that are affine transformed in a wide parameter range, and the authors [5], who use contour patterns in keyed context regions. These methods represent the most successful approach to date for dealing with 3D recognition of arbitrary objects in the presence of clutter and occlusion. However, no current system appears directly scalable to human performance levels in this domain. A natural question is which, if any design axes of such systems hold the greatest potential for improving performance, and how much potential gain is present and at what cost. In this paper we describe a series of experiments that attempt to address the questions of how far performance can be pushed with various design modifications, especially in the presence of clutter and partial occlusion. In particular, we look at the potential effect of increasing the number of training views (additional brute force), modifying lowlevel feature detection, changing intermediate grouping algorithms, and improving top-level verification. Although we use a specific object recognition system [5], our results can be generalized to most feature-based recognition systems. Our conclusions are that the greatest leverage lies at the level of intermediate feature construction. This makes a certain amount of sense, as it is the use of intermediate features representing object fragments that give these techniques most of their power to begin with.
2. The object recognition system Our system takes a cubist approach to object recognition [5] and it is based on a hierarchy of perceptual grouping
processes [9]. A 3D object is a fourth-level group consisting of a topologically structured set of flexible 2D views, each derived from a training image. In these views, which represent third-level perceptual groups, the visual appearance of an object is represented as a geometrically consistent cluster of several overlapping local context regions. These local context regions represent high-information second-level perceptual groups, and are essentially windows centered on and normalized by key first-level features that contain a representation of all first-level features that intersect the window. The first level features are the result of first level grouping processes run on the image, typically representing connected contour fragments. In more detail, distinctive local features called keys, selected from the first level groups in our hierarchy, seed and normalize keyed context regions, the second level groups. In the current system, the keys are contours automatically extracted from the image. The second level of grouping into keyed context patches amplifies the power of the key features by providing a means of verifying whether the key is likely to be part of a particular object. This is necessary because the invariant parameters of the key features are relatively weak evidence. If only this weak evidence is used in an evidence combination scheme, a proliferation of high-scoring false object hypotheses results, especially when applied to complex, cluttered scenes, or when using features that are subject to partial occlusion (such as edges) [1]. The fact that the high-information units are overlapping fragments of a view gives robustness to clutter and occlusion not present in other image-based methods. Even these high information local context regions are generally consistent with several object/pose hypotheses; hence we use the third-level grouping process to organize the context patches into globally consistent clusters that represent hypotheses about object identity and pose. This is done through a hypothesis database that maintains a probabilistic estimate of the likelihood of each third level group (cluster) based on statistics about the frequency of matching context patches in the primary database. The idea is similar to a multi-dimensional Hough transform without the space problems that arise in an explicit decomposition of the parameter space. In our case, since 3-D objects are represented by a set of views, the clusters represent two dimensional rigid transforms of specific views. As mentioned above, the use of keyed contexts rather than firstlevel groups gives the voting features sufficient power to substantially ameliorate well known problems with false positives in Hough-like voting schemes. The system obtains a recognition rate of 97% when trained on images of 24 objects taken against a clean black background over the whole viewing sphere, and tested on images taken between the training views, under the same
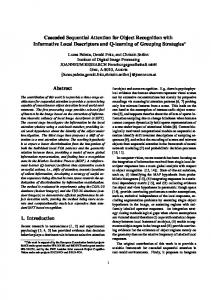
good conditions. The test objects range from sports cars and fighter planes to snakes and lizards. Some of them can be seen in Figure 1. Performance remains relatively good in the case of clutter and partial occlusion [5].
Figure 1. Some of the objects used in testing the system. The feature-based nature of the algorithm provides some immunity to the presence of clutter and occlusion in the scene; this, in fact, was one of the design goals. This is in contrast to appearance-based schemes that use the structure of the full object, and require good prior segmentation. However, we want to further improve the performance on images with complicated clutter.
3. Increasing the number of training views In our initial experiments we used 53 training images per hemisphere, spread fairly uniformly, with approximately 20 degrees between views. We increased the number of images to 105 per hemisphere, with approximately 15 degrees between views. This way our database contained more information about one object. The test images remained positioned between the training views. Some improvements were obtained for the more complicated objects that have lots of different views, such as the toy-bear. The performance for other objects, such as the fighter airplane, remained unchanged. Figure 2 shows the ROC curves describing system performance on the toy-bear (left) and on the fighter airplane (right), on a cluttered background similar to the background of the image in Figure 7. The dotted line represents the ROC curve for the initial training image set, while the continuous line represents the ROC curve obtained for the extended set. We ran these experiments on images of 6 objects. For each object the negative examples were all the images of the other objects. Overall, increasing the number of training views didn’t have much of an impact.
4. Modifying low-level feature detection One possible way of improving the recognition performance could be to increase resistance to clutter by changing the low-level feature detection. Instead of using the traditional gradient-based edge detection, we developed a new edge detection method that uses directional variances
1
1
1
0.9 0.95
0.7 0.6 0.5 0.4
0.8
0.9 0.7
0.85
Detection rate
Detection rate
Detection rate
0.8
0.9
0.3 0.2
0.8
0.1 0 0
0.6
0.5
0.4
0.1 0.2 0.3 0.4 0.5 0.6 0.7 0.8 0.9 False alarm rate
1
0.75 0
0.05
0.1 0.15 0.2 False alarm rate
0.25
0.3
0.2
Figure 2. ROC comparison for toy-bear(left) and fighter plane(right): dotted line - original database, continuous line - extended database. to locally assign two magnitudes and a direction to each potential edgel [10]. Based on the variance of the pixels in a neighborhood centered around each pixel we compute a direction indicating the best boundary direction (if there is such a boundary) and two magnitudes reflecting the evidence that there is a transition to a distinct, homogeneous region crossing the boundary in either direction. The direction and magnitude images are used in the linking step similarly to the images obtained by the gradient method. Using this method we were able to extract continuous lines on boundaries of objects on cluttered backgrounds that caused sudden contrast switches between the object and the background. An example is the synthetic image in Figure 3, where the gradient method cannot extract a continuous line on the boundary of the circle.
Figure 3. Left: synthetic image; Middle: Contour of the circle extracted by the gradient based method; Right: Contour of the circle extracted by the variance based method. Dots mark curve endpoints. Although this way we were able to extract longer curves, and thus better features for our recognition system, the recognition performance remained unchanged. An example can be seen in Figure 4, that shows the ROC curves obtained for the toy-bear on a cluttered background such as in Figure 7.
5. Changing the intermediate level feature detector Our next experiments involved changing the intermediate level feature detector. Since in our case the intermediate
0.1
0
0
0.1
0.2
0.3
0.4
0.5 0.6 False alarm rate
0.7
0.8
0.9
1
Figure 4. ROC comparison for toy-bear: continuous line - variance based method, dotted line - gradient based method. features are curves, this meant changing the curve extraction procedure. Again we analyzed how the system performance changes. Our original system uses a curve extraction and linking algorithm based on stick growing [6]. We replaced this curve finder first with a canny edge detector and linker, then with a multiscale version of Nelson’s algorithm and we analyzed the results.
5.1. Using the canny edge detector and linker We used the canny edge detector and linker from the VISTA software environment [7]. The canny linker behaves in a different way than Nelson’s algorithm, in particular it doesn’t break curves at corners. Curves obtained this way vary more rapidly in case of a change in object orientation or lighting, and are more difficult to find. In addition, the canny linker misses some of the long curves. An example can be seen in Figure 5. The middle and left hand side images show the curves extracted from the toyrabbit image on the right hand side by our curve finder and the canny linker respectively. Dots mark curve endpoints.
Figure 5. Toy-rabbit image and curves obtained using our linker (middle) and the canny linker (right). Dots mark curve endpoints. The difference in the curve finders’ outputs was reflected in the recognizer’s behavior. Performance dropped significantly even for clean, black background images. Figure 6 shows the ROC curves obtained for images of the toy-rabbit
similar to Figure 5. The continuous line represents the results obtained using the canny linker, while the dotted line represents the results obtained using our original linker.
using the multiscale linker, while the dotted line represents the results obtained using the single scale linker.
0.9
0.9
0.8
0.8
0.7
0.7
0.6
Detection rate
Detection rate
1
1
0.6
0.5
0.5
0.4
0.4
0.3
0.3
0.2
0.2
0.1
0
0.1
0
0
0.1
0.2
0.3
0.4
0.5 0.6 False alarm rate
0.7
0.8
0.9
0
0.1
0.2
0.3
0.4
0.5 0.6 False alarm rate
0.7
0.8
0.9
1
1
Figure 6. ROC comparison for toy-rabbit: continuous line - canny linker, dotted line original linker.
5.2. Multiscale curve extraction We tried to improve the results of the object recognizer by using a multiscale version of our curve finder. After extracting the curves from the original image, we shrink the image by a factor of 2 and extract curves again looking for curves that were not found in the previous step. We repeat this process until the image becomes so small that no curves can be extracted anymore. By shrinking the image, contrasts between regions become stronger and the system can extract additional curves. The curvature scale also changes, so corners appear at different points. Figure 7 shows an image of a toy-bear on a cluttered background, together with the curves obtained by the single scale linker in the middle and the multiscale linker on the right.
p
Figure 7. Toy-bear image and curves obtained using single scale (middle) and multiscale (right) versions of the linker. Dots mark curve endpoints. The multiscale curve finder can extract more intermediate level features, especially in the case of complicated objects against cluttered backgrounds, such as the image of the toy-bear in Figure 7. The performance of the object recognizer increased on images like this. Figure 8 shows the ROC curves for images of the bear on a cluttered background. The continuous line represents the results obtained
Figure 8. ROC comparison for toy-bear: dotted line - single scale; continuous line - multiscale. In conclusion the intermediate level feature extraction has a big impact on the recognition performance: poor feature extraction leads to poor recognition results, while a slightly better feature extraction leads to improvement .
6. Adding a verification step The results reported so far were obtained without a toplevel verification of the highest-scoring hypotheses. The result given was always the first (highest scoring) hypothesis. Verification can improve recognition performance in two ways. First, it can find additional matching features that were missed during recognition because they were segmented differently than during training. Second, it can discard some incorrect matches that were allowed by the loose matching process used in the recognition stage. While this loose matching gives the necessary flexibility for tolerating changes in object orientation, it can also lead to matching incorrect features coming from background clutter. To verify a hypothesis, the model matched to the image is scaled and rotated based on the information given by that hypothesis, and dropped onto the image at the given position. Then the system evaluates the goodness of the match and assigns it a score. The system looks at the first ten hypotheses and chooses the best matching hypothesis. This hypothesis will be the final recognition result. The improvement obtained using the verification is limited by the performance of the indexing system. Since verification looks only at a limited number of hypotheses, the correct hypothesis should be among the first ones. However, by adding the verification step, the performance of the recognition system improved for images of objects on very cluttered backgrounds, such as those in Figure 9. The results of forced choice experiments on images of 6 objects can be seen in Tables 1 and 2 respectively. The
Figure 9. Images with 2D and 3D clutter. columns contain the number of test views and the number of correct classifications obtained without and with verification. class name cup toy-bear sports-car toy-rabbit plane fighter
samples 48 48 24 48 48 48
no verif. 41 22 23 38 47 47
verif 46 28 24 44 48 48
Table 1. Results for cluttered background. class name cup toy-bear sports-car toy-rabbit plane fighter
samples 48 48 24 48 48 48
no verif. 7 1 23 23 42 39
verif. 18 3 22 35 39 41
Table 2. Results for images with 3D clutter. Verification improved performance somewhat, especially in marginal situations. However, it is not clear if at this point the improvement is worth the high computational cost.
7. Conclusions In this paper we tried to find which, if any design axes of an appearance-based object recognition system hold the greatest potential for improving performance. We described a series of experiments in which we analyzed how various design modifications can improve recognition performance, especially in the presence of background clutter. We looked at the effect of increasing the number of training views by increasing the sample rate and we observed that although the performance increases a little bit for difficult objects, it generally stays the same. We changed the low-level feature detection, by replacing the gradient-based edge detector with one based on directional variance. Although we obtained better low-level features, the performance of the object recognition system remained the same.
We then replaced the intermediate level feature extraction process. Using a weaker edge linker (the canny linker) the recognition results became much worse even for clean images. A multiscale version of the linker we used so far gave somewhat better recognition results. Finally we added a top-level verification to our system. This also improved performance, but at a high computational cost, and the improvement was limited by the indexing performance, since verification looks only at a limited number of hypotheses and thus requires the correct hypothesis to be among the first ones. In conclusion the greatest leverage lies at the level of intermediate feature construction. This is not surprising, since these intermediate features representing object fragments give appearance-based object recognition techniques most of their power.
References [1] W. Grimson and D. Huttenlocher. On the sensitivity of the hough transform for object recognition. IEEE Trans. PAMI, 12(3):255–274, 1990. [2] C. Huang, O. Camps, and T. Kanungo. Object recognition using appearance-based parts and relations. In IEEE Conference on Computer Vision and Pattern Recognition, pages 878–884, San Juan, Puerto Rico, June 1997. [3] B. Mel. Seemore: Combining color, shape, and texture histogramming in a neurally-inspired approach to visual object recognition. Neural Computation, 9:777–804, 1997. [4] H. Murase and K. Nayar. Visual learning and recognition of 3-d objects from appearance. Int. Journal of Computer Vision, 14(1):5–24, 1995. [5] R. Nelson and A. Selinger. A cubist approach to object recognition. In International Conference on Computer Vision, pages 614–621, Bombay, India, January 1998. [6] R. C. Nelson. Finding line segments by stick growing. IEEE Trans. Pattern Anal. Machine Intell., 16:519–523, 1994. [7] A. Pope and D. Lowe. Vista: a software environment for computer vision research. In IEEE Conference on Computer Vision and Pattern Recognition, pages 768–72, Seattle, WA, June 1994. [8] C. Schmid and R. Mohr. Combining greyvalue invariants with local constraints for object recognition. In IEEE Conference on Computer Vision and Pattern Recognition, pages 872–877, San Francisco, CA, June 1996. [9] A. Selinger and R. Nelson. A perceptual grouping hierarchy for appearance-based 3d object recognition. Computer Vision and Image Understanding, 76(1):83–92, October 1999. [10] A. Selinger and R. Nelson. Using directional variance to extract curves in images, thus improving object recognition in clutter. Technical Report 712, University of Rochester, Department of Computer Science, 1999. [11] M. J. Swain and D. H. Ballard. Color indexing. International Journal of Computer Vision, 7(1):11–32, January 1991. [12] Z. Wang and J. Ben-Arie. Generic object detection using model based segmentation. In IEEE Conference on Computer Vision and Pattern Recognition, pages 428–433, Fort Collins, CO, June 1999.