Hindawi Mathematical Problems in Engineering Volume 2018, Article ID 5794016, 13 pages https://doi.org/10.1155/2018/5794016
Research Article Inexact Fuzzy Chance-Constrained Fractional Programming for Sustainable Management of Electric Power Systems C. Y. Zhou ,1 G. H. Huang ,2 J. P. Chen,3 and X. Y. Zhang3 1
School of Control and Computer Engineering, North China Electric Power University, Beijing 102206, China Institute for Energy, Environment and Sustainability Research, UR-NCEPU, North China Electric Power University, Beijing 102206, China 3 Institute for Energy, Environment and Sustainable Communities, UR-BNU, 3737 Wascana Parkway, Regina, SK, Canada S4S 0A2 2
Correspondence should be addressed to G. H. Huang;
[email protected] Received 14 April 2018; Accepted 8 July 2018; Published 19 November 2018 Academic Editor: Ching-Ter Chang Copyright © 2018 C. Y. Zhou et al. This is an open access article distributed under the Creative Commons Attribution License, which permits unrestricted use, distribution, and reproduction in any medium, provided the original work is properly cited. An inexact fuzzy chance-constrained fractional programming model is developed and applied to the planning of electric power systems management under uncertainty. An electric power system management system involves several processes with socioeconomic and environmental influenced. Due to the multiobjective, multilayer and multiperiod features, associated with these various factors and their interactions extensive uncertainties, may exist in the study system. As an extension of the existing fractional programming approach, the inexact fuzzy chance-constrained fractional programming can explicitly address system uncertainties with complex presentations. The approach can not only deal with multiple uncertainties presented as random variables, fuzzy sets, interval values, and their combinations but also reflect the tradeoff in conflicting objectives between greenhouse gas mitigation and system economic profit. Different from using least-cost models, a more sustainable management approach is to maximize the ratio between clean energy power generation and system cost. Results of the case study indicate that useful solutions for planning electric power systems management practices can be generated.
1. Introduction Sustainable development of electric power systems (EPS) plays a significant role in urban planning. At the present, the major energy sources for electricity generation in many countries are still nonrenewable fossil fuels, which are considered as one of the major contributors to the greenhouse gases emissions. Renewable energy, as an alternative energy source, has the characteristics of cleanliness, nondepletion, and easier operation and maintenance, however, its cost of generating electricity is higher and the energy source is intermittent and unreliable. Thus, there are many challenges to identify sustainable management plans for EPS. Among them, most importantly, decision-makers need to consider the tradeoff between economic cost and environmental impacts, the reflection of dynamic characteristics of facility capacity issues, as well as uncertainties of input information, such as the forecast values of electricity demands and renewable resource availabilities. Due to these complexities,
inexact systems analysis techniques are desired to assist in developing long-term EPS management plans. There are many techniques to handle system uncertainties, such as interval parameter programming (IPP) [1–3], stochastic mathematical programming (SMP) [4–7], and fuzzy possibilistic programming (FPP) [8–12]. In past decades, many inexact optimization methods were developed for energy system planning and management [13–20]. Classically, some models were formulated as single-objective Linear Programming (LP) problems aimed at minimization of system cost under specific levels of environmental requirements [21–23]. For example, Sun et al. [23] utilized a static deterministic linear model for planning China’s electric power systems development, in which real energy use patterns among interregional energy spillover effects were examined. Since the early 1980s, for better reflecting the multidimensionality of the sustainability goal, it was increasingly popular to represent the EPS management problems within a Multiple Objective Programming (MOP)
2 framework [24–30]. For example, Han et al. [27] presented a multiobjective model for the EPS planning to maximize the expected system total profit and minimize the financial risk of handling uncertain environments. Meza et al. [26] propose a long-term multiobjective model for the power generation expansion planning of Mexican electric power system, which can optimize simultaneously multiple objectives (i.e., minimizes costs, environmental impact, imported fuel, and fuel price risks). Nevertheless, the tradeoff of multiple objectives was neglected and the system complexities could not be adequately reflected. In order to deal with the conflict objectives between the economic development and environmental protection, Fractional Programming (FP) was used in many management problems [31–34]. For instance, Wang et al. [34] developed a multistage joint-probabilistic chanceconstrained fractional programming (MJCFP) approach of Saskatchewan, Canada. The MJCFP approach aimed to help tackle various uncertainties involved in typical electric power systems and thus facilitate risk-based management for climate change mitigation. Chen et al. [32] advanced a nonlinear fractional programming approach for addressing the environmental/economic power dispatch problems in the thermal power systems. Zhang et al. [33] put forward a fuzzy linear fractional programming approach for optimal irrigation water allocation under uncertainty. FP has the advantages of better reflecting the real problems by optimizing the ratio between the economic and the environmental aspects over the conventional single-objective or multiobjective optimization programming methods. However, few of the earlier studies about EPS are focused on analyzing interactive relationships among multiple objectives, the randomness of the parameters, and uncertainties existed in multiple levels. In addition, chance-constrained programming (CCP) with the dual uncertainties (i.e., an interval number with fuzzy boundaries) parameters is seldom integrated into the FP optimization framework to deal with the violation of system constraints exists in the optimization model. Therefore, this study aims to develop an inexact fuzzy chance-constrained fractional power system planning (IFCFPSP). IFCF-PSP model will integrate chance-constrained programming, fuzzy programming, and interval-parameter programming within a fractional programming framework. Results will provide decision support for (i) achieving tradeoffs among system violation risk, environmental requirement, and system cost; (ii) generating flexible capacity expansion strategies under different risk levels; (iii) providing a variety of power generation and capacity expansion alternatives that can help support decision making under changing conditions; and (iv) helping decision-makers identify the optimal EPS management strategies and gain deeper insights into system efficiency, system cost and system risk under different CO2 emission targets.
Mathematical Problems in Engineering (LFP) method can be effective in balancing two conflicting objectives and addressing randomness in the right-hand parameters. A general LFP problem can be expressed as follows: max 𝑓 =
∑𝑛𝑗=1 𝑑𝑗 𝑥𝑗 + 𝛽
𝑛
subject to:
∑𝑎𝑖𝑗 𝑥𝑗 ≤ 𝑏𝑖 ,
𝑖 = 1, 2, . . . , 𝑚
𝑗=1
𝑥𝑗 ≥ 0, 𝑗 = 1, 2 . . . , 𝑛
(1a)
(1b) (1c)
where 𝑋 is a vector of interval decision variables, 𝑎𝑖𝑗 are technical coefficients, and 𝑏𝑖 are right-hand-side parameters; 𝛼 and 𝛽 are constants. In a power system, many data available are imprecise. Parameters in the model can be represented as interval numbers and/or fuzzy membership functions, such that the uncertainties can be directly communicated into the optimization process and resulting solution. Interval linear programming (ILP) is an effective method to deal with uncertainties existing as interval values without distribution information. The ILP method is integrated into the LFP method to reflect the uncertainty of the model parameters. Interval linear fractional programming (ILFP) can be an effective tool to tackle dual-objective optimization problems under uncertainty, especially when distribution information is not known exactly, and merely lower and upper bounds are available. A general ILFP problem can be expressed as follows: max
±
𝑓 =
∑𝑛𝑗=1 𝑐𝑗± 𝑥±𝑗 + 𝛽±
∑𝑛𝑗=1 𝑑±𝑗 𝑥±𝑗 + 𝛾±
𝑛
subject to:
∑𝑎𝑖𝑗± 𝑥±𝑗 ≤ 𝑏𝑖± ,
𝑖 = 1, 2, . . . , 𝑚
𝑗=1
𝑥±𝑗 ≥ 0, 𝑗 = 1, 2 . . . , 𝑛
(2a)
(2b) (2c)
If 𝑏𝑖± is a random right-hand-side parameter, the constraints (2b) can be transformed as follows: {𝑛 } Pr { ∑𝑎𝑖𝑗± 𝑥±𝑗 ≤ 𝑏𝑖± } ≥ 𝛿𝑖 , {𝑗=1 }
𝑖 = 1, 2, . . . , 𝑚
(3)
This means that the possible region of occurrence for the left-hand side of each constraint should be contained within a satisfactory or tolerable region as defined by the corresponding right-hand side. Thus, by incorporating tolerance measures 𝛿𝑖 (0 ≤ 𝛿𝑖 ≤ 1) and utilizing the chanceconstrained approach, the stochastic constraints of (3) can be transformed to their deterministic equivalents as follows: 𝑛
±(𝑝𝑖 )
∑ 𝑎𝑖𝑗± 𝑥±𝑗 ≤ 𝑏𝑖
2. Methodology
𝑗=1
The tradeoff of conflicting objectives between CO2 mitigation and system economic profit is important to power systems planning (PSP). The linear fractional programming
∑𝑛𝑗=1 𝑐𝑗 𝑥𝑗 + 𝛼
(𝑝 )
,
𝑖 = 1, 2, . . . , 𝑚
(4)
where 𝑏𝑖 𝑖 = 𝐹𝑖−1 (𝑝𝑖 ), 𝑖 = 1, 2, . . . , 𝑚; 𝑝𝑖 = 1 − 𝛿𝑖 , given the cumulative distribution function of 𝑏𝑖 (i.e., 𝐹𝑖 (𝑏𝑖 )) and
3
Membership Grade
Membership Grade
Mathematical Problems in Engineering
1
1 0.8 0.5 FL ( 0.2
a−ij
a+ij
𝑖 = 1, 2, . . . , 𝑚
x
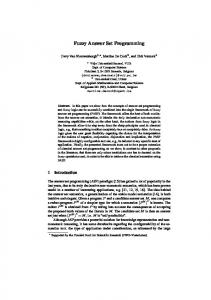
availability of resource B. ≤ means fuzzy inequality. Fuzzy ̃ a L–R fuzzy number [35]: subset 𝑁 can be expressed as 𝑚−𝑥 𝐹𝐿 ( ), { { { 𝛼 { { 𝜇𝑁 (𝑥) = {1, { { { 𝑥−𝑚 { 𝐹 ( ), { 𝑅 𝛿
𝑖𝑓 − ∞ < 𝑥 < 𝑚, 𝛼 > 0, 𝑖𝑓 𝑥 = 𝑚,
(7a)
𝑖𝑓 𝑚 < 𝑥 < +∞, 𝛿 > 0.
where 𝐹𝐿 and 𝐹𝑅 are the shape functions (Figure 2). For a linear case, fuzzy subset 𝑁 can be defined as the following general format: 0, 𝑖𝑓 𝑥 < 𝛼 𝑜𝑟 𝑥 > 𝛼, { { { { { 𝑖𝑓 𝑥 = 𝑚, 𝜇𝑁 (𝑥) = {1, { { { {1 − 2 |𝑚 − 𝑥| , 𝑖𝑓 𝛼 < 𝑥 < 𝛼. 𝛼−𝛼 {
(7b)
where [𝛼, 𝛼] is an interval imposed by fuzzy subset 𝑁. Based on the method from Nie et al. [36] and Leung et al. [37], the fuzzy constraints in (5) can be replaced by the following 2𝑘 precise inequalities, in which k denotes the number of 𝛼 − 𝑐𝑢𝑡 levels: 𝑛
𝑠
𝑠(𝑝𝑖 )
𝑠
𝑠(𝑝𝑖 )
∑𝑎𝑖𝑗± 𝑥±𝑗 ≤ 𝑏𝑖±
,
𝑖 = 1, 2, . . . , 𝑚; 𝑠 = 1, 2, . . . , 𝑘
(8a)
,
𝑖 = 1, 2, . . . , 𝑚; 𝑠 = 1, 2, . . . , 𝑘
(8b)
𝑗=1 𝑛
∑𝑎𝑖𝑗± 𝑥±𝑗 ≥ 𝑏𝑖±
𝑗=1
where (5)
𝑎𝑖𝑗± = sup (𝑎𝑖𝑗±𝑠 ) ,
Let 𝑈𝑗 and 𝑉 be base variables imposed by fuzzy subsets 𝐴 𝑗 ̃ ̃ and 𝐵, then
𝑎𝑖𝑗± = inf (𝑎𝑖𝑗±𝑠 ) ,
𝜇𝐴 𝑗 : 𝑈𝑗 → [0, 1] ̃ 𝜇𝐵 : 𝑉 → [0, 1] ̃
x−m )
Figure 2: L-R fuzzy membership function.
the probability of violating constraint (4) (𝑝𝑖 ). The constraint of the model in the optimization process is changed from “rigid satisfaction” to “flexible response.” Therefore, the scheme can meet the optimization target with flexibility and maneuverability. However, the problem with constraints (4) can only reflect the case when A is deterministic. In many real-world problems, the lower and upper bounds of some interval parameters can rarely be acquired as deterministic values. Instead, they may often be given as subjective information that can only be expressed as fuzzy sets. This leads to dual uncertainties as shown in Figure 1. If both A and B are uncertain, the set of feasible constraints may become more complicated. To generate a precise analysis of decisionmaking, multiple uncertainties need to be tackled. For example, the total carbon dioxide emissions in a certain region can be described as probability distributions, and the statistics of such a random parameter can be expressed as fuzzy sets. This results in dual uncertainties, which can be represented by the concept of distribution with fuzzy probability (DFP). In order to deal with the hybrid uncertainty resulting from fuzzy and stochastic information in constraints and parameters, CCP is then integrated into the ILFP method to reflect probability distribution of fuzzy numbers. Models (2a), (2b), and (2c) can be further improved by incorporating fuzzy and chance-constrained techniques. Therefore, let R± be the set of intervals with fuzzy lower and upper bounds, and 𝜓± denotes a set of fuzzy random numbers for fuzzy lower and upper bounds. 𝑛
FR (
0
x
Figure 1: Fuzzy boundaries for interval 𝑎± .
±(𝑝 ) ∑ 𝑎̃𝑖𝑗± 𝑥±𝑗 ≤ ̃𝑏𝑖 𝑖 , ̃ 𝑗=1
m−x )
(6a)
𝑠
𝑎𝑖𝑗±𝑠 ∈ (𝐴𝑗 ) ̃ 𝛼𝑠
(8c)
𝑠
𝑎𝑖𝑗±𝑠 ∈ (𝐴𝑗 ) ̃ 𝛼𝑠
(8d)
𝑠
𝑏𝑖±𝑠 ∈ 𝐵𝛼 ̃ 𝑠
(8e)
𝑏𝑖± = sup (𝑏𝑖±𝑠 ) , 𝑠
(6b)
where 𝜇𝐴 𝑗 indicates the possibility of consuming a specific amount of resource by activity 𝑗 and 𝜇𝐵 indicates the possible
𝑏𝑖± = inf (𝑏𝑖±𝑠 ) ,
𝑏𝑖±𝑠 ∈ 𝐵𝛼 (8f) ̃ 𝑠 𝛼𝑠 ∈ (0, 1] (𝑠 = 1, 2, . . . , 𝑘), sup(𝑡) represents the superior limit value among set 𝑡, and inf(𝑡) denotes the inferior limit value among set 𝑡.
4
Mathematical Problems in Engineering
Uncertainty
Multiple objectives
Stochastic information
Interval-parameter
Chance-constrained programming
Interval-parameter programming
Fractional objective
Fuzzy sets
Mixed-integer fractional programming
Fuzzy programming
Inexact fuzzy chance-constrained fractional programming (IFCFP)
Optimal solutions of IFCFP
Figure 3: Framework of the IFCFP approach.
Figure 3 presents the framework of the IFCFP method. Give a set of certain values of the 𝛼 − 𝑐𝑢𝑡 level to fuzzy parameters 𝑎̃𝑖𝑗 , ̃𝑏𝑖 , and 𝑝̃𝑖 , and solve models (1a), (1b), and (1c) through the IFCFP approach. According to interactive transform algorithm proposed by Zhu et al. [31], the IFCFP model can be transformed into two submodels and then can be solved through the branch-and-bound algorithm and the method proposed by Charnes et al. [38]. Compared with the existing optimization methods, the proposed IFCFP approach has three characteristics: (i) it can tackle ratio optimization problems; (ii) it can handle uncertainties with unknown distribution information by interval parameters and variables; and (iii) it can deal with uncertain parameters presented as fuzzy sets in the objective and the left hand side, as well as dual uncertainties expressed as the distribution with fuzzy probability.
3. Case Study To demonstrate its advantages, the proposed IFCFP method is applied to a typical regional electric system management problem with representative cost and technical data within a Chinese context. In the study system, it is assumed that there is an independent regional electricity grid, where one nonrenewable resource (coal) and four clean energy resources (natural gas, wind, solar, and hydro) are available for electricity generation. The decision-makers are responsible for arranging electricity production from those five types of power-generation to meet the demand of end users. To reflect the dynamic features of the study system, three-time periods (5 years for each period) are considered in a 15-year planning horizon. A sufficient electricity supply at minimum cost is important to the electric generation expansion planning. The system cost 𝐶± is formulated as a sum of the following: 𝐶± = 𝑓1 ± + 𝑓2 ± + 𝑓3 ± + 𝑓4 ± + 𝑓5 ±
(9a)
(1) the total cost for primary energy supply: 𝑇
𝑡=1 𝑗=1
𝐽
𝑇
𝑓2 ± = ∑ ∑𝐶𝑃𝐺±𝑡𝑗 × 𝐴𝑃𝐺±𝑡𝑗
(9c)
𝑡=1 𝑗=1
where 𝐴𝑃𝐺±𝑡𝑗 is equal to decision variable and represents electricity generation from power-generation technology 𝑗 in period 𝑡(GWh); 𝐶𝑃𝐺±𝑡𝑗 is equal to fixed and variable operation costs for generating electricity via technology 𝑗 in period 𝑡(103 $/GWh); (3) cost for capacity expansions: 𝑇
𝐽
𝑀
𝑓3 ± = ∑ ∑ ∑ 𝐶𝐸𝑃±𝑡𝑗 × 𝐸𝐶𝐴±𝑡𝑗𝑚 × 𝑌𝑡𝑗𝑚
(9d)
𝑡=1 𝑗=1 𝑚=1
where 𝑚 is equal to index for the capacity expansion options (𝑚 = 1, 2, . . . , 𝑀). 𝐶𝐸𝑃±𝑡𝑗 is equal to cost for expanding capacity for generating electricity via technology 𝑗 in period 𝑡.(106 $/GW). 𝐸𝐶𝐴±𝑡𝑗𝑚 is equal to capacity expansion option of power-generation technology 𝑗 under different expansion program 𝑚 in period 𝑡(GW); 𝑌𝑡𝑗𝑚 is equal to binary variable of capacity option 𝑚 for power-generation technology 𝑗 in period 𝑡. (4) cost for importing electricity: 𝑇
𝑓4 ± = ∑𝐶𝐼𝐸±𝑡 × 𝐴𝐼𝐸±𝑡
(9e)
𝑡=1
𝐼
𝑓1 ± = ∑ ∑𝐶𝑃𝐸±𝑡𝑗 × 𝐴𝑃𝐸±𝑡𝑗
where 𝑡 is equal to index for the time periods (𝑡 = 1, 2, . . . , 𝑇); 𝑗 is equal to index for the power-generation technology (𝑗 = 1, 2, . . . , 𝐽), 𝐼 = the number of nonrenewable powergeneration technology (e.g., 𝑗 = 1 coal power, 𝑗 = 2 natural gas, and 𝐼 < 𝐽); 𝐶𝑃𝐸±𝑡𝑗 is equal to cost for local primary energy supply for power-generation technology 𝑗 in period 𝑡(103 $/TJ); 𝐴𝑃𝐸±𝑡𝑗 is equal to decision variable and represents local supply of primary energy resource for power-generation technology 𝑗 in period 𝑡(TJ). (2) fixed and variable operating costs for power generation:
(9b)
where 𝐶𝐼𝐸±𝑡 is equal to cost of importing electricity in period 𝑡(103 $/GWh); 𝐴𝐼𝐸±𝑡 is equal to decision variable and
Mathematical Problems in Engineering
5
represents the shortage amount of electricity needs to be imported in period 𝑡(GWh). (5) cost for pollutant mitigation: 𝑇
𝐼
𝑓5 ± = ∑ ∑ 𝐶𝑃𝑀±𝑡𝑗 × 𝐴𝑃𝐺±𝑡𝑗 × 𝜂𝑡±
(9f)
𝑡=1 𝑗=1
where 𝐶𝑃𝑀±𝑡𝑗 is equal to cost of pollution mitigation of power-generation technology 𝑗 in period 𝑡(103 $/ton); 𝜂𝑡± CO2 emission factor in period 𝑡(103 ton/GWh). Renewable energy resources are intermittent and unreliable, which are subject to spatial and/or temporal
max 𝑓± = =
fluctuations. The natural gas generation with low carbon dioxide emissions can stabilize the risk of the intermittent and unpredictable nature of renewable energy generation. In this study, we assumed natural gas resources as the clean energy power generation. Therefore, the objective of this study is to maximize the ratio between clean energy generation (including the natural gas) and system cost, while a series of constraints define the interrelationships among the decision variables and system conditions/factors. The inexact fuzzy chance-constrained fractional power systems planning (IFCF-PSP) can be formulated as fol -lows:
𝐶𝐺± 𝐶±
(10a)
∑𝑇𝑡=1 ∑𝐽𝑗=𝐼+1 𝐴𝑃𝐺±𝑡𝑗 + ∑𝑇𝑡=1 𝐴𝑃𝐺±𝑡2 𝑇 𝑇 𝐼 ± ± ± ± ± ± ± ∑𝑇𝑡=1 ∑𝐼𝑗=1 𝐶𝑃𝐸±𝑡𝑗 × 𝐴𝑃𝐸±𝑡𝑗 + ∑𝑇𝑡=1 ∑𝐽𝑗=1 𝐶𝑃𝐺±𝑡𝑗 × 𝐴𝑃𝐺±𝑡𝑗 + ∑𝑇𝑡=1 ∑𝐽𝑗=1 ∑𝑀 𝑚=1 𝐶𝐸𝑃𝑡𝑗 × 𝐸𝐶𝐴 𝑡𝑗𝑚 × 𝑌𝑡𝑗𝑚 + ∑𝑡=1 𝐶𝐼𝐸𝑡 × 𝐴𝐼𝐸𝑡 + ∑𝑡=1 ∑𝑗=1 𝐶𝑃𝑀𝑡𝑗 × 𝐴𝑃𝐺𝑡𝑗 × 𝜂𝑡
where the clean energy power generation (𝐶𝐺± ) consists of the renewable energies such as wind power, solar energy, and hydropower (𝐴𝑃𝐺±𝑡𝑗 and j = I + 1, . . . , J) and the natural gas generation in period 𝑡. The constraints are listed as follows: (1) electricity demand constraints: 𝐽
∑𝐴𝑃𝐺±𝑡𝑗 + 𝐴𝐼𝐸±𝑡 ≥ 𝐷𝑀𝑡± × (1 + 𝜃𝑡± ) ,
∀𝑡
(10b)
𝑗=1
where 𝐷𝑀𝑡± is equal to local electricity demand (GWh); 𝜃𝑡± is equal to transmission loss in period 𝑡. (2) capacity limitation constraints for power-generation facilities: 𝑀
𝐴𝑃𝐺±𝑡𝑗 ≤ (𝑅𝐶𝐴±𝑡𝑗 + ∑ 𝐸𝐶𝐴±𝑡𝑗𝑚 × 𝑌𝑡𝑗𝑚 ) × 𝑆𝑇𝑀𝑡𝑗± , 𝑚=1
(10c)
where 𝑈𝐶𝐴±𝑡𝑗 is equal to maximum capacity of generation technology 𝑗 in period 𝑡(GW). (5) expansion options constraints: 𝑀
∑ 𝑌𝑡𝑗𝑚 ≤ 1,
𝐴𝐼𝐸±𝑡 ≤ 𝑈𝐼𝐸±𝑡 ,
𝐴𝑃𝐸±𝑡𝑗 ≤ 𝑈𝑃𝐸±𝑡𝑗 ,
∀𝑡, 𝑗
(10d)
𝐴𝑃𝐺±𝑡𝑗 × 𝑟𝑓𝑡𝑗± ≤ 𝐴𝑃𝐸±𝑡𝑗 ,
∀𝑡, 𝑗
(10e)
where 𝑈𝑃𝐸±𝑡𝑗 is equal to available primary energy 𝑗 in period 𝑡 (𝑗 = 1, 2; TJ); 𝑟𝑓𝑡𝑗± is equal to energy consumption conversion rate by power-generation technology 𝑗 in period 𝑡 (𝑗 = 1, 2; TJ/GWh). (4) capacity expansion constraints: +
× 𝑌𝑡𝑗𝑚 ≤
𝑈𝐶𝐴±𝑡𝑗 ,
𝐽
𝐽
𝑗=𝐼+1
𝑗=1
(10f)
∀𝑡
(10i)
where 𝜎𝑡± is equal to the minimum proportion of electricity generation by renewable energy in the whole powergeneration. Currently, the Renewable Portfolio Standard (RPS) mechanisms have been adopted in several countries, including the United Kingdom (Renewables Obligation in the UK), Italy, Poland, Sweden, and Belgium, and 29 out of 50 US states, etc. According to the government’s requirement, a certain percentage of the electricity generation of the power enterprises will come from renewable energy sources. The proportion of electricity from renewable sources will usually increase year by year. Thus, in the model, 𝜎𝑡± is used to represent the lowest ratio of the RPS. (8) pollutants emission constraints: 𝐼
∀𝑡, 𝑗
(10h)
∑ 𝐴𝑃𝐺±𝑡𝑗 ≥ (∑ 𝐴𝑃𝐺±𝑡𝑗 ) 𝜎𝑡± ,
is equal to the current capacity of powerwhere generation technology 𝑗 in period 𝑡(GW); 𝑆𝑇𝑀𝑡𝑗± is equal to the maximum service time of power-generation technology 𝑗 in period 𝑡(hour). (3) primary energy availability constraints:
∑ 𝐸𝐶𝐴±𝑡𝑗𝑚 𝑚=1
∀𝑡
where 𝑈𝐼𝐸±𝑡 is equal to maximum import amount of electricity imports in period 𝑡 (GWh). (7) renewable energy availability constraints:
𝑅𝐶𝐴±𝑡𝑗
𝑀
(10g)
𝑌𝑡𝑗𝑚 = 1, if capacity expansion is undertaken 𝑌𝑡𝑗𝑚 = 0, otherwise (6) import electricity constraints:
∀𝑡, 𝑗
𝑅𝐶𝐴±𝑡𝑗
∀𝑡, 𝑗
𝑚=1
± (𝑝𝑖 )
̃ ∑𝐴𝑃𝐺±𝑡𝑗 × 𝜂𝑡𝑗± × (1 − 𝜉̃𝑡± ) ≤ 𝐸𝑀 𝑡
𝑗=1
,
∀𝑡
(10j)
6
Mathematical Problems in Engineering Table 1: Cost of energy supply and conversion parameters. Period t=1
t=2
t=3
Coal
[2.56, 3.06]
[3.26, 3.76]
[3.96, 4.46]
Natural gas
[6.76, 6.96]
[7.57, 7.77]
[8.38, 8.58]
3
Energy supply cost (10 $/TJ)
Units of energy carrier per units of electricity generation (TJ/GWh) Coal
[11.12, 11.7]
[10.68, 11.16]
[10.15, 10.62]
Natural gas
[8.38, 8.82]
[7.54, 7.92]
[6.79, 7.38]
Table 2: Fuzzy subsets for efficiency coefficient under different 𝛼 − 𝑐𝑢𝑡 levels. period
efficiency coefficient +
𝛼 − 𝑐𝑢𝑡 level 0
0.2
0.5
0.8
1
t=1 t=2 t=3 t=1 t=2 t=3 t=1 t=2 t=3 t=1 t=2 t=3 t=1 t=2 t=3
𝜌
𝜌+
𝜌−
𝜌−
0.125 0.14 0.119 0.135 0.142 0.12 0.15 0.144 0.123 0.165 0.147 0.125 0.175 0.149 0.126
0.235 0.175 0.149 0.223 0.17 0.144 0.205 0.162 0.138 0.187 0.154 0.131 0.175 0.149 0.126
0.12 0.136 0.116 0.13 0.138 0.117 0.145 0.14 0.119 0.16 0.143 0.122 0.17 0.145 0.123
0.23 0.17 0.145 0.218 0.165 0.14 0.2 0.157 0.134 0.182 0.15 0.127 0.17 0.145 0.123
Note. efficiency coefficient (𝜌̃𝑡± = 1 − 𝜉̃𝑡± ).
where 𝐸𝑀𝑡 is equal to the permitted CO2 emission in period 𝑡(103 ton). 𝜉̃𝑡± is equal to the efficiency of chemical absorption or capture and storage of CO2 in period 𝑡.𝑝𝑖 = the risk confidence levels. (9) nonnegativity constraints: 𝐴𝑃𝐸±𝑡𝑗 , 𝐴𝑃𝐺±𝑡𝑗 , 𝐴𝐼𝐸±𝑡 ≥ 0
∀𝑡, 𝑗
(10k)
Interval parameters are adopted to address imprecise uncertainties, which are generally associated with electricity demands, prices of energy resources, costs of capacity expansion, and many other constraints. The real research data are used as input data of the model. The detailed descriptions of cost for energy supply and relative conversion parameters were illustrated in Table 1. Table 2 gives fuzzy subsets for efficiency coefficient under different 𝛼−𝑐𝑢𝑡 levels. Table 3 lists the capacity expansion options and capital investment costs for each facility.
4. Results and Discussion In Figure 4, coal-fired electricity supply would increase steadily and still play an important role in the power system due to its high availability and competitive price over the study planning horizon. However, increasingly stringent emission limits result in idle coal-fired facilities. More economical and environmentally friendly power generation facilities will be prioritized. The risk confidence level (𝑝𝑖 ) is employed to the constraints of CO2 emission requirement. The decision-maker can adjust the value of the 𝑝𝑖 level according to actual needs. We assumed that violations of emission constraints are allowed under three given 𝑝𝑖 levels (𝑝𝑖 = 0.01,0.05, and 0.1, which are normally adopted as the significance levels) [39]. The higher credibility level would correspond to a tight environment requirement, thus leading to a lower CO2 emission, while the lower credibility level would correspond to a relatively relaxed environment requirement, thus resulting in a higher CO2 emission. Therefore, changes in 𝑝𝑖 -level have an impact on coal-fired power
Mathematical Problems in Engineering
7
Table 3: Capacity expansion options and costs for power-generation facilities.
Capacity-expansion options (GW) Coal
Natural gas
Wind power
Solar energy
Hydropower
m=1 m=2 m=3 m=1 m=2 m=3 m=1 m=2 m=3 m=1 m=2 m=3 m=1 m=2 m=3
Capacity expansion cost (106 $/GW) Coal Natural gas Wind power Solar energy Hydropower
generation. The total supply of coal-fired generation would decrease from [480.69, 507.20] × 109 GWh when 𝑝𝑖 = 0.1 to [471.75, 506.85] × 109 GWh when 𝑝𝑖 = 0.05, and reach [459.38, 503.13] × 109 GWh when 𝑝𝑖 = 0.01. In contrast, clean energy generation will increase. For example, solar power generation of three periods would rise from [24.38, 27.68] × 109 GWh when 𝑝𝑖 = 0.1 to [25.62, 27.68] × 109 GWh when 𝑝𝑖 = 0.05 and reach [26.25, 27.69] × 109 GWh when 𝑝𝑖 = 0.01. As shown in Figure 4, the generation of solar power and natural gas in clean power facilities are mainly affected by emission constraints. When 𝑝𝑖 = 0.01, the solar power generation is the largest and the power generation from natural gas is the lowest in the three-study 𝑝𝑖 -levels. This is the result of the tradeoff between carbon dioxide emissions and system costs. Developing natural gas electricity requires a relatively low capital cost but leads to more CO2 emissions, and the solar energy technology needs a low operational cost but an extremely high capital cost. Similarly, the results under other 𝑝𝑖 levels (𝑝𝑖 = 0.05 and 𝑝𝑖 = 0.1) can be interpreted. During the entire planning horizon, the ratio objective between clean energy generation and the total system cost would be [2.15,3] GWh per $106 , which also represents the range of the system efficiency. When the electricity-generation pattern varies under different 𝑝𝑖 levels and within the interval solution ranges, the system efficiency would also fluctuate within its solution range correspondingly. Thus, the IFCF-PSP results can create multiple decision alternatives through adjusting
t=1
Period t=2
t=3
0.05 0.10 0.15 0.10 0.15 0.20 0.05 0.15 0.20 0.05 0.15 0.20 0.15 0.20 0.25
0.05 0.10 0.15 0.10 0.15 0.20 0.05 0.15 0.20 0.05 0.15 0.20 0.15 0.20 0.25
0.05 0.10 0.15 0.10 0.15 0.20 0.05 0.15 0.20 0.05 0.15 0.20 0.15 0.20 0.25
[577, 607] [726, 756] [1256, 1306] [2668, 2768] [1597, 1697]
[547, 577] [676, 726] [1156, 1206] [2468, 2568] [1497, 1597]
[517, 547] [626, 676] [1056, 1106] [2268, 2368] [1397, 1497]
different combinations of the solutions. Table 4 presents the typical alternatives, where combinations of upper/lower ± bound values for 𝐴𝑃𝐸±𝑡𝑗 , 𝐴𝑃𝐺±𝑡𝑗 , 𝑌𝑡𝑗𝑚 , (𝑗 = 1, ∀𝑡, 𝑚) and ± ± 𝐴𝑃𝐺𝑡𝑗 , 𝑌𝑡𝑗𝑚 , (𝑗 = 2, 3, 4, 5, ∀𝑡, 𝑚) are examined. Under the same power generation alternative, interval solution of the system cost can be obtained according to interval price parameters and corresponds to the interval solution of system efficiency. Based on the result of the total electricity generated, we divided the 12 alternatives into three groups (high: A3, A4, A8, and A12; medium: A1, A5, A7, and A9; low: A2, A6, A10, and A11) to meet the future high, medium, or low electricity demand. The comparison of the system efficiency under different 𝑝𝑖 levels shows that A11> A6 > A10 > A2 under low-level total power generation group. Alternative A11 (corresponding to f+) would lead to the most sustainable option with a system efficiency as much as [2.714,2.999] GWh per $106 , which corresponds to the highest amount of clean energy electricity (0.478 × 10⁶ GWh) and a moderate cost ([159.36, 176.12] × 109 $). Additionally, lower-level electricity demands will be satisfied by a total power generation of 1.856 106 GWh. Therefore, Alternative A11 is a desirable choice from the point of view of resources conservation and environmental protection when electricity demand is at the low level. Alternative A6 would also meet low electricity demand and reached the lowest system cost ([151.42, 167.85] × 109 $). When Alternative A10 is adopted, all the power generation
Mathematical Problems in Engineering
Power generation (103 GWh)
8 JC =0.1
200 180 160 140 120 100 80 60 40 20
0
t=1 t=2 t=3 t=1 t=2 t=3 t=1 t=2 t=3 t=1 t=2 t=3 t=1 t=2 t=3 Coal
Natural gas Wind power Solar energy Hydropower
Power generation (103 GWh)
Submodel fSubmodel f+ JC =0.05
200 180 160 140 120 100 80 60 40 20 0
t=1 t=2 t=3 t=1 t=2 t=3 t=1 t=2 t=3 t=1 t=2 t=3 t=1 t=2 t=3 Coal
Natural gas Wind power Solar energy Hydropower
Power generation (103 GWh)
Submodel fSubmodel f+ 200 180 160 140 120 100 80 60 40 20 0
JC =0.01
t=1 t=2 t=3 t=1 t=2 t=3 t=1 t=2 t=3 t=1 t=2 t=3 t=1 t=2 t=3 Coal
Natural gas Wind power Solar energy Hydropower
Submodel fSubmodel f+
Figure 4: Power generation loads for EPS through the IFCF-PSP model.
activities will reach their lower bound levels, leading to the lowest power generation (1.764 × 10⁶ GWh). Compared with Alternative A6, this alternative may be of less interest to decision-makers due to its lower system efficiency and higher system cost. However, it is the solution that is obtained under the most stringent emission constraints (i.e., 𝑝𝑖 = 0.01). Alternative A2 is a moderate solution in this group. Its system cost, system efficiency, total power generation, and clean energy power generation are [152.95, 169.54] × 109 $, [2.206,2.445] GWh per $106 , 1.816 × 10⁶ GWh, and 0.374 × 10⁶ GWh. In middle-level total power generation group, the comparison of the system efficiency under different 𝑝𝑖 levels shows that alternative A7> A5> A9 >A1. In alternative A7, middle-level electricity demands will be satisfied by a total power generation of 1.893 × 10⁶ GWh. In addition, Alternative
A7 has the highest system efficiency ([2.661, 2.941] GWh per 106 $) and the largest amount of clean energy power generation (0.478 × 10⁶ GWh) in this group. Thus, Alternative A7 is considered to be a desirable choice. Alternatives A5 and A9 would lead to the same total power generation solution (1.895 × 10⁶GWh). They are the two-moderate solutions in this group. The system cost obtained from the A1 is the lowest ([157.18, 174.13] × 109 $) in this group. It would lead to the lowest system efficiency ([2.148, 2.379] GWh per 106 $), but due to the largest proportion of fossil-fired power generation, A1 has the maximum security for energy supply. In high-level total power generation group, the comparison of the system efficiency under different 𝑝𝑖 levels shows that alternative A3> A12> A8 >A4. The same clean energy power generation obtained from the 4 alternatives is 0.478 106 GWh. In Alternative A4, all the power generation activities will be equal to their upper-bound values at the same time. It would lead to the highest system cost ([169.01, 186.76] × 109 $), but the moderate system efficiency ([2.559, 2.828] GWh per $106 ). In comparison, Alternative A3 would lead to the minimum system cost ([164.78, 182.16] × 109 $) and the highest system efficiency ([2.624, 2.901] GWh per $106 ) in this group. In addition, this alternative would also provide the highest clean energy power generation. Therefore, this alternative is a desirable sustainable option under the high electricity demand level. Alternatives A8 and A12 can provide modest system efficiencies, which would be [2.561, 2.83] and [2.575, 2.845] GWh per $106 , respectively, and lower system costs, which would be [168.92, 186.66] and [168.00, 185.64] × 109 $. Therefore, decision-makers who pay attention to the stability of the system may be interested in these two alternatives. The above alternatives represent various options between economic and environmental tradeoffs. Willingness to accept high system cost will guarantee meeting the objective of increasing the proportion of clean energy. A strong desire to acquire low system cost will cause the risk of violating emission constraints. In general, the above research results were favored by decision makers due to their flexibility and preference for practical-making decision processes. The feasible ranges for decision variables under different 𝑝𝑖 levels were useful for decision makers to justify the generated alternatives directly. Besides the scenario of maximizing the proportion of clean energy, another scenario of minimizing the system cost is also analyzed to evaluate the effects of different energy supply policies. The optimal-ratio problem presented in Models (10a)–(10k) can be converted into a least-cost problem with the following objective: min 𝑓 = system cost 𝑇
𝑇
𝐼
𝐽
= ∑ ∑ 𝐶𝑃𝐸±𝑡𝑗 × 𝐴𝑃𝐸±𝑡𝑗 + ∑ ∑𝐶𝑃𝐺±𝑡𝑗 × 𝐴𝑃𝐺±𝑡𝑗 𝑡=1 𝑗=1 𝑇
𝑡=1 𝑗=1
𝐽
𝑀
+ ∑ ∑ ∑ 𝐶𝐸𝑃𝑡𝑗± × 𝐸𝐶𝐴±𝑡𝑗𝑚 × 𝑌𝑡𝑗𝑚 𝑡=1 𝑗=1 𝑚=1
Mathematical Problems in Engineering
9
Table 4: Typical decision alternatives obtained from the IFCF-PSP model solutions. Alternative 𝑝𝑖 = 0.1 A1 A2 A3 A4 𝑝𝑖 = 0.05 A5 A6 A7 A8 𝑝𝑖 = 0.01 A9 A10 A11 A12
± ± 𝐴𝑃𝐸± 𝑡𝑗 ,𝐴𝑃𝐺𝑡𝑗 ,𝑌𝑡𝑗𝑚 (𝑗=1, ∀𝑡,𝑚)
± 𝐴𝑃𝐺± 𝑡𝑗 ,𝑌𝑡𝑗𝑚 (𝑗=2,3,4,5, ∀𝑡,𝑚)
System efficiency (GWh per 106 $)
System cost (109 $)
Total power generation (106 GWh)
Clean energy power generation (106 GWh)
+ +
+ +
[2.148,2.379] (#12) [2.206,2.445] (#9) [2.624,2.901] (#3) [2.559,2.828] (#6)
[157.18,174.13] (#4) [152.95,169.54] (#3) [164.78,182.16] (#9) [169.01, 186.76] (#12)
1.895 (#6) 1.816 (#10) 1.92 (#4) 2 (#1)
0.374 (#11) 0.374 (#11) 0.478 (#1) 0.478 (#1)
+ +
+ +
[2.236,2.477] (#8) [2.329,2.582] (#7) [2.661,2.941] (#2) [2.561,2.83] (#5)
[157.83,174.87] (#5) [151.42,167.85] (#1) [162.51,179.63] (#8) [168.92,186.66] (#11)
1.912 (#5) 1.807 (#11) 1.893 (#8) 1.999 (#2)
0.391 (#7) 0.391 (#7) 0.478 (#1) 0.478 (#1)
+ +
+ +
[2.174, 2.406] (#11) [2.297,2.543] (#8) [2.714,2.999] (#1) [2.575,2.845] (#4)
[160.40, 177.57] (#7) [151.76, 168.06] (#2) [159.36,176.12] (#6) [168.00, 185.64] (#10)
1.895 (#6) 1.764 (#12) 1.856 (#9) 1.987 (#3)
0.386 (#9) 0.386 (#9) 0.478 (#1) 0.478 (#1)
Table 5: The proportion of clean energy power generation from IFCF-PSP and LS models. Clean power generation ratio (%) 𝑝𝑖 = 0.1 𝑝𝑖 = 0.05 𝑝𝑖 = 0.01
t=1 [18.02, 24.32] [20.67, 24.65] [21.55, 25.30]
IFCF-PSP t=2 [20.89, 24.93] [20.93, 25.28] [21.58, 25.96]
𝑇
+ ∑𝐶𝐼𝐸±𝑡 × 𝐴𝐼𝐸±𝑡 𝑡=1 𝑇
𝐼
+ ∑ ∑𝐶𝑃𝑀𝑡𝑗± × 𝐴𝑃𝐺±𝑡𝑗 × 𝜂𝑡± 𝑡=1 𝑗=1
(11) Figure 5 shows the proportion of different power generation technologies from the IFCF-PSP and LS models under 𝑝𝑖 = 0.01 over three planning periods. The IFCF-PSP model leads to a relatively higher percentage of natural gas power generation; in comparison, the LS model leads to relatively higher percentages of coal-fired electricity supplies. According to the solutions from IFCF-PSP model, the percent of electricity generated by natural gas facilities would be [5, 6] %, [7, 8] %, and [5, 8] % in periods 1, 2, and 3, respectively. The LS model achieves the slightly lower percent (i.e. 0%, 0% and [5, 6] % in periods 1, 2, and 3.) Similarly, the results under other 𝑝𝑖 levels (𝑝𝑖 = 0.05 and 𝑝𝑖 = 0.1) can be interpreted. According to Table 5, the differences can be found between the results of two models under different 𝑝𝑖 levels. The proportion of clean energy power generation from IFCF-PSP model is higher than that of the LS model. For example, under 𝑝𝑖 = 0.01, clean energy power generation of the entire region occupied [21.55, 25.30], [21.58, 25.96], and [21.41, 25.96]% of the total electricity generation in
t=3
t=1
LS t=2
t=3
[19.86, 25.40] [20.10, 25.78] [21.41, 25.96]
[16.23, 18.70] [16.24, 18.70] [16.48, 18.93]
[16.81, 17.19] [16.81, 17.19] [16.79, 17.52]
[15.15, 16.38] [16.32, 18.69] [19.97, 22.24]
the three study periods from IFCF-PSP model, which are higher than the LS model [16.48, 19.93], [16.79, 17.52] and [19.97, 22.24]%, respectively. Similarly, the results under other 𝑝𝑖 levels (𝑝𝑖 = 0.05 and 𝑝𝑖 = 0.1) can be interpreted. An increased 𝑝𝑖 level represents a higher admissible risk, leading to a decreased strictness for the emission constraints and hence an expanded decision space. Therefore, under typical conditions, as the risk level becomes lower, the proportion of clean energy power generation or renewable power generation would increase. For example, in period 2, when the 𝑝𝑖 level is dropped from 0.1 to 0.01, the proportion of clean energy power generation from IFCF-PSP model would be increased from [20.89, 24.93]% to [21.58, 25.96]%. Likewise, the results under other periods can be similarly analyzed. The confidence level of constraints satisfaction is more reliable because the risk level is lower. Therefore, in this case, the decision-makers will be more conservative in the EPS management. There is no capacity-expansion would be conducted for the coal-fired facility in three periods, since its high carbon dioxide emissions and increasingly stringent emission limits. On the other hand, clean energy electricity supply would be insufficient for the future energy demands. According to Table 6, when 𝑝𝑖 takes different values (i.e., 𝑝𝑖 = 0.01, 𝑝𝑖 = 0.05, and 𝑝𝑖 = 0.1), differences of capacity-expansion option can be found between the results of two models. In both models, when the risk of violating the constraints of carbon emission target is decreased (i.e., the value of 𝑝𝑖 -level
10
Mathematical Problems in Engineering
5% 5%
9%
4%
4%
4%
4% 4% 4% 5% 9% 6% 1% 4% 8%
4%
8%
5% 4% 9% 8% 8% 7% 9%
75% 74% 74%
82% 78% 79% IFCFP-PSP @ +
IFCFP-PSP fwind solar
coal natural gas hydro 4% 7%
coal natural gas hydro
wind solar
4% 3%
4% 8%
4% 4%
4% 4% 5% 5% 0% 10% 2% 0% 9%
9% 5% 5% 7% 0% 9% 0%
83%
81%
83% 80%
83% 78% LS @ coal natural gas hydro
wind solar
LS @ + coal natural gas hydro
wind solar
Figure 5: Comparison of power-generation patterns from IFCF-PSP and least-system-cost (LS) models under 𝑝𝑖 -level 0.01. Note that the innermost circle in the pie chart represents the first planning period.
is larger), the demand for expansion of clean energy will increase. On the other hand, the total demand of capacity expansion in the lower bound model is lower than the upper bound model. One of the reasons for this result is that the annual utilization hours of various power generation facilities in the lower bound model are higher than the corresponding parameter settings of the upper bound model. The result of LS model has shown that, under the corresponding lower bound parameter settings, the capacity of 0.15 GW would be added to the hydropower facility in period 3 when 𝑝𝑖 = 0.01 and 𝑝𝑖 = 0.05. Only a capacity of 0.15 GW would be added to the wind power facility in period 3. While under the corresponding upper bound parameter settings, natural gas, and solar energy facilities expansions are not required, that is because the former resource is under penalty of CO2 emission and the capacity cost of the solar power expansion is much higher. In the IFCF-PSP model, clean energy will be given more development opportunities. Take 𝑝𝑖 = 0.01 as an example (corresponding to 𝑓− ), with a capacity expansion of 0.2
GW at the beginning of period 1 and period 2, electricity generation of wind power facility would rise from 16.4 103 GW in period 1 to 16.8 103 GW in period 2; and with another capacity expansion of 0.2 GW at the beginning of period 3, its total electricity generation capacity would reach 17.2 103 GW. Likewise, to meet the growing energy demand, the capacity of 0.2 GW would be added to the natural gas-fired facility in period 1, period 2, and period 3; as a result, its total generation capacity would rise from 9.54 × 10³ GW in period 1 to 11.9 × 10³ GW in period 2 and reach 12.4 × 10³ GW in period 3. In the planning period 1, due to more lenient emission policies and more economical cost strategies, some of the natural gas power generation facilities are idle. The capacities of 0.25 GW would be added to the hydropower facility in three periods, and the corresponding power generation capacity would be 8.12 × 10³ GW, 8.75 103 GW, and 9.37 × 10³ GW. Generating electricity from solar energy facility is more expensive than other power generation facilities; thus when the emission limits and electricity demand are relatively low, solar energy facility would not be expanded during first two periods. 0.15
Mathematical Problems in Engineering
11 Table 6: Binary solutions of capacity expansions.
𝑝𝑖 -level 0.1
Power-generation facility
Capacity-expansion option
Natural gas
m=1 m=2 m=3 m=1 m=2 m=3 m=1 m=2 m=3 m=1 m=2 m=3 m=1 m=2 m=3 m=1 m=2 m=3 m=1 m=2 m=3 m=1 m=2 m=3 m=1 m=2 m=3 m=1 m=2 m=3 m=1 m=2 m=3 m=1 m=2 m=3
Wind power
Solar energy
Hydropower
0.05
Natural gas
Wind power
Solar energy
Hydropower
0.01
Natural gas
Wind power
Solar energy
Hydropower
GW of capacity would only be added to the solar energy facility in period 3. Apparently, with the successful application of IFCIPSP within a typical regional electric system management problem, solutions obtained could provide useful decision alternatives under different policies and various energy availabilities. Compared with the least-cost model, the IFCFPSP model is an effective tool for providing environmental management schemes with dual objectives. In addition, the IFCF-PSP has following advantages over the conventional programming methods: (a) balancing multiple conflicting
t=1
IFCF-PSP t=2
t=3
t=1
LS t=2
t=3
0 0 1 0 0 [0, 1] 0 0 0 [0, 1] 0 [0, 1] 0 0 [0, 1] [0, 1] 0 [0, 1] 0 0 0 0 0 1 0 0 1 0 0 1 0 0 0 0 0 1
0 0 [0, 1] 0 [0, 1] [0, 1] 0 0 0 [0, 1] 0 [0, 1] 0 0 [0, 1] [0, 1] 0 [0, 1] 0 0 0 0 0 1 0 0 1 0 0 1 0 0 0 0 0 1
0 0 [0, 1] 0 0 [0, 1] 0 0 0 0 0 0 0 0 [0, 1] 0 0 0 0 0 0 0 0 0 0 0 1 0 0 [0, 1] 0 [0, 1] 0 0 0 [0, 1]
0 0 0 0 0 0 0 0 0 0 0 [0, 1] 0 0 0 0 0 0 0 0 0 0 0 [0, 1] 0 0 [0, 1] 0 0 [0, 1] 0 0 0 0 0 [0, 1]
0 0 0 0 [0, 1] 0 0 0 0 0 0 [0, 1] 0 0 0 0 [0, 1] 0 0 0 0 [0, 1] 0 [0, 1] 0 0 [0, 1] 0 0 [0, 1] 0 0 0 [0, 1] 0 [0, 1]
0 0 0 0 1 0 0 0 0 [0, 1] 0 0 0 0 0 0 1 0 0 0 0 [0, 1] 0 0 0 0 [0, 1] 0 [0, 1] [0, 1] 0 0 0 0 0 [0, 1]
objectives, (b) reflecting interrelationships among system efficiency, economic cost, and system reliability (c) effectively dealing with randomness in both the objective and constraints, and (d) assisting the analysis of diverse decision schemes associated with various energy demand levels.
5. Conclusions An inexact fuzzy chance-constrained fractional programming approach is developed for optimal electric power systems management under uncertainties. In the developed
12 model, fuzzy chance-constrained programming is incorporated into a fractional programming optimization framework. The obtained results are useful for supporting EPS management. The IFCF-PSP approach is capable of (i) balancing the conflict between two objectives; (ii) reflecting different electricity generation and capacity expansion strategies; (iii) presenting optimal solutions under different constraint violating conditions; and (iv) introducing the concept of fuzzy boundary interval, with which the complexity of dual uncertainties can be effectively handled. The results of IFCF-PSP model show that (i) a higher confidence level corresponds to a higher proportion of clean energy power generation and a lower economic productivity, and (ii) as a result of encouraging environment-friendly energies, the generation capacities for the natural gas, wind-power, solar energy, and hydropower facilities would be significantly increased. The solutions obtained from the IFCF-PSP approach could provide specific energy options for power system planning and provide effective management solution of the electric power system for identifying electricity generation and capacity expansion schemes. This study attempts to develop a modeling framework for ratio problems involving fuzzy uncertainties to deal with electric power systems management problem. The results suggest that it is also applicable to other energy management problems. In the future practice, IFCF-PSP could be further improved through considering more impact factors. For instance, the fuzzy membership functions and the confidence level are critical in the decision-making process, and this requires effective ways to provide appropriate choices for decision making. Such challenges desire further investigations. Future research can be aimed at applying the advanced approach to a more complex real-world electric power system.
Data Availability The data used to support the findings of this study are available from the corresponding author upon request.
Conflicts of Interest The authors declare that they have no conflicts of interest.
Acknowledgments This research was supported by the Fundamental Research Funds for the Central Universities, NCEPU (2018BJ0293), the State Scholarship Fund (201706735025), the National Key Research and Development Plan (2016YFC0502800), the Natural Sciences Foundation (51520105013, 51679087), and the 111 Program (B14008). The data used to support the findings of this study are available from the corresponding author upon request.
References [1] G. H. Huang, “A hybrid inexact-stochastic water management model,” European Journal of Operational Research, vol. 107, no. 1, pp. 137–158, 1998.
Mathematical Problems in Engineering [2] A. Grosfeld-Nir and A. Tishler, “A stochastic model for the measurement of electricity outage costs,” Energy, pp. 157–174, 1993. [3] S. Wang, G. Huang, and B. W. Baetz, “An Inexact ProbabilisticPossibilistic Optimization Framework for Flood Management in a Hybrid Uncertain Environment,” IEEE Transactions on Fuzzy Systems, vol. 23, no. 4, pp. 897–908, 2015. [4] G. H. Huang and D. P. Loucks, “An inexact two-stage stochastic programming model for water resources management under uncertainty,” Civil Engineering and Environmental Systems, vol. 17, no. 2, pp. 95–118, 2000. [5] K. Darby-Dowman, S. Barker, E. Audsley, and D. Parsons, “A two-stage stochastic programming with recourse model for determining robust planting plans in horticulture,” Journal of the Operational Research Society, vol. 51, no. 1, pp. 83–89, 2000. [6] J. Hu, L. Sun, C. H. Li, X. Wang, X. L. Jia, and Y. P. Cai, “Water Quality Risk Assessment for the Laoguanhe River of China Using a Stochastic Simulation Method,” Journal of Environmental Informatics, vol. 31, no. 2, pp. 123–136, 2018. [7] S. Wang and G. H. Huang, “A multi-level Taguchi-factorial twostage stochastic programming approach for characterization of parameter uncertainties and their interactions: An application to water resources management,” European Journal of Operational Research, vol. 240, no. 2, pp. 572–581, 2015. [8] S. Chanas and P. Zieli´nski, “On the equivalence of two optimization methods for fuzzy linear programming problems,” European Journal of Operational Research, vol. 121, no. 1, pp. 56– 63, 2000. [9] J. Mula, D. Peidro, and R. Poler, “The effectiveness of a fuzzy mathematical programming approach for supply chain production planning with fuzzy demand,” International Journal of Production Economics, vol. 128, no. 1, pp. 136–143, 2010. [10] B. Chen, P. Li, H. J. Wu, T. Husain, and F. Khan, “MCFP: A monte carlo simulation-based fuzzy programming approach for optimization under dual uncertainties of possibility and continuous probability,” Journal of Environmental Informatics (JEI), vol. 29, no. 2, pp. 88–97, 2017. [11] C. Z. Huang, S. Nie, L. Guo, and Y. R. Fan, “Inexact fuzzy stochastic chance constraint programming for emergency evacuation in Qinshan nuclear power plant under uncertainty,” Journal of Environmental Informatics (JEI), vol. 30, no. 1, pp. 63– 78, 2017. [12] U. S. Sakalli, “Optimization of Production-Distribution Problem in Supply Chain Management under Stochastic and Fuzzy Uncertainties,” Mathematical Problems in Engineering, vol. 2017, Article ID 4389064, 29 pages, 2017. [13] A. Charnes and W. W. Cooper, “Programming with linear fractional functionals,” Naval research logistics (NRL), pp. 181– 186, 1962. [14] N. I. Voropai and E. Y. Ivanova, “Multi-criteria decision analysis techniques in electric power system expansion planning,” International Journal of Electrical Power & Energy Systems, vol. 24, no. 1, pp. 71–78, 2002. [15] M. Chakraborty and S. Gupta, “Fuzzy mathematical programming for multi objective linear fractional programming problem,” Fuzzy Sets and Systems, vol. 125, no. 3, pp. 335–342, 2002. [16] Y. Deng, “A threat assessment model under uncertain environment,” Mathematical Problems in Engineering, vol. 2015, Article ID 878024, 12 pages, 2015. [17] W. Li, Z. Bao, G. H. Huang, and Y. L. Xie, “An Inexact Credibility Chance-Constrained Integer Programming for Greenhouse
Mathematical Problems in Engineering
[18]
[19]
[20]
[21]
[22]
[23]
[24]
[25]
[26]
[27]
[28]
[29]
[30]
[31]
[32]
Gas Mitigation Management in Regional Electric Power System under Uncertainty,” in Journal of Environmental Informatics, 2017. M. Paunovic, N. M. Ralevic, V. Gajovic et al., “Two-Stage Fuzzy Logic Model for Cloud Service Supplier Selection and Evaluation,” Mathematical Problems in Engineering, 2018. S. Wang, G. H. Huang, B. W. Baetz, and B. C. Ancell, “Towards robust quantification and reduction of uncertainty in hydrologic predictions: Integration of particle Markov chain Monte Carlo and factorial polynomial chaos expansion,” Journal of Hydrology, vol. 548, pp. 484–497, 2017. S. Wang, B. C. Ancell, G. H. Huang, and B. W. Baetz, “Improving Robustness of Hydrologic Ensemble Predictions Through Probabilistic Pre- and Post-Processing in Sequential Data Assimilation,” Water Resources Research, 2018. M. G. Iskander, “A suggested approach for possibility and necessity dominance indices in stochastic fuzzy linear programming,” Applied Mathematics Letters, vol. 18, no. 4, pp. 395–399, 2005. A. Rong and R. Lahdelma, “Fuzzy chance constrained linear programming model for optimizing the scrap charge in steel production,” European Journal of Operational Research, vol. 186, no. 3, pp. 953–964, 2008. X. Sun, J. Li, H. Qiao, and B. Zhang, “Energy implications of China’s regional development: New insights from multiregional input-output analysis,” Applied Energy, vol. 196, pp. 118–131, 2017. M. A. Quaddus and T. N. Goh, “Electric power generation expansion: Planning with multiple objectives,” Applied Energy, vol. 19, no. 4, pp. 301–319, 1985. C. H. Antunes, A. G. Martins, and I. S. Brito, “A multiple objective mixed integer linear programming model for power generation expansion planning,” Energy, vol. 29, no. 4, pp. 613– 627, 2004. J. L. C. Meza, M. B. Yildirim, and A. S. M. Masud, “A model for the multiperiod multiobjective power generation expansion problem,” IEEE Transactions on Power Systems, vol. 22, no. 2, pp. 871–878, 2007. J.-H. Han, Y.-C. Ahn, and I.-B. Lee, “A multi-objective optimization model for sustainable electricity generation and CO2 mitigation (EGCM) infrastructure design considering economic profit and financial risk,” Applied Energy, vol. 95, pp. 186–195, 2012. M. Rekik, A. Abdelkafi, and L. Krichen, “A micro-grid ensuring multi-objective control strategy of a power electrical system for quality improvement,” Energy, vol. 88, pp. 351–363, 2015. A. Azadeh, Z. Raoofi, and M. Zarrin, “A multi-objective fuzzy linear programming model for optimization of natural gas supply chain through a greenhouse gas reduction approach,” Journal of Natural Gas Science and Engineering, vol. 26, pp. 702– 710, 2015. K. Li, L. Pan, W. Xue, H. Jiang, and H. Mao, “Multi-objective optimization for energy performance improvement of residential buildings: a comparative study,” Energies, vol. 10, no. 2, p. 245, 2017. H. Zhu, W. W. Huang, and G. H. Huang, “Planning of regional energy systems: An inexact mixed-integer fractional programming model,” Applied Energy, vol. 113, pp. 500–514, 2014. F. Chen, G. H. Huang, Y. R. Fan, and R. F. Liao, “A nonlinear fractional programming approach for environmentaleconomic power dispatch,” International Journal of Electrical Power & Energy Systems, vol. 78, pp. 463–469, 2016.
13 [33] C. Zhang and P. Guo, “FLFP: A fuzzy linear fractional programming approach with double-sided fuzziness for optimal irrigation water allocation,” Agricultural Water Management, vol. 199, pp. 105–119, 2018. [34] L. Wang, G. Huang, X. Wang, and H. Zhu, “Risk-based electric power system planning for climate change mitigation through multi-stage joint-probabilistic left-hand-side chanceconstrained fractional programming: A Canadian case study,” Renewable & Sustainable Energy Reviews, vol. 82, pp. 1056–1067, 2018. [35] D. Dubois and H. Prade, “Operations on fuzzy numbers,” International Journal of Systems Science, vol. 9, no. 6, pp. 613– 626, 1978. [36] X. H. Nie, G. H. Huang, Y. P. Li, and L. Liu, “IFRP: A hybrid interval-parameter fuzzy robust programming approach for waste management planning under uncertainty,” Journal of Environmental Management, vol. 84, no. 1, pp. 1–11, 2007. [37] Y. Leung, Spatial analysis and planning under imprecision, Elsevier, 1st edition, 2013. [38] A. Charnes, W. W. Cooper, and M. J. L. Kirby, “Chanceconstrained programming: an extension of statistical method,” in Optimizing methods in statistics, pp. 391–402, Academic Press, 1971. [39] Y. P. Cai, G. H. Huang, Z. F. Yang, and Q. Tan, “Identification of optimal strategies for energy management systems planning under multiple uncertainties,” Applied Energy, vol. 86, no. 4, pp. 480–495, 2009.
Advances in
Operations Research Hindawi www.hindawi.com
Volume 2018
Advances in
Decision Sciences Hindawi www.hindawi.com
Volume 2018
Journal of
Applied Mathematics Hindawi www.hindawi.com
Volume 2018
The Scientific World Journal Hindawi Publishing Corporation http://www.hindawi.com www.hindawi.com
Volume 2018 2013
Journal of
Probability and Statistics Hindawi www.hindawi.com
Volume 2018
International Journal of Mathematics and Mathematical Sciences
Journal of
Optimization Hindawi www.hindawi.com
Hindawi www.hindawi.com
Volume 2018
Volume 2018
Submit your manuscripts at www.hindawi.com International Journal of
Engineering Mathematics Hindawi www.hindawi.com
International Journal of
Analysis
Journal of
Complex Analysis Hindawi www.hindawi.com
Volume 2018
International Journal of
Stochastic Analysis Hindawi www.hindawi.com
Hindawi www.hindawi.com
Volume 2018
Volume 2018
Advances in
Numerical Analysis Hindawi www.hindawi.com
Volume 2018
Journal of
Hindawi www.hindawi.com
Volume 2018
Journal of
Mathematics Hindawi www.hindawi.com
Mathematical Problems in Engineering
Function Spaces Volume 2018
Hindawi www.hindawi.com
Volume 2018
International Journal of
Differential Equations Hindawi www.hindawi.com
Volume 2018
Abstract and Applied Analysis Hindawi www.hindawi.com
Volume 2018
Discrete Dynamics in Nature and Society Hindawi www.hindawi.com
Volume 2018
Advances in
Mathematical Physics Volume 2018
Hindawi www.hindawi.com
Volume 2018