World Academy of Science, Engineering and Technology International Journal of Computer and Information Engineering Vol:4, No:4, 2010
Integration of Support Vector Machine and Bayesian Neural Network for Data Mining and Classification Essam Al-Daoud
International Science Index, Computer and Information Engineering Vol:4, No:4, 2010 waset.org/Publication/11562
Abstract—Several combinations of the preprocessing algorithms, feature selection techniques and classifiers can be applied to the data classification tasks. This study introduces a new accurate classifier, the proposed classifier consist from four components: Signal-toNoise as a feature selection technique, support vector machine, Bayesian neural network and AdaBoost as an ensemble algorithm. To verify the effectiveness of the proposed classifier, seven well known classifiers are applied to four datasets. The experiments show that using the suggested classifier enhances the classification rates for all datasets.
Keywords—AdaBoost, Bayesian neural network, Signal-toNoise, support vector machine, MCMC.
C
I. INTRODUCTION
LASSIFICATION is one of the oldest and the most important method of data mining. Supervised classification means learning from data that is already classified correctly, and using the pre-built model to classify the new data. Four important criteria can be used to compare between the classifiers: the percent of instances that are classified correctly (the accuracy), the computational cost of both learning model and testing process (the speed), the ability to cope with noisy or missing data (the robustness) and the ability to cope with very large amounts of data (the scalability). Many classification methods are introduced in the previous studies, K-nearest neighbors (KNN) is one of the simplest and useful methods. The main idea of KNN is that it treats all the samples as points in the m-dimensional space and classifies the new data by a vote of K-nearest training instances as determined by some distance metric, typically Euclidean distance [1]. Multilayered Perceptrons (Artificial Neural Networks) have been used in data mining and classification. The standard ANN algorithm adjusts weights by propagating the error between network outputs and employs gradient descent optimization to minimize the error function. Several modified NN models are developed and implemented in the previous studies, see[2], [3]. Radial Basis Function (RBF) networks have been also widely applied in many science and engineering fields [4]. Each hidden unit in the RBF network implements a radial activation function and each output unit implements a weighted sum of hidden units outputs. To
complete the training process a set of linear equations must be solved. Naive Bayes classifiers are very simple Bayesian networks which are composed of directed acyclic graphs with only one parent and several children with a strong assumption of independence among child nodes in the context of their parent. The major advantage of the naive Bayes classifier is its short computational time for training [5]. Support Vector Machines (SVMs) are relatively new supervised machine learning technique. The key features of SVMs are the use of kernels, the absence of local minima, the sparseness of the solution and the capacity control obtained by optimizing the margin. Different types of SVM and SVM extensions have been proposed such as: Least squares support vector machine (LSSVM), Lagrangian support vector machine (LSVM), Newton support vector machine (NSVM), Smooth support vector machine (SSVM), Fuzzy support vector machine (FSVM) and Hidden space support vector machines (HSSVM) [6]. Ensemble learning techniques have been shown to increase machine learning accuracy by combining two or more classifiers, which are trained as separately and then combined to form a network of learners that has a higher accuracy than any single component [7]. II. THE PROPOSED CLASSIFIER Let the training data Dtrain= {Ytrain, Xtrain} where Ytrain={y1,y2,…,yn}, Xtrain={x1, x2, …,xn}, the target yi is the known label associated with the feature vector xi, if there are m classes in the classification problem then yi ∈ A ⊂ ℜ , xi
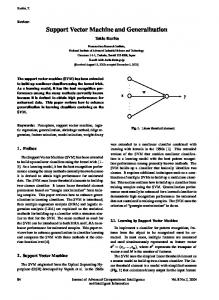
∈ B ⊂ ℜ t and t is the number of the features. The proposed classifier consist from four components: Signal-to-Noise as a feature selection technique, support vector machine, Bayesian neural network and AdaBoost as an ensemble algorithm. Fig. 1 shows the components of the suggested classifier.
Fig. 1 The components of the suggested classifier.
E. Al-Daoud is with faculty of Science and Information Technology, Computer Science Department, Zarka Private University, Jordan (Tel +962796680005, e-mail:
[email protected]).
International Scholarly and Scientific Research & Innovation 4(4) 2010
678
scholar.waset.org/1307-6892/11562
World Academy of Science, Engineering and Technology International Journal of Computer and Information Engineering Vol:4, No:4, 2010
Signal-to-Noise ranks the features with the ratio of the "signal" (the difference between the mean values of the two classes), and the "noise" (the within class standard deviation). This criterion is similar to the Fisher criterion, the Ttest criterion, and the Pearson correlation coefficient. It can be thought of as a linear univariate feature ranking method. The top ranking features are selected and the new data matrix returned. S 2N =
| μ+ − μ− | σ+ +σ−
P ( y new | x new , X train , Ytrain ) =
∫ P( y new | x new , w) P(w | X train , Ytrain )
= ∫ f ( x new , w)( P( w | X train , Ytrain ) dw
P( w | X train , Ytrain ) =
P( w)
International Science Index, Computer and Information Engineering Vol:4, No:4, 2010 waset.org/Publication/11562
III. BAYESIAN NEURAL NETWORK
P( y new | x new , w) =
f ( x new , w) =
1 1 + exp(− g ( x new , w)
Where g ( x new , w) = b +
H
n
j =1
i =1
∑ v j tanh(a j + ∑ u ji xi )
(3)
n
(4)
i =1
Where (yi, xi) are training case i. Thus the following conditional distribution can be used to classify the test data xnew : P ( y new | x new , w ) Unfortunately, using a single network, that is, a single point w0 in the parameter space, difficulties with local maxima and overfitting can arise. In the Bayesian approach, one performs a weighted average over all points, that is, all networks. Bayesian predictions are found by integration rather than maximization. For a test case xnew, ynew is predicted using
International Scholarly and Scientific Research & Innovation 4(4) 2010
P(Ytrain | X train , w)
∫ P( w) P(Ytrain , X train , w)
dw
n
∝ P( w)∏ P( y i | xi , w)
(6)
i =1
Every Bayesian inference requires the specification of a prior P(w). Experience suggests that a reasonable class to choose from is the class of Gaussian priors centered at zero, which favors smaller rather than larger weights. Smaller weights yield smoother fits to data. For realistic applications, the dimensionality of the parameter space of the functions f (x, w) is typically very complex. The integrations required by Bayesian approach can be approximated using Markov Chain (2) Carlo (MCMC) methods, such as that implemented in Monte the FBM software [8] and MCMCstuff Toolbox [9]. MCMC method is used to generate a sample of points, w1,w2, …, wk which are drawn from the posterior density P( w | X train , Ytrain ) . Thus the integral, can be approximated as following
Where n is the dimensionality of the feature vectors, that is, the inputs, and H is the number of hidden nodes. The parameters w = (b; v; a; u) are generally referred to as weights. The standard NN Learning can be viewed as maximum likelihood estimation for the network parameters. The value of weights w is computed by maximizing: w = ∏ p ( y i | xi , w)
(5)
The above posterior distribution is
(1)
The Bayesian neural networks (BNN) is an algorithm of the neural networks trained by Bayesian statistics. It is not only suitable for the non-linear functions, but it also can be used to discover more general relationships in data than the traditional statistical methods. Furthermore, by using BNN we can avoid neural networks problems such as local maxima and overfitting. The multilayer perceptron network, with a hidden layer and tanh activation function can be described as follows:
dw
P ( y new | x new , X train , Ytrain ) ≈
1 k ∑ f ( x new , wi ) k i =1
(7)
IV. SUPPORT VECTOR MACHINES Support Vector Machines (SVM) have been successfully applied to a wide range of pattern recognition and classification problems including handwriting recognition, face detection, and microarray gene expression analysis. SVMs start from the goal of finding the maximum margin hyperplane which divides the target classes into two sets. Let the first target class equal to "1" and the second target class equal to "-1", the general hyperplane can be written as: WT. X - b = 0
(8)
Where W is the weights and X is a vector. The hyperplane should separate the data, so that WTxi + b ≥ 1 for all the xi of one class, and WTxi + b ≤ - 1 for all the xi of the other class
679
scholar.waset.org/1307-6892/11562
World Academy of Science, Engineering and Technology International Journal of Computer and Information Engineering Vol:4, No:4, 2010
Let the target classes be yi ∈ {1, -1}, then the above inequalities can be rewritten as yi (WTxi + b)
≥1
(9)
In the case of no hyperplane that can split the target classes, the Soft Margin method will choose a hyperplane that splits the classes with minimum error, and maximum margin, therefore, the SVM optimization problem can be rewritten as following: min
W ,b,ξ
l
1 T W W + C∑ ξi 2 i =1
(10)
International Science Index, Computer and Information Engineering Vol:4, No:4, 2010 waset.org/Publication/11562
Subject to
Two popular Ensemble techniques exist: Bagging and AdaBoost. In Bagging each classifier is trained on a bootstrap replicate of the original training set. AdaBoost (short for Adaptive Boosting) was the particular variant of boosting. It adaptively changes distribution of training data by focusing more on previously misclassified records. Patterns that are wrongly classified will have their weights increased. Unlike Bagging, weights may change at the end of a boosting round. Algorithm 1 describes AdaBoost steps for k classifier. Algorithm 1: AdaBoost Input: n the size of the training set and the classifiers f1, f2,…,fk, where is k the number of the classifiers. Output: The final classifier g(X). Steps: 1- Let λ1i =1, ∀i = 1...n 2- For j= 1 to k
yi (WTxi + b) ≥ 1- ξ i ξi ≥ 0
⎧1 2.1- β i = ⎨ ⎩0
For non-linear cases, the data must be mapped into a richer feature space. SVMs use an implicit mapping Φ of the input data into a high-dimensional feature space defined by a kernel function, then construct a hyperplane in that space. This allows us to apply the previous linear classification techniques to the non-linear features. A general kernel equation is: 2 k ( x1 , x 2 ) = (t + x1 .x 2 ) d e ( − h|| x1 − x2 || )
Mostly used kernels are: Linear Kernel: d=1, t=0 and h=0. Polynomial degree N Kernel: d=N, t= RBF Kernel: d=0, t=0 and h= γ .
2.2-
f j ( xi ) ≠ y i f j ( xi ) = y i
if if
Use the classifier j to minimize the objective function: n
εj =
(11)
∑ λij β i
i =1 n
∑ λij
i =1
β
and h=0.
2.3- w j = ln
1− ε j
ε
j
2.4- for i=1 to n Thus the Non-linear form is: l 1 T W W + C∑ ξi W ,b,ξ 2 i =1
min
λij +1 = λij e (12)
3- The final classifier is
Subject to
⎛ k ⎞ g(X)=sign ⎜ ∑ w j f j ( X ) ⎟ ⎜ ⎟ ⎝ j =1 ⎠
yi (WT Φ (xi ) + b) ≥ 1- ξ i
ξi ≥ 0 There are two parameters while using RBF kernels: C and γ . It is not known which C and γ are the best for one problem; Consequently, parameter search must be performed before training the classifier [10]. V. ENSEMBLE LEARNING Ensemble techniques for classification use a combination of many classifiers instead of using just one classifier[11]. One can try to obtain this result by taking a base learning algorithm and re-implementing it several times on different training sets.
International Scholarly and Scientific Research & Innovation 4(4) 2010
w j βi
VI. DATASETS Four classification problems are used. All the datasets have many features and one discreet target. The basic information about the datasets is summarized in Table 1. The following is a brief description about the datasets: Breast Cancer: Features are computed from a digitized image of a fine needle aspirate (FNA) of a breast mass. They describe characteristics of the cell nuclei present in the image. Separating plane described above was obtained using Multisurface Method-Tree (MSM-T). a classification method
680
scholar.waset.org/1307-6892/11562
International Science Index, Computer and Information Engineering Vol:4, No:4, 2010 waset.org/Publication/11562
World Academy of Science, Engineering and Technology International Journal of Computer and Information Engineering Vol:4, No:4, 2010
which uses linear programming to construct a decision tree. Relevant features were selected using an exhaustive search in the space of 1-4 features and 1-3 separating planes. ARCENE: The task of ARCENE is to distinguish cancer versus normal patterns from mass spectrometric data. This is a two-class classification problem with continuous input variables. The data were obtained from two sources: The National Cancer Institute (NCI) and the Eastern Virginia Medical School (EVMS). All the data consist of mass-spectra obtained with the SELDI technique. The samples include patients with cancer (ovarian or prostate cancer), and healthy or control patients. Statlog (Heart): is used to diagnose the heart disease. The attributes in this dataset include: the age, sex, chest pain type, resting blood pressure, serum cholestoral in mg/dl, fasting blood sugar, maximum heart rate achieved and the slope of the peak exercise ST segment. MADELON : The task of MADELON is to classify random data. This is a two-class classification problem with sparse binary input variables. The data is synthetic. It was generated by a Matlab code. TABLE I THE BASIC INFORMATION ABOUT THE DATASETS Dataset Breast Cancer
#Patterns
#Features
#Classes
569
10
2
200
10000
2
270
13
2
2600
500
2
(BC) ARCENE Statlog Heart (SH) MADELON
Breast Cancer (BC) and Statlog Heart (SH) datasets Can be downloaded from the center of Machine Learning and Intelligent Systems at university of California http://cml.ics.uci.edu/. ARCENE and MADELON datasets can be found at NIPS 2003 feature selection challenge site: http://nipsfsc.ecs.soton.ac.uk/. VII. EXPERIMENTAL RESULTS Matlab 7.0, MCMCstuff toolbox and CLOP package are used to implement and to compare the state-of-art classification methods [9],[12]. A k-folding scheme with k=4 is applied to Breast Cancer (BC) and Statlog Heart (SH) datasets. The training procedure for each dataset is repeated 4 times, each time with 75% of the patterns as training and 25% for testing. All the reported results are obtained by averaging the outcomes of the 4 separate tests. In ARCENE dataset, 100 patterns are used for training and 100 patterns are used for testing. Whereas in MADELON datasets, 2000 patterns are used for training and 600 patterns are used for testing. Several combinations of the preprocessing, feature selection and
International Scholarly and Scientific Research & Innovation 4(4) 2010
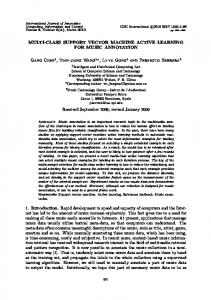
classification methods are implemented. The preprocessing methods are: • ST: Standardization of the columns of the data matrix (feature) by subtracting the mean and dividing by the standard deviation. • NM: Normalization of the lines of the data matrix by dividing by the Euclidean norm. • SS: Global data matrix normalization by subtracting shift and dividing by scale. • PCA: Reducing the features using the principal component analysis. • SUB: Selection of a subset of the training patterns. The Feature selection methods: • GS: Selection with Gram-Schmidt orthogonalization. • RE: Ranking with the Relief score. • RF: Ranking with Random Forests. • S2N: Ranking with the signal-to-noise ratio. • RFE: Ranking with recursive feature elimination using a SVC classifier. The Classification methods: • KR: Kernel Ridge Regression. • NA: Naive Bayes. • NN: Neural Network with one hidden layer. • RFC: Random Forest Classifier. • NSVC: Non-linear Support Vector Classifier. • LSVC: Linear Support Vector Classifier. • BNN: Bayesian Neural Network. • Proposed: Ensemble of SVC and BNN. Table 2 summarizes the balanced error rates (BER) and the area under the curve (AUC) for each method and each dataset. It is clear that the proposed method is the most accurate classifier and it has the lowest BER and the highest AUC. Accurate results can also be obtained by using nonlinear SVC and neural network with suitable pre-processing and feature selection methods such as methods 5, 9, 12 and 25. Fig. 2 shows the BER of the top 15 accurate methods. It compares the contribution for each BER to a total across the methods. For example when the proposed method (method 26) is applied, the BER is 2.15 for BC and zero for the other datasets. whereas if method 22 is applied, then BER is 10.9, 15, 28.33 and 36.33 for BC, SH, ARCENE and MADELON, respectively. Table 3 shows the training and the testing time for each method. To find the time per pattern, we have to divide the shown time by the number of the patterns in the given dataset. The required training and testing time by the proposed method is acceptable with compare to other accurate methods such as method 5, 9, 12 and 25. It can be observed that the testing time needs less than 1/10 second per pattern for any dataset.
681
scholar.waset.org/1307-6892/11562
World Academy of Science, Engineering and Technology International Journal of Computer and Information Engineering Vol:4, No:4, 2010
TABLE II THE BALANCED ERROR RATES (BER) AND THE AREA UNDER THE CURVE (AUC) FOR EACH METHOD
Method
Pre Process
1 2 3
PCA ST
4
NM+SS
Classifier
GS
S2N
CANCER
HEART
ARCENE
BER
AUC
BER
AUC
KR
8.53
96.7
10.83
KR LSVC
8.53 7.54
97.2 95.2
10.83 6.67
MADELON
BER
AUC
95
9.9
96.96
38.5
66.92
95 94.44
0.89 17.29
100 95.17
38.83 31.33
65.98 76.86
39
68.06
NA
50
87
49.17
75.56
50
78.21
97.8
10.83
96.11
BER
AUC
5
ST
NSVC
6.15
0
100
0
100
6
RFE
SVC
7.54
96.3
6.67
94.44
0
100
38.33
65.01
7
ST
RE
NN
6.15
98.8
99.15
50
47
RFC
20.2
93
100 92.78
4.06
S2N+RF
0 20
0
100
0.5
99.99
S2N
NSVC KR
4.76 8.53
99.3 97.2
0 10.83
100 95
0 0
100 100
0.33 26.83
100 80.43
11
NA
44.4
96.2
23.3
94.44
31.66
83.08
50
69.38
12
NN
5.15
98.5
0
100
39.94
60.43
50
51.19
NA
47.2
96.2
20
95.56
31.66
82.75
50
68.6
NSVC
9.92
97.9
10.83
95.56
0
100
0
100
NSVC
9.52
98.8
3.33
98.89
0
100
0.5
99.96
NA
15.6
96.2
11.67
95
51.95
45.25
27.5
80.4
NA NA
44.4 22.6
96.2 92.5
23.33 24.17
94.44 89.44
31.66 0
83.08 100
50 0
69.38 100
RFC
44.4
96.2
23.33
94.44
31.66
83.08
50
69.38
NA
44.4
96.2
23.33
94.44
31.66
83.08
50
69.38
NA
47.6
96.2
33.33
94.44
31.66
83.08
50
69.38
8 9 10
ST+NM
13
NM
14 15
NM
16
PCA
RE
17 18
RE RF
19 20
S2N
21
SS
22
ST
NA
10.9
96.2
15
94.44
28.33
83.08
36.33
69.38
LSVC
33.3
93.7
24.17
93.89
30.11
77.39
38
62.98
NA
44.4
96.2
23.33
94.44
31.66
83.08
50
69.38
S2N
BNN
6.15
98
0
100
0
100
0.5
99.96
S2N
Proposed
2.15
99.6
0
100
0
100
0
100
23 24
RFE
25 26
BER
International Science Index, Computer and Information Engineering Vol:4, No:4, 2010 waset.org/Publication/11562
Feature Selection
NM
100 90 80 70 60 50 40 30 20 10 0
BC SH ARCENE MADELON
26
9
25
15
5
14
8
10
18
6
2
7
3
1
22
Method Fig. 2 BER of the top 15 accurate methods
International Scholarly and Scientific Research & Innovation 4(4) 2010
682
scholar.waset.org/1307-6892/11562
World Academy of Science, Engineering and Technology International Journal of Computer and Information Engineering Vol:4, No:4, 2010
Method
Pre Process
1
GS
ARCENE
MADELON
Train
Test
Train
Test
KR
0.04
0.01
0.047
0.015
3.616
0.81
2.4
0.234
KR LSVC
0.04 0.10
0.01 0.01
0.062 0.093
0.016 0.016
2.79 3.366
1.605 0.81
4.146 23.28
0.468 0.234
2 3
PCA ST
4
NM+SS
NA
0.07
0.03
0.062
0.015
0.686
0.811
0.717
0.374
5
ST
NSVC
0.12
0.04
0.125
0.032
5.222
13.06
53.25
89.96
6
RFE
SVC
0.20
0.01
0.14
0.016
8.806
0.794
58.86
0.233
7
ST
8 9 10
International Science Index, Computer and Information Engineering Vol:4, No:4, 2010 waset.org/Publication/11562
Feature Selection
TABLE III THE TRAINING AND THE TESTING TIME FOR EACH METHOD CANCER HEART Classifier Train Test Train Test
ST+NM
S2N
RE
NN
0.71
0.01
0.468
0.015
2.26
0.81
6.203
0.234
S2N+RF
RFC
0.01
0
0.032
0.016
0.016
0.015
0.109
0.093
S2N
NSVC KR
0.06 0.01
0.03 0.01
0.062 0.016
0.031 0.016
0.935 0.421
1.48 0.218
2.853 4.099
4.832 0.047
NA
0.01
0
0.015
0
0.452
0.234
0.312
0.046
NN
0.49
0.01
0.343
0.016
16.24
0.311
6.375
0.078
NA
0.01
0.01
0.016
0.016
0.702
0.624
0.53
0.172
NSVC
0.06
0.01
0.031
0.031
4.255
5.814
58.79
97.53
NSVC
0.14
0.03
0.063
0.031
1.917
0.841
6.188
2.743
NA
0.01
0.01
0.016
0.015
2.634
1.73
3.865
1.044
NA NA
0.09 0.01
0.01 0.01
0.031 0.016
0.015 0.015
2.135 0.031
0.499 0.016
4.036 0.141
0.14 0.11
11 12 13
NM
14 15
NM
16
PCA
17 18
RE
RE RF
19 20
S2N
RFC
0.03
0.01
0.031
0.016
0.639
0.499
0.561
0.14
NA
0.01
0.01
0.015
0.016
0.872
0.514
0.608
0.124
21
SS
NA
0.01
0.01
0.015
0.015
0.733
0.608
0.515
0.172
22
ST
NA
0.01
0
0.016
0.015
0.982
0.81
0.639
0.234
LSVC
0.28
0.01
0.031
0.015
4.535
0.233
23.31
0.046
23 24
RFE
NA
298.
0
251.7
0.015
13.07
0.483
58.26
0.125
25
S2N
BNN
0.52
0.01
0.44
0.01
18.11
0.110
8.51
0.080
S2N
Proposed
0.58
0.04
0.51
0.04
18.21
0.310
16.51
10.08
26
NM
REFERENCES [1] [2] [3] [4] [5] [6] [7] [8] [9]
T.M. Mitchell, Machine learning. McGraw-Hill, New York, NY, USA, 1997. E. Al-Daoud, "A comparison between three neural network models for classification problems," Journal of Artificial Intelligence, vol. 2, no. 2, pp. 56-64, 2009. E. Al-Daoud, "Identifying DNA splice sites using patterns statistical properties and fuzzy neural networks," EXCLI Journal, vol. 8, pp. 195202, 2009. P. Venkatesan and S. Anitha, "Application of a radial basis function neural network for diagnosis of diabetes mellitus," Current Science, vol. 91, no. 9, pp. 1195-1199, Nov. 2006. R. Bouckaert, "Naive Bayes classifiers that perform well with continuous variables," Lecture Notes in Computer Science, vol 3339, pp. 1089-1094, 2004. I. Steinwart and A. Christmann, Support Vector Machines. Springer, New York, 2008. R. Polikar, "Ensemble based systems in decision making," IEEE Circuits and Systems Magazine, vol. 3, pp. 21–45, 2006. R. M. Neal, Bayesian learning of neural networks, Springer-Verlag, New York, 1996. Z. Waszczyszyn and L. Ziemiański, "Neurocomputing in the analysis of selected inverse problems of mechanics of structures and materials," Computer Assisted Mechanics and Engineering Sciences, vol. 13, no. 1 pp. 125-159, 2006. www.lce.hut.fi/research/mm/mcmcstuff.
International Scholarly and Scientific Research & Innovation 4(4) 2010
[10] C. W. Hsu, C. C. Chang and C. J. Lin. "A practical guide to support vector classification," Technical report, Department of Computer Science, National Taiwan University. July, 2003. [11] H. B. Hashemi, A. Shakery and M. P. Naeini, "Protein fold pattern recognition using bayesian ensemble of RBF neural networks" 2009 International Conference of Soft Computing and Pattern Recognition, pp. 436-441. 2009. [12] CLOP Package http://www.modelselect.inf.ethz.ch
683
scholar.waset.org/1307-6892/11562