Keywords: tactile graphics display, Braille display, Braille color code, digital .... violet, green, orange and brown, are coded as combinations of the primary color's.
Interaction with Colored Graphical Representations on Braille Devices Christiane Taras and Thomas Ertl Institute of Visualization and Interactive Systems, Universität Stuttgart, Universitätsstr. 38, 70569 Stuttgart, Germany {taras, ertl}@vis.uni-stuttgart.de
Abstract. For several years there has been the wish to make colors accessible to blind people. Colors are all around us and sighted people often talk about colors as it is a simple means of distinguishing objects. They are used in educational materials to ease perception, support comprehension, and focus on different aspects. In this paper we present a new color code for viewing and editing colored graphics on Braille devices and report on our experiences with presenting graphics on Braille devices and our ongoing work on exploration strategies. Keywords: tactile graphics display, Braille display, Braille color code, digital graphics, blind and visually impaired people, exploration strategies
1
Introduction
The Institute for Visualization and Interactive Systems (VIS) is currently involved in a project called ―HyperBraille‖ that aims to improve the access to graphical user interfaces for blind people [4]. One task in HyperBraille is to design representations of graphical user interfaces for the tactile display. This task is accomplished by a team of blind and sighted people. Hence, there was a desire to share ideas on which pins should be lifted and which not between sighted and blind people easily. No existing tool could fulfill our needs. Of course, for the sighted people the easiest way was to create ordinary bitmaps just showing the lifted pins as black pixels and the lowered as white pixels. The blind partners could utilize the textual format SVG (Scalable Vector Graphics) [14]. But the problem with this was that the blind partners had no means to check how the graphic would be presented on the Braille device. Existing tools did not provide pixel precise graphics embossing or presentation on a Braille display. In the following chapters we report on a tool set called ―HBGraphicsExchange‖ which we have developed to solve this problem. Together with this we have designed three file formats to facilitate the creation of graphics with the help of Braille devices. The first format, called ―Elementary FigureBraille‖ (EFB), is a very simple one for creating and sharing monochrome images. This worked well until someone wanted to add text to the designs. Therefore, we created ―Object FigureBraille‖ (OFB). In parallel we worked on presenting colors and defined ―Detailed FirgureBraille‖ (DFB).
2
Christiane Taras and Thomas Ertl
With this we continue our longtime research in providing graphics to the blind. VIS has several years of experiences with presenting graphics to blind people on the tactile graphics display called ―Stuttgarter Stiftplatte‖. However, in former times, we mostly concentrated on presenting and exploring graphics and not on editing. Inspired through the work in HyperBraille we began targeting our work not only to Braille graphics displays like the new BrailleDis 9000 [11] but also on single-lined Braille displays. These are used in everyday life and so improvements for these devices bring direct benefit. We also further developed the presentation and exploration strategies presented by Rotard and Ertl in [6]. And we will report on our new ideas on this.
2
Related Work
Some work has been done on digital viewing and exploring of graphics for the blind (e.g. [6], [3]) and also on digital editing (e.g. [2]), but till now there is a lack of combining both parts interactively. Also SVG [14] and ASCII drawing [12] can be utilized for editing graphics on a Braille device. But the textual representation of SVG is rather long and for ASCII drawings no pixel-precise conversion to bitmaps is defined and the representation on the Braille device is not fully congruent to the created shapes. Different approaches for coding colors for the blind have been presented. The most common ones are the conversion of colors into different textures (e.g. for swell paper) or gray scale (e.g. for embossers). Unfortunately, these methods are not standardized, often destruct the color information and are not suitable for Braille devices as with only two pin states only a few textures can be used and gray scale is not possible. There are attempts to create a standardized color code like the Barker Color Code [1], the Tactile Colour Code [8], and the Tactile Vision Color Code System [9]. All these color codes have in common that they were only designed for presenting static graphics. The designers did not think of interaction with the graphics which means being able to explore and modify them. Of course, also things like paper-based tactile graphics reveal ways of exploring the graphics by preparing several views. But modifying a graphic and providing the new graphic to others is hard with these techniques. Braille displays reveal many possibilities for interacting with digital graphics. None of the color codes mentioned above is suitable for these devices.
3
Simple Braille Graphics – Elementary FigureBraille (EFB)
The EFB format is somehow the interactive form of drawing with a Braille writing machine. Each EFB sign represents six pixels. For monochrome images each black pixel is represented by a set dot (or lifted pin) and each white one by an unset dot (or lowered pin). For colored graphics the EFB representation depends on the applied color filter (see section 6). By default a colored graphic is converted to EFB by showing a dot for each pixel except white ones. The user creates a graphic by inputting Braille codes on the Braille keyboard or characters on the standard keyboard into
Interaction with Colored Graphical Representations on Braille Devices
3
an text file. EFB files can be converted to raster graphics by using the conversion table shown in Table 1 and drawing a pattern of black (for 1) and white (for 0) pixels that is aligned like a 6-dot Braille sign into a bitmap with no space between the dots, signs, or lines. Table 2 shows two example images and their EFB representations. Table 1. EFB coding (matrix with first three dots in rows and last three dots in columns) Dots 123… 000… 100… 010… 110… 001… 101… 011… 111…
…000 space a , b . k ; l
…100 " c i f | m s p
…010 ! e : h * o + r
…456 …110 …001 > ' d 1 j ? g 2 ` n u t ( q v
…101 $ 3 9 6 0 x ~ &
…011 < 5 / 8 ) z = {
…111 _ 4 w 7 # y } %
Table 2. EFB coding of two sample images (The images in the left column are enlarged and their pixels are marked by a grid. The original sizes are 26×3 and 56×16 pixels) {. '}
_f
"7
'}(
){. '}%%%( )%%%%%%{. '}%%%%%%%%%( )%%%%%%%%%%%%{. "ccccccccccccccc
_? _ e. _ "? _ e. _ "? "ccccccca
We have chosen a 6-dot Braille code for EFB as we wanted it to be as portable as possible. The files should look the same no matter which language, operating system, screen reader or Braille device is used. However, during our tests we have recognized that it would be nice if the full size of a single-lined device could be used. So we will evaluate in future if an 8-dot code can be used without too much configuration effort. For example by attaching Braille tables to our tool or the file extension ―.efb‖. When working with pixel-based graphics presentation on Braille devices, two aspects have to be taken in mind. The first arises from the low resolution and size of Braille displays compared to a computer screen. If one would simply take an ordinary graphic and convert it to EFB, much scrolling would be necessary to grasp the whole graphic. But if one uses to small graphics they may be misunderstood. For example a very small circle has the same shape as an octagon. The other aspect is that there is some space between the dots. They are not aligned as close to each other as pixels. So there is some more effort necessary to put the dots together than doing with pixels even if the pixels are enlarged like in Table 2. Additionally, on single-lined devices the dots are horizontally not equidistant but there is some additional space after each
4
Christiane Taras and Thomas Ertl
two dots. So there the graphic is also a bit stretched and lines are a bit bent. Of course, we gave special attention to these aspects during our user tests. And from this we can state that it is better to have a bit larger graphics where some scrolling is necessary than trying to make everything as small as possible. For example, for talking about triangles the larger graphic from Table 2 is preferable over the small on, although the small fits on the single-lined display at once. Furthermore, our user tests showed that the users overcome quite quickly the spacing problem. But of course, the problem of not being able to connect the dots does not occur that often on the graphics display as on the single-lined display. We also recognized that users performed better on the single-lined display if they had already worked with a graphics display.
4
Color Coding – Detailed FigureBraille (DFB)
After having successfully worked with EFB we thought about how we could enable the blind to also create colored graphics. The color of a bitmap’s pixel had to be coded in a way that is suitable for viewing and editing and also for the different Braille devices. The color code should be compact. So we decided to use a 6-dot code where each 6-dot Braille sign represents a single pixel. As the code should also be easy to understand and to memorize, we based it on the color mixing known from primary school. This is much more common to most people than the RGB mixing. The primary colors, red, blue and yellow, are coded in one dot each. Mixed colors, violet, green, orange and brown, are coded as combinations of the primary color’s dots. Furthermore, white is coded with no dots, black with all dots and gray as the middle with dots 1, 2 and 3. In our opinion these colors are sufficient for educational graphics. But to make the code also useful for more attractive images we have added light and dark shades by adding special dots to the code of the normal color. To make the code usable on the graphics display, we added one dot for orientation. This is dot 1 which is set in every color code. Without this dot one could for example not distinguish between red, yellow and blue. On ordinary Braille displays the orientation is given by the modules. But, of course, we also use the orientation dot there to have the same touch impression as on the graphics display. Table 3 provides an overview of the color code that we have named ―Detailed FigureBraille‖ (DFB). For the conversion of the dot patterns into signs we use the same table as for the EFB coding. Table 4 shows the DFB coding of the upper image in Table 2 Table 3. Overview of the Braille Color Code – Detailed FigureBraille (DFB) Name white red yellow blue
Dots none 14 15 16
Name orange violet green brown
Dots 145 146 156 1456
Name light gray dark gray gray black
Dots 12 13 123 all
Name Dots light +2 ... dark +3 ...
Interaction with Colored Graphical Representations on Braille Devices
5
Table 4. DFB coding of the first sample image from Table 2 % %% %%%
c cc ccc
555 55 5
eee ee e
1 111 11111
For the visual representations of the colors we have defined color values that are clearly distinguishable and fit well to the DFB color names in a natural way so that talking about the colors is easy and does not reveal any misunderstandings. Furthermore, we tried to cover as much of the color space as possible and we have used colors that are likely to be used in graphics designed by sighted people. Of course, our tool can also load graphics with other colors. If so these colors are mapped to the nearest DFB color in the L*a*b* color space [5] according to Euclidean distance. The colors were chosen through a multistep procedure. Firstly, we have chosen values for the normal DFB colors out of the HSV color space [7]. Then, we have lightened and darkened them by decreasing saturation or decreasing value, respecttively. Finally, we tried to map the colors to known web colors [14]. This facilitates using them in different environments and talking about them. Table 5 shows the result of this process. Unfortunately, we could not find web colors for all DFB colors. Table 5. Visual DFB colors (with web color name or Hex code and HSV values in °, % and %) Light LightCoral 0,47,94 #ffff7f 60,50,100 LightSkyB. 203,46,98 Gold 51,100,100 #bf7fff 270,50,100 PaleGreen 120,39,98 Tan 34,33,82 LightGrey 0,0,83
Normal Red 0,100,100 Yellow 60,100,100 Blue 240,100,100 Orange 39,100,100 BlueViol. 271,81,89 LimeGreen 120,76,80 SaddleBr. 25,86,55 Gray 0,0,50
Dark Maroon 0,100,50 DarkKhaki 56,43,74 Navy 240,100,50 Ora.Red 16,100,100 #200040 270,100,25 DarkG. 120,100, 39 #3f1a00 25,100, 25 #3f3f3f 0,0,25
The selection of the HSV values was as follows. For the hues we have started with 0°, 30°, 60°, and 120° for red, orange, yellow, and green. For brown we have used 25° as it is less greenish than orange. For violet we used 270° as it should not look pink. For blue we started with 210° to clearly separate it from violet. Nevertheless, during the mapping step we observed that for normal and dark blue hue 240° is working well. For saturation and value we started with 100% both. Only green and brown were darkened right from the start as brown itself is a rather dark color and full RGB green looks neon like on screens. There we used value 50% and 75%, respectively. Darkening and lightning was done by adjusting saturation and value with respect to the perceived luminance. Special cases there were yellow and orange. A simply darkened yellow looks rather greenish, so it was mixed with brown (just as in real life). Orange was darkened with red and lightened with yellow. So it clearly differs from brown. Unfortunately, using pink is not possible in our color code. If a graphic is converted to DFB pink will be mapped to red or violet which are both quite different
6
Christiane Taras and Thomas Ertl
from pink. We have not found that pink is that often used in graphics, but we will further evaluate if the absence of pink is a problem. Also cyan is not included in our color code. But this can be neglected. Cyan values will be mapped to light blue or light green which are mostly the names people use to describe cyan. First user studies showed us that our color code is quite useful and really easy to memorize. We have also successfully used it to present colored games like ―Same Game‖ (also known as ―Bubble Breaker‖) on the tactile graphics display.
5
Text in Graphics – Object FigureBraille (OFB)
EFB and DFB were originally designed without special considerations for textual content in the graphic. If text should be included in a readable way, which means presenting Braille, two problems occur. The first originates from using the different Braille devices. Because of the equidistant pins on tactile graphics displays the Braille characters should be separated by one row of dots (pixels) right of each character and one line below to be readable on that device. However, on the single-lined display there should not be any additional space between the characters. The second problem is caused in using a 6-dot code for EFB. Through that, 8-dot texts have to be written by using two EFB signs for each character. When not using 8-dot Braille, the problem of split characters also occurs if the text is not aligned in an EFB line. Because of these problems, we decided that textual parts have to be stored in objects separated from the graphical parts. Therefore, we have defined ―Object FigureBraille‖ (OFB) which is an XML format simply containing layers for text and graphic with their positions. Both, text and graphics are saved in plain text in the ―.ofb‖ file. Graphics are saved as DFB. So the file is also readable and editable for a blind user without any special tool. Of course, without our tool a one cannot grasp the whole (combined) graphic directly. With OFB text can easily be integrated in DFB and the layers can be named and easily be reused in other graphics. Furthermore, using text objects reveals the possibility for searching for texts or showing it in normal font for sighted. As our ideas on OFB began sounding more and more like reinventing the SVG DOM [14], we decided to stop working on improving OFB as a stand-alone format but rather trying to extend SVG with an own namespace including OFB attributes in future. Another aspect to text in graphics that we investigated was: ―How to find the text?‖. As on Braille displays the dots for graphic and text are indistinguishable we thought that text would have to be marked to be recognized as text. However, our user tests showed that this is not necessary. Just like with the color codes all users recognized text elements without any hints.
6
Combining Views and Exploring Graphics
To fully grasp a colored graphic it is very helpful if one can utilize exploration techniques. Besides zooming and scrolling, one main technique is filtering the graphic by color. Therefore we also make use of our color code. The user can activate a color
Interaction with Colored Graphical Representations on Braille Devices
7
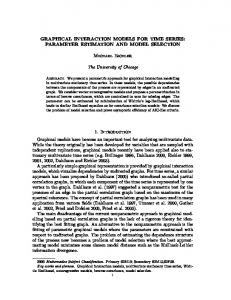
filter dialog in which the colors that are currently presented are shown with their codes as a text line. The user can now change the color filter by simply adding or removing color code signs. Furthermore, a contour filter can be applied which detects edges and presents only those. Fig. 1 shows some examples.
Fig. 1. Simple views of a traffic sign (top to bottom, left to right: original image of only 17×17 pixels, enlarged version of the original image, contour view on the tactile display, color filter view showing only red, color filter view showing only blue, DFB view)
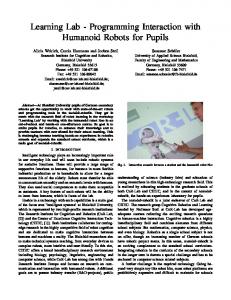
Fig. 1 also shows a problem with DFB: it stretches the graphic non-proportionally. Not only that each pixel is represented as 2×3 pins but further on the graphics display it is necessary to add space between the color code signs to separate them to get a clear presentation. So utilizing only DFB to understand a graphic is not possible. It has to be combined with a structural view of the graphic. One way to do this is providing views like shown in Fig. 1. But as we thought that permanently color filtering could be quite confusing we have also designed views like shown in Fig. 2. There the graphic is presented by its contours filled with a number of color codes and also combined with an even-odd filling algorithm. Our user test showed that these views are accepted by the user quite well as the user gets a lot of information about the graphic quickly without any extra activities like filtering or so. Even when we did not tell the user about what this view shows it was quickly recognized that there are color codes inside. The users preferred the views with lesser color codes. A similar technique could also be used for indicating the colors of lines in a line drawing. But we have not tested this yet. Of course, such views are not suitable for showing or creating single differently colored pixels. Therefore, one still needs DFB. If the user works with an object-based graphical representation (like an OFB or a vector graphic) it is also possible to filter by objects or by object types like text elements. Of course, also meta-information about the objects like name, description and object type can be presented if they are included in the graphic. Furthermore, such graphics can be built up incrementally as described in [6]. In contrast to [6] we do not propose to always build up the graphic from left to right and top to bottom. For
8
Christiane Taras and Thomas Ertl
instance in this approach for a diagram like the one in Fig. 3 the blue box at the left border would be shown first which is not very useful. Such a diagram should rather be built from top to bottom and left to right, which means that in the example the blue box at the top is presented first. Of course, it is hard to decide automatically in which sequence a graphic’s elements should be shown. Because of that we have decided to present the elements in the order of their appearance in the graphic’s source code. If object-based graphics are created thoughtfully the elements’ order is mostly quite useful. Further, ordering hints can be provided in such a graphic just like the tab order in GUI definitions. Our user test showed that telling where to start with the exploration is very helpful, especially on a single-lined display. If the user knows that a graphic is oriented to the bottom left or the center point, he or she can directly scroll there. Else the exploration will always start at the top right. Unfortunately, such information cannot be provided in raster graphics formats, EFB or DFB, respectively.
Fig. 2. Combined views of a traffic sign with 60×60 pixels on the tactile display, showing only the lifted pins (left to right: contour view with as much color code signs as possible, contour view with only a few color code signs, view with even-odd-filling and a few color code signs)
All the exploration techniques have in common that there is a risk of getting lost in the exploration. For example when one has zoomed into a graphic and scrolled over it, it sometimes gets hard to go back to the point where one last saw something interesting. To solve this problem programs for sighted people often utilize a mini map. But this is not usable on Braille devices. So we have introduced a kind of bookmarking technique with which the user can save views or hotspots. If the whole view is saved all parameters of the different exploration techniques are recorded. So that the exact same view with its zooming level and the filter configurations can be recreated. Saving a hotspot means that only a special position is remembered e.g. an intersection point of two graphs. The user can navigate to a hotspot in every view while the configuration of the view is not changed (except of the current position). The saved views and hotspots can be named by the user and so selecting from a list. A further technique that we will investigate in future is searching for interesting parts of the graphic like a special color, a pixel pattern or important objects. Therefore one needs an appropriate means of specifying the parameters and also to present the results in a useful way. Furthermore, we will investigate ―folding‖ of graphics, which means that the user can specify several lines or columns of the graphic that should be hidden. By that, for example, one can show a diagram’s axes next to a point of interest also in a zoom level that is suitable for figuring out the point’s coordinates.
Interaction with Colored Graphical Representations on Braille Devices
7
9
Sharing Graphics with other People
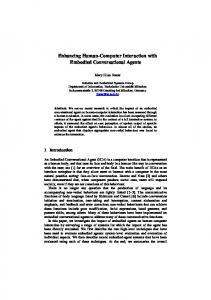
A main interest of our research is the cooperation between blind and sighted people. This includes that blind people can provide their own graphics to sighted people e. g. via web pages like Wikipedia or e-learning portals easily. With our tools EFB and DFB can be converted into bitmaps and vice versa. Two representations are provided. One is called ―pixel view‖ and follows the original idea which means that it contains one pixel for each DFB sign (six pixels for each EFB sign). The other is called ―swell paper view‖ and produces a circle for each pixel just as shown in Fig. 1 and 2. This is to provide sighted people with a larger version of the graphic. This was important in HyperBraille to give sighted people an impression of how large the graphic is for the blind people. We also use it in our tool supporting cooperation between blind and sighted as editable view for the sighted (see Fig. 3).
Fig. 3. Left: Screenshot of one of our tools showing the editing view for sighted at the top and the EFB and DFB views for the blind at the bottom, right: Example of a simple SVG (the traffic sign graphic of 60×60 pixels is included by an image tag with a size of 600×600 pixels)
The best way to provide small graphics to sighted people is using a format that supports zooming. So we have evaluated different methods to save small graphics as SVG [14]. The simplest way is using the ―image‖ tag and specifying the attributes ―width‖ and ―height‖ so that the graphic is enlarged to a size in which it is easily recognizable by sighted people. Fig. 3 shows an example of such an SVG opened in a web browser. The presentation is not beautiful but useful. Better looking SVGs can be generated with a raster to vector converter. First tests showed that the best results are achieved when filtering the graphic to just show one color, converting this to an SVG group and then combining the groups to one SVG. This has still to be implemented in our tool. Of course, both methods do not result in accessible SVGs. This is only possible when creating an object-based and annotated graphic right from the start.
8
Conclusion and Future Work
Our research showed us, that several blind people are curious about colored graphics and that the color information can also be useful for them. All subjects have learned the color code very quickly and had fun in playing colored games and creating their
10
Christiane Taras and Thomas Ertl
own colored graphics. Although most of them reported, that they have no impression what a color really is, as most of them had never seen colors, all were somehow proud to be able to work with and produce graphics that look nice to sighted people. Currently, our tool consists of a set of prototypes covering different aspects. In future, we will work on integrating all our results into one single tool, which will then be available from our web site. We will also perform more user studies to evaluate our exploration strategies. Furthermore, we will evaluate the applicability of an 8-dot EFB code and we will examine how useful it is to fully integrate Object FigureBraille with SVG, so that our tool fully supports the creation of accessible graphics.
9
Acknowledgements
We thank the participants of our user study, especially Lydia Simon, Simone Müller, and Gerhard Jaworek for taking the time to tell us about their experiences with graphics and the hints on our research. We also thank our project partners, especially Wiebke Köhlmann, Oliver Nadig, Denise Prescher, Maria Schiewe, and Gerhard and Ursula Weber, for supporting our work with the extensive use of our tools. This research has been carried out in the context of the HyperBraille project which is financed by the German Federal Ministry of Economics and Technology (BMWi).
References 1. Barker, S.: The Barker Code of Color/Fabric Representation, http://www.tactilecolor.com/ 2. Fujiyoshi, M. et al.: The Development of a Universal Design Tactile Graphics Production System BPLOT2. In ICCHP 2008, pp. 938--945, Springer (2008) 3. Gunzenhäuser, R., Weber, G.: Graphical User Interfaces for Blind People. In Proceedings of the 13th World Computer Congress, S. 450--457 (1994) 4. HyperBraille: http://www.hyperbraille.de/ 5. McLaren, K.: The development of the CIE 1976 (L*a*b*) uniform colour space and colourdifference formula, Journal of the Society of Dyers and Colourists 92, S. 338—341 (1976) 6. Rotard, M., Ertl, T.: Tactile Access to Scalable Vector Graphics for People with Visual Impairment. SVG Open Conference (2004) 7. Smith, A. R: Color gamut transform pairs. In Proceedings of SIGGRAPH '78. pp. 12--19 ACM, New York (1978) 8. Tactile Colour Communication Society, http://www.tactile.org/ 9. Tactile Vision Inc.: Tactile Vision Color Code System, http://www.tactilevisioninc.com/ 10.ViewPlus: Braille Embossers (Braille Printers) by ViewPlus, http://www.viewplus.com/ 11.Völkel, T.,Weber, G., Baumann, U.: Tactile Graphics Revised: The Novel BrailleDis 9000 Pin-Matrix Device with Multitouch Input. In: ICCHP 2008, pp. 835--842, Springer (2008) 12.Wikipedia: ASCII Art, http://en.wikipedia.org/wiki/ASCII_art 13.Wikipedia: Web Colors, http://en.wikipedia.org/wiki/Web_colors 14.World Wide Web Consortium (W3C): Scalable Vector Graphics (SVG) – XML Graphics for the Web, http://www.w3.org/Graphics/SVG/