Internet Background Radiation Revisited Eric Wustrow
Manish Karir
Michael Bailey
Networking Research and Development Merit Network Inc. Ann Arbor, MI 48104 USA
Networking Research and Development Merit Network Inc. Ann Arbor, MI 48104 USA
Department of EECS University of Michigan Ann Arbor, MI 48109 USA
[email protected]
[email protected]
[email protected]
Farnam Jahanian
Geoff Huston
Department of EECS University of Michigan Ann Arbor, MI 48109 USA
Asia Pacific Network Information Centre Brisbane QLD 4064 Australia
[email protected]
[email protected]
ABSTRACT
Categories and Subject Descriptors
The monitoring of packets destined for routeable, yet unused, Internet addresses has proved to be a useful technique for measuring a variety of specific Internet phenomenon (e.g., worms, DDoS). In 2004, Pang et al. stepped beyond these targeted uses and provided one of the first generic characterizations of this non-productive traffic, demonstrating both its significant size and diversity. However, the six years that followed this study have seen tremendous changes in both the types of malicious activity on the Internet and the quantity and quality of unused address space. In this paper, we revisit the state of Internet ”background radiation” through the lens of two unique data-sets: a five-year collection from a single unused /8 network block, and week-long collections from three recently allocated /8 network blocks. Through the longitudinal study of the long-lived block, comparisons between blocks, and extensive case studies of traffic in these blocks, we characterize the current state of background radiation specifically highlighting those features that remain invariant from previous measurements and those which exhibit significant differences. Of particular interest in this work is the exploration of address space pollution, in which significant non uniform behavior is observed. However, unlike previous observations of differences between unused blocks, we show that increasingly these differences are the result of environmental factors (e.g., misconfiguration, location), rather than algorithmic factors. Where feasible, we offer suggestions for clean up of these polluted blocks and identify those blocks whose allocations should be withheld.
C.2 [Information Systems Applications]: Network Operations
General Terms Measurement
Keywords Darknet, Internet background traffic, Network pollution
1.
INTRODUCTION
The monitoring of allocated, globally routeable, but unused Internet address blocks has been widely used by the security, operations, and research communities to study a wide range of interesting Internet phenomenon. As there are no active hosts in these unused blocks, packets destined to these IP addresses must be the result of worm propagation[1, 2, 3], DDoS attacks[4], misconfiguration, or other unsolicited activity. Systems that monitor unused address spaces have a variety of names, including darknets [5], network telescopes [6], blackhole monitors [7], network sinks[8], and network motion sensors [9]. While this monitoring technique had seen heavy use in the measurement of specific phenomena, it wasn’t until 2004 when Pang et. al [10] published their seminal paper “Characteristics of Internet Background Radiation” that a detailed characterization of this incessant non-productive traffic was available. Through passive measurement and active elicitation of connection payloads over several large unused blocks, the authors characterized the behavior of sources and the activities prevalent in Internet background radiation. Most notable in their analysis was the ubiquity of Internet background radiation, its scale, its rich variegation in targeted services, and the extreme dynamism in many aspects of the observed traffic. The six years since this landmark paper have seen significant changes both in the size, shape, and traffic carried by the Internet as well as the methods and motivations of malicious traffic that makes up Internet background radiation. While both scanning as a reconnaissance activity and
Permission to make digital or hard copies of all or part of this work for personal or classroom use is granted without fee provided that copies are not made or distributed for profit or commercial advantage and that copies bear this notice and the full citation on the first page. To copy otherwise, to republish, to post on servers or to redistribute to lists, requires prior specific permission and/or a fee. IMC’10, November 1–3, 2010, Melbourne, Australia. Copyright 2010 ACM 978-1-4503-0057-5/10/11 ...$10.00.
62
as a propagation method are both alive and well, the emergence and growth of botnets [11, 12] have changed the threat landscape significantly for most operators. This view of compromised hosts as a resource worth protecting highlights a tension in botnet design between the degree of detection as evidenced by how noisy malicious behaviors are, and the desire to maintain the useful resource and avoid detection. As with any design tradeoff, there are malicious botnets that continue to be noisy in how they use and acquire hosts (e.g., Conficker), nevertheless, the last six years has seen a marked change in how malicious code behaves [13]. Additionally, today’s Internet continues to witness tremendous year over year growth, fueled in large part by demand for video [14]. The role of new content delivery mechanisms have changed how traffic flows and user demands continue to change the applications of interest. These changes impact the behaviors observed in background radiation as new services become more desirable to discover and new network services offer new ways to misconfigure themselves. Our study is primarily motivated by the dramatic shifts in attack behaviors and the Internet as as whole since the original 2004 Internet background radiation study [10], Additionally, as IPv4 address exhaustion nears [15] and dirty network blocks can no longer be returned for newer allocations, there is an increasing need to both identify and quantify address pollution to determine the quality of a network address block and to determine the utility of any cleanup effort. The purpose of this paper is to revisit Internet background radiation in order to determine any evolution in the nature of this traffic and to explore any new features that might have emerged. To provide as broad and detailed a characterization as possible, we draw on two unique sources of data for our analysis. First, we examine five week-long datasets taken from the same routed /8 unused address block, representing the first week in February over the last five years. Second, we examine three week-long datasets built by announcing and capturing traffic to three separate /8 networks recently allocated to APNIC and ARIN from IANA. These three datasets are compared with each other, as well as with three matching week-long collections from the /8 used in the longitudinal study. To summarize, the value of our work is threefold:
of significant volumes of non-uniform environmental factors—a class of behaviors we collectively label as address space pollution. • Availability of these Traces. We will make all 11 datasets, nearly 10 TB of compressed PCAP data, available through the Protected Repository for the Defense of Infrastructure Against Cyber Threats (PREDICT) [16] dataset archive in an effort to further expand our knowledge of these interesting phenomena and encourage additional exploration. The rest of this paper is organized as follows; in Section 2 we describe some directly related work; Section 3 provides an overview of our data collection methodology and describes our datasets; Section 4 we revisit Internet background radiation, providing both temporal and spatial studies of this traffic; Section 5 outlines our study of address pollution; Section 6 summarizes our results and offers some conclusions and future work.
2.
RELATED WORK
Directly related work in this area can generally be categorized into two related areas. The first area is concerned with the design, operation and scalability of monitoring Internet background radiation, while the second focuses on the analysis of the data collected via these systems. There have been several attempts at building Internet background radiation monitoring systems; here we describe the three most popular systems. In [6] the authors discuss perhaps the most popular and visible monitor at CAIDA. They describe how the size of the monitored address space can influence its ability to detect events. They also present several alternative models for building distributed network monitors. Data from this monitor has been made available to the broad network research community which has served to increase its visibility. The iSink monitor at the University of Wisconsin was first published in [8], where the authors describe their experience in building this system as well as using it for both active and passive monitoring for detection of possible network abuse activity. One of the chief characteristics of the system was its ability to filter the traffic as well as incorporate application level responders. The Internet Motion Sensor (IMS) system at the University of Michigan has been described in [9]. The IMS system was perhaps the most distributed and extensive system of the three we have described here. A main finding of this work was the value in a distributed monitoring system, as different blocks in different networks reported significantly different behaviors. The spatial analysis in our study re-confirms these differences, both in space and time, but highlights a growing trend toward pollution as the cause of these differences. A wide variety of work based on improving these techniques and systems has followed. A non-exhaustive list of examples includes: practical techniques for deploying these sensors [5], how to build scalable filters in distributed darknets [17], where to place distributed sensors [7], how to configure services in these sensors [18], the security and anonymity of these sensor blocks [19], and the effectiveness of distributed sensors in various domains such as worm detection [20]. One relevant body of work is that of Cooke et. al [21] in which we examined observed non uniformity across monitors and showed that this non uniformity was the result of algorithmic factors in worm propagation and
• Revisiting Internet Background Radiation In this paper we present the first thorough study of Internet background radiation since 2004. We study and characterize this traffic in an attempt to answer two specific questions: – Temporal Analysis of Internet Background Radiation The first question is an attempt to understand how this traffic has evolved over a 5 year time-period. – Spatial Analysis of Internet Background Radiation The second question attempts to answer the question of how this traffic might vary based on the specific darknet address block under observation. • A study of Internet Address Pollution Our spatial analysis of background radiation shows significant differences between large blocks of unused address space. We argue these differences are distinct from previously reported diversity measurements as they are the result
63
Data Set A-1: 1/8 A-2: 35/8 B-1: 50/8 B-2: 35/8 C-1: 107/8 C-2: 35/8
Start Date 2/23/2010 2/23/2010 3/12/2010 3/12/2010 3/25/2010 3/25/2010
End Date 3/1/2010 3/1/2010 3/19/2010 3/19/2010 3/31/2010 3/31/2010
Size (gz’d) 4134 GB 739 GB 1067 GB 770 GB 1230 GB 770 GB
Data Set D-1: 35/8 D-2: 35/8 D-3: 35/8 D-4: 35/8 D-5: 35/8
Start Date 2/13/2006 2/5/2007 2/4/2008 2/2/2009 2/8/2010
End Date 2/19/2006 2/11/2007 2/10/2008 2/8/2009 2/14/2010
Size (gz’d) 113 GB 95 GB 119 GB 386 GB 630 GB
Table 2: Datasets used in Darknet Traffic Evolution Analysis
Table 1: Datasets used in Darknet Traffic Spatial Analysis
In this section we describe the datasets used in our experiments as well as our long term collection methodology for the study of Internet address space pollution.
collection on the unused portion of the 35.0.0.0/8 network block for the same time period. The 35.0.0.0/8 network block is unused except for a /13 block of addresses that is routed internally at Merit for its customers (96.8% unused). For each dataset we performed a full packet capture using a customized packet capture utility based on libpcap. Table 1 lists these datasets. Though we actively worked with our upstream provider AT&T to ensure that our BGP route announcements would be propagated into the Internet core, it is possible that local or regional policies and configuration differences could have impacted the global visibility of our darknet route announcements. This in turn would have an impact on what data is actually routed to our data collectors. Using publicly available BGP routing data from routeviews.org [24] and RIPE [25] we were able to confirm that our BGP route announcement for 1.0.0.0/8 was visible to 31 out of 41 active routeviews peers and 9 out of 16 active RIPE peers. The 50.0.0.0/8 route announcement was visible to 31 out of 41 routeviews peers and 9 out of 14 RIPE peers. The 107.0.0.0/8 BGP route announcement was visible to 28 out of 41 routeviews peers and 10 out of 16 RIPE peers. Though we cannot claim to have collected all the network pollution directed at these network blocks we believe our data is fairly representative of the overall trends and data patterns. The second set of five datasets were used for the temporal analysis section of this paper and were extracted from our ongoing continuous data collection of packets directed towards the unused portions of 35/8 network block. We extracted week-long datasets for the first week of February for each year since 2006. Table 2 lists these datasets. We used 3 additional days of data for each of the 5 years to verify that the volume of traffic and pollution type distribution was relatively stable throughout the year. From this, we find that our week-long datasets are representative of their respective years. A total of 11 datasets were created representing roughly 10TB of compressed packet captures.
3.1
3.2
environmental factors such as misconfiguration. While our study shows that both of these factors continue to play a role, the increase in importance of environmental factors is a striking addition of our study. The systems described above have led to multiple studies regarding the nature and characteristics of traffic observed in these darknets. Darknet traffic has been used for specific analysis of malicious activity such as: propagation [22, 1, 2, 3], DDoS attacks [4], misconfiguration, or other unsolicited activity [23]. The most relevant work to this paper, of course, is [10] in which the authors present an extremely detailed analysis of Internet background radiation as observed in 2004 at four unused IPv4 network blocks. They performed both active and passive characterization of the background traffic and concluded that there is significant diversity in this traffic both in terms of the address blocks monitored as well as over time. There are three main distinctions between this work and the collection methodology in this paper in addition to the freshness of the data being examined. First, due to the availability of a large computation and storage infrastructure, we do not need to filter or sample the traffic being analyzed in any way (both were done in the previous work). In spite of the large increases in volume over time, we find fairly robust processing scripts able to process weeks of data on the order of hours. Second, due to the transient nature and sensitive nature of the blocks being studied (see Section 3) we do not utilize any active responders to solicit traffic to the block. As a result, we are unable to differentiate traffic based on payload, except in the cases of UDP. Finally, we make use of substantially larger amounts of space and over longer scales than the previous study.
3.
METHODOLOGY
Data Collection
Internet Pollution and Data Archiving
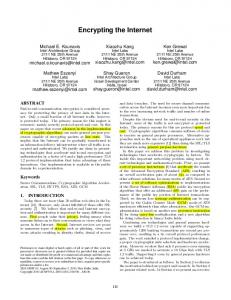
This data collection is a part of an ongoing research activity in which we are working with IP address registries such as ARIN and APNIC in order to collect and archive samples from newly allocated network blocks for the broad Internet research community. These datasets will then be published via PREDICT [16] dataset archive. Any research activity which interacts with critical Internet infrastructure must carefully balance the need for informing relevant parties as well as ensuring that such a process does not result in a dirty dataset. For each new allocation we obtain a clear Letter of Authorization (LOA) from the RIR whose network block we wish to monitor. This LOA outlines the research activity and the duration for which we are authorized
For our analysis we used two datasets. The first set of six distinct sub-datasets we used for studying the spatial properties of darknet traffic, and the second set of five distinct sub-datasets was used for studying the temporal properties of darknet traffic. The six spatial sub-datasets were constructed by obtaining permission from ARIN and APNIC to announce previously unallocated /8 network blocks to the Internet via BGP. This resulted in all darknet data destined for these networks to be routed to our data collection infrastructure at Merit. Each of the 1.0.0.0/8, 50.0.0.0/8 and 107.0.0.0/8 networks were announced over a period of one week. The resulting three datasets were then paired with data from our ongoing data
64
Protocol TCP(%pkts) UDP(%pkts) ICMP(%pkts) other(%pkts) TCP(%bytes) UDP(%bytes) ICMP(%bytes) other(%bytes)
ARIN
Internet
APNIC ATT LOA
BGP
RIRs Darknet Data
Dataset 1/8 (A1) 35/8 (A2) 50/8 (B1) 35/8 (B2) 107/8(C1) 35/8 (C2) 2006 (D1) 2007 (D2) 2008 (D3) 2009 (D4) 2010 (D5)
Dataset Archive
Merit/University of Michigan
Figure 1: Cooperative Internet background radiation data collection
2008 45.8 49.9 3.8 0.5 16.3 81.6 1.8 0.3
2009 87.8 11.4 0.6 0.2 82.5 16.6 0.7 0.2
2010 87.2 12.3 0.4 0.1 82.2 17.2 0.4 0.2
Scanning 12.5 B 15.5 B 17.7 B 15.2 B 18.9 B 14.8 B 1.7 B 1.8 B 1.1 B 9.5 B 15.5 B
Backscatter 1.7 B 1.6 B 2.4 B 2.5 B 2.2 B 2.2 B 1.0 B 0.8 B 0.4 B 1.4 B 1.6 B
Misconfiguration 55.9 B 5.2 B 10.2 B 5.6 B 14.8 B 6.0 B 0.8 B 0.5 B 1.8 B 1.5 B 5.2 B
Table 4: Billions of packets received per week for each pollution type in Upper: 1/8 (A1), 50/8 (B1), 107/8 (C1) and 35/8 (A2,B2,C2); Lower: 35/8 20062010 (D1-D5).
to announce this network block. This is then presented to our primary upstream provider, AT&T, which then removes any filters that would prevent our BGP announcement from propagating to the Internet. We also take care to publish information regarding our proposed announcement in the RADB [26] in the case the network operator community has some concerns regarding our BGP announcements. We do not actively announce our experiments on the network operator mailing lists as it might result in tampering with our data collection; though we are prompt to answer any specific queries that might arise as a result of our experiment. Figure 1 summarizes this process.
4.
2007 85.7 6.8 5.0 2.5 75.6 13.4 8.3 2.7
Table 3: Traffic Distribution by protocol over time in terms of total packets as well as bytes, for 35/8 2006-2010 (D1-D5).
LOA
Data Collector
2006 76.5 19.1 4.2 0.2 22.5 75.3 2.1 0.1
we investigate background radiation in the context of its temporal and spacial properties.
4.1
Temporal Analysis of Internet Background Radiation
Figure 2 shows the overall traffic rate observed at the 35/8 darknet during the first week of February for each year starting from 2006. There is an almost 4 fold increase in the observed traffic volume to the address space over this 5 year observation window. While the observed traffic rate in 2006 is less than 5Mbps it does have a significant number of extremely large spikes which can reach as high as 60Mbps. These spikes are largely the result of traffic on UDP port 1026, which represents Windows Messenger popup spam campaigns and are consistent with similar increases in activity seen in the second half of 2005 and the first half of 2006 (e.g., http://www.dshield.org/). 2007 demonstrates only a modest increase over 2006, but this traffic rate increases steadily to almost 20 Mbps by Feb 2010. This translates into roughly 100% growth over each of the last four years. It is interesting to note that this rate of growth is nearly twice that of productive Internet traffic which is currently exhibiting 50% year over year growth rates [14]. Table 3 shows the relative composition of the darknet traffic over time in terms of packets and bytes. The percentage of UDP traffic increases dramatically in 2008 in terms of both packets and bytes. It is particularly interesting to note that there appears to be a significant outbreak of SQL Slammer worm scanning in 2008, initially evidenced by the spike in the volume of traffic observed on UDP port 1434. Recall that the SQL Slammer worm spread over the course of
REVISITING INTERNET BACKGROUND RADIATION
At a high level, Internet background radiation can be classified into three distinct types based on different root causes of these activities. Scanning is largely the result of infected hosts on the Internet attempting to find other vulnerable targets, backscatter is most often the result of Denial of Service attacks, and finally misconfiguration, which is a result of software or hardware errors. Table 4 shows the contribution of the these three main types of background radiation to each of 1/8, 50/8, 107/8 and 35/8. We classify TCP SYN packets as scanning traffic. We define backscatter traffic as TCP SYN+ACK, RST, RST+ACK, and ACK packets, as these packets are likely to be generated by hosts attempting to respond to communication from a forged source in the darknet. Finally, we classify the remaining traffic as misconfiguration. When comparing /8s to the baseline 35/8 captured during the same time interval, we observe that backscatter traffic volumes (in billions of packets per week) are nearly identical. Likewise, scanning is of similar magnitudes, despite slightly increased volumes in 50/8 and 107/8. Misconfiguration traffic contains the most variance between /8s, due to its directed nature. In the following subsections,
65
Volume of Traffic to 35.0.0.0/8 256 2010
128
2009 2008
Mbit/s
64
2007 2006
32 16 8 4 2 1 0
1
2
3
4
5
6
7
Time (day) Figure 2: Temporal analysis of Internet Background Radiation. 2006-2010 using datasets D-1, D-2, D-3, D-4, D-5. TCP Port 445 139 4662 80 135
2006 23.1 12.9 2.6 6.9
2007 8.8 4.2 17.1 3.4
2008 7.2 3.5 8.3 12.9
2009 70.8 0.9 0.6 1.3
2010 83.1 0.6 0.2 -
Overall measured traffic is shown from
TCP Flags syn syn+ack rst+ack rst ack
2006 62.7 26.1 8.5 2.3 0.1
2007 66.7 28.9 3.3 0.8 -
2008 74.2 21.2 3.0 1.4 -
2009 87.5 8.6 2.9 0.4 0.3
2010 93.9 5.2 0.3 0.3 0.1
Table 5: Most popular TCP destination ports over time in terms of percentage of total TCP packets, 2006-2010 (D1-D5).
Table 6: Most popular TCP flags over time in terms of percentage of total TCP packets, 2006-2010 (D1D5).
10 minutes in 2003, infecting thousands of hosts. We were able to manually verify that this spike was indeed Slammer exploits and not some other exploit by verifying the payload and comparing it with the well known SQL Slammer payload. Whether the re-emergence of the worm or other scanning efforts, its occurrence at scale five years after the initial outbreak is puzzling. It should be noted that when compared to the results reported in [10] the percentages of TCP traffic in terms of packets appears very similar. Table 5 shows the most popular TCP ports in terms of the total percentage of TCP traffic. When compared to the results reported in [10] in 2004 by the time of dataset D1 in 2006 we notice only a minor up-tick in port 445 activity and a general decrease in the fraction of the reported popular ports (i.e., 80, 135, 139) in the study. We do, however, witness the same dynamism as reported in that study, with ports such as 4662 shown in Table 5 appearing and disappearing in popularity. While most of these shifts are short lived and seemingly without explanation, several major events stand out. It is particularly interesting to note the dramatic increase in traffic on port 445 in 2009-2010. This is consistent with the emergence of the Conficker botnet in October 2008. Another interesting artifact visible in the data is the emergence of ssh scanning as a significant percentage of background radiation traffic starting in 2007. Scans on TCP port 23 also begin to emerge starting 2007
which indicates a significant up-tick in attempts to locate backdoors installed by various worms. Table 6 shows the most commonly used flags in TCP packets over time as a percentage of total number of packets. A very clear trend is visible from this data which is the steady increase in packets which have only the SYN flag set. From 2006 to 2010 the total percentage of TCP packets with SYN flag increases from 63% to almost 94% at the same time the percentage of packets with SYN-ACK flags set decreases dramatically from 26.1% in 2006 to 5.2% in 2010. It is unclear if this indicates an increase in scanning activity and a decline in DDoS activity. The emergence of Conficker also accounts for perhaps the most significant shift in the nature of Internet background radiation. Figure 3 shows the Cumulative Distribution Function (CDF) of all destinations for which traffic was received in the 35/8 darknet. The 2006 CDF is virtually a straight line, indicating no significant hot-spot activity in this traffic. However, starting in 2008 a knee starts to form in the CDF which indicates the emergence of hot-spot activity. Finally, in 2009 and 2010 we are able to observe a very pronounced kink in the CDF. This is congruent with a bug in Conficker’s pseudo-random propagation algorithm [27]. This bug causes it to fix bits 8 and 24 (most-significant bits of octets 2 and 4, respectively) as 0, resulting in Conficker propagation scans being limited to only 1/4 of the Internet address space. In all observed /8s
66
CDF of Destination /24s for 35.0.0.0/8
CDF of Source /24s for 35.0.0.0/8
1 1
0.9
0.8
0.7
0.7
0.6
CDF
CDF
2010 2009 2008 2007 2006
0.9
0.8
0.5 0.4
2010 2009 2008 2007 2006
0.3 0.2 0.1 0 0
20000
40000
0.6 0.5 0.4 0.3 0.2 0.1 0
60000
0
/24
1e+06
2e+06
/24
(a) The distribution of destination /24s targeted in the unused address block.
(b) The distribution of source /24s targeted in the unused address block.
Figure 3: Changes in source and destination behavior from 2006-2010 using datasets D-1, D-2, D-3, D-4, D-5.
TCP Port 21 25 80 443 445 143 1024 5022 6112
A1 - A2 40.3 1.7 8.7 1.6 -75.0 32.5 — 1.6 2.2
B1 - B2 — — — — -2.0 — — — —
been able to verify that there is no such setting at our upstream provider. The traffic volume by protocol is shown in Figure 5. The traffic volume in Figures 5 and 4 shows a sharp dip on day 7 of the A-1 dataset. This was caused by a temporary duplicate BGP announcement by APNIC. The first column of Figures 6 and 7 show the cumulative distribution function (CDF) of the cumulative contributions of traffic with destination and source in each /24 network. The 1/8 graphs show extremely high hotspot activity in both these figures as evidenced by the extremely sharp knee in these graphs. The second and third columns correspond with datasets B-1 and C-1 respectively. Both of these display moderate hotspot activity in the destination CDF but the source CDF graphs are virtually identical across A-2, B-1, B2, C-1, C-2. We describe some of this hotspot activity in detail in the next section. Datasets A-2, B-1, B-2, C-1, and C-2 all display remarkable similarity in the TCP destination port distributions. Table 7 summarizes the differences between these datasets. It shows ports whose contribution was different by more than 1% when compared to the A2, B2, and C2. The most interesting features that we discovered during our analysis of the UDP destination ports was some unusual activity on port 514 in dataset B-1, which is the port associated with syslog, as well as activity on port 15206, which represents SIP traffic in dataset A-1. Figure 8 shows the traffic volume contributed by these features and we discuss some of them in the following section. The source Operating System estimate obtained by observing the TTL values in the TCP packets shows that the relative volume of traffic generated from the various sources appears to be the same for 35/8, 50/8, and 107/8 (datasets A-2, B-1, B-2, C-1, C-2). Recall that the default TTL values for Windows, Linux and Solaris are 128, 64 and 255 respectively. Windows hosts tend to dominate the total traffic volume by various sources in all except the 1/8 darknet block, where Linux sources are responsible for a majority of the traffic. Analysis of the UDP TTL values displays similar distribution for all darknets except once again the 1/8 where we see Windows, Linux, Solaris and perhaps some embedded devices as possible contributors to the pollution. We were, for example, able to identify some pollution at this network
C1 - C2 — — — — -7.5 — -1.1 — —
Table 7: The most significant changes in the contribution of a TCP destination port when compared between blocks. Only those ports whose contribution to total traffic at a block that were different by more than %1 are shown.
after 2008, we observe roughly 3 times less traffic for destination IPs with a second or fourth octet of 128 or greater.
4.2
Spatial Analysis of Internet Background Radiation
Figures 4, 6, 8, 9, and 7 represent our analysis of datasets A-[1,2], B-[1,2], and C-[1,2]. The stacked graphs represent data collected from the 35/8 darknet (A2, B2, and C2) on the top row, while the bottom row of graphs represents data collected from 1/8(A1), 50/8(B1), and 107/8(C1). The overall traffic volume in bytes and packets is shown in Figure 4. One of the most dramatic features is the enormous volume of traffic in 1/8. The 1/8 network sees Internet Background Radiation rates as high as 150Mbps. As we discuss in the following section, most of this traffic is directed toward a small number of destinations in 1/8, due to misconfiguration in a wide range of Internet devices. Both 50/8 and 107/8 traffic rates show a significant diurnal pattern with almost similar data rates. The overall darknet traffic volume ranges from 20-40Mbps or 40-60Kps. One puzzling feature visible in these figures is the clipped nature of the 35/8 graphs. We believe this is caused by a rate limit on a device that is present in the path of our data collector. While we have been able to verify that such a limit is not present in oCDFown collection network, we have so far not
67
Volume of Traffic (A2) 35.0.0.0/8 KPkt/s Mbit/s
140
Mbps
(B2) 35.0.0.0/8
(C2) 35.0.0.0/8
KPkt/s Mbit/s
KPkt/s Mbit/s
140
120
120
100
100
80
80
60
60
40
40
20
20 0
0 0
1
2
3
4
5
6
7
0
1
2
(A1) 1.0.0.0/8
4
5
6
7
0
1
(B1) 50.0.0.0/8
KPkt/s Mbit/s
140
Mbps
3
2
3
4
5
6
7
(C1) 107.0.0.0/8
KPkt/s Mbit/s
KPkt/s Mbit/s
140
120
120
100
100
80
80
60
60
40
40
20
20 0
0 0
1
2
3
4
5
6
7
0
1
2
3
4
5
6
7
0
1
2
3
4
5
6
7
Time (days) Figure 4: Spatial analysis of Internet Background Radiation. Overall measured traffic (bytes and packets) is shown for datasets A-1, A-2, B-1, B-2, C-1, C-2 Traffic Volume Breakdown by Protocol (A2) 35.0.0.0/8
(B2) 35.0.0.0/8
(C2) 35.0.0.0/8
Thousand Packets/s
160
TCP UDP ICMP
140 120
TCP UDP ICMP
TCP UDP ICMP
100 80 60 40 20 0 0
1
2
3
4
5
6
7
0
1
(A1) 1.0.0.0/8
2
3
4
5
6
7
0
1
(B1) 50.0.0.0/8
2
3
4
5
6
7
6
7
(C1) 107.0.0.0/8
Thousand Packets/s
160
TCP UDP ICMP
140 120
TCP UDP ICMP
TCP UDP ICMP
100 80 60 40 20 0 0
1
2
3
4
5
6
7
0
1
2
3
4
5
6
7
0
1
2
3
4
5
Time (days) Figure 5: Spatial analysis of Internet Background Radiation. Overall measured traffic by protocols is shown for datasets A-1, A-2, B-1, B-2, C-1, C-2
68
CDF
Destination IP Address CDF 1 0.9 0.8 0.7 0.6 0.5 0.4 0.3 0.2 0.1 0 0
1 0.9
(A2) 35.0.0.0/8
(B2) 35.0.0.0/8
(C2) 35.0.0.0/8
packets bytes
packets bytes
packets bytes
20000
40000
60000
0
20000
40000
60000
0
20000
40000
(A1) 1.0.0.0/8
(B1) 50.0.0.0/8
(C1) 107.0.0.0/8
packets bytes
packets bytes
packets bytes
60000
CDF
0.8 0.7 0.6 0.5 0.4
0
20000
40000
60000
0
20000
40000
60000
0
20000
40000
60000
Destination /24s Figure 6: Spatial analysis of Internet Background Radiation. The CDF representing the cumulative contribution of individual /24 destination using datasets A-[1,2], B-[1,2], C-[1,2]. Source IP Address CDF (/24 networks) (A2) 35.0.0.0/8
(B2) 35.0.0.0/8
(C2) 35.0.0.0/8
1 0.9 0.8
packets bytes
packets bytes
packets bytes
CDF
0.7 0.6 0.5 0.4 0.3 0.2 0.1 0 1e+06
2e+06
(A1) 1.0.0.0/8
1e+06
2e+06
(B1) 50.0.0.0/8
1e+06
2e+06
(C1) 107.0.0.0/8
1 0.9 0.8
packets bytes
packets bytes
packets bytes
CDF
0.7 0.6 0.5 0.4 0.3 0.2 0.1 0 1e+06
2e+06
1e+06
2e+06
1e+06
2e+06
Source /24s Figure 7: Spatial analysis of Internet Background Radiation. The cumulative distribution function (CDF) representing cumulative contribution of individual /24 source network blocks for both total packets and bytes are shown using datasets A-[1,2], B-[1,2], C-[1,2]. Sorted with highest contributors on the left.
69
Top 20 UDP Destination Ports (A2) 35.0.0.0/8
(B2) 35.0.0.0/8
(C2) 35.0.0.0/8
Million Packets
10000
1000
100
10
1 65535 65280 62107 49153 48251 35384 30058 24227 22112 19987 17368 12323 7973 5400 4605 4254 4246 1434 137 53
65535 65280 50149 49153 41785 35384 24227 22112 17368 12323 5400 5060 4605 4254 4246 500 137 123 53 43
65287 55639 38403 35384 25936 24227 22112 17368 12323 11623 10988 8229 8002 5400 4254 4246 1863 1434 137 53
(A1) 1.0.0.0/8
(B1) 50.0.0.0/8
(C1) 107.0.0.0/8
Million Packets
10000
1000
100
10
1 65535 28092 27487 26156 24454 24227 22962 22112 17368 13856 4605 3700 2427 1284 1024 863 137 58 53 5
60898 48053 27486 25701 24227 18130 17368 14646 12902 12323 9348 8906 8238 5822 4605 4504 514 161 137 53
65535 61440 43690 33527 33493 33368 15207 15206 13178 6060 5060 5001 3072 1001 514 161 137 80 53 0
UDP destination port Figure 8: Spatial analysis of Internet Background Radiation. The top 20 UDP destination ports are shown using datasets A-[1,2], B-[1,2], C-[1,2].
Time-to-live values for UDP packets
Million Packets
(A2) 35.0.0.0/8
(B2) 35.0.0.0/8
(C2) 35.0.0.0/8
100
10
1
0.1 0
50
100
150
200
250
0
50
Million Packets
(A1) 1.0.0.0/8
100
150
200
250
0
(B1) 50.0.0.0/8
50
100
150
200
250
(C1) 107.0.0.0/8
100
10
1
0.1 0
50
100
150
200
250
0
50
100
150
200
250
0
50
100
150
200
250
TTL value Figure 9: Spatial analysis of Internet Background Radiation. The distribution of TTL values for UDP traffic is shown using datasets A-[1,2], B-[1,2], C-[1,2].
70
subnet (/24) 1.1.1.0 1.4.0.0 1.0.0.0 1.2.3.0 1.1.168.0 1.10.10.0 1.1.0.0 1.0.168.0 1.0.1.0 1.2.168.0 total
%pkts 44.0 16.7 10.6 2.0 0.6 0.3 0.2 0.2 0.1 0.1 74.8
%bytes 58.7 9.4 6.2 8.6 0.3 2.4 0.1 0.1 0.1 0.1 86.0
2-byte prefix 0x8000 0x8008 0x8004 0x8012 0x8080 0x8088 0x8003 0xa012
dport 33368 514 33527 3072 33493 721 17055 33437 570 58689
block due to a specific model of a DSL modem. Figure 9 shows this source OS distribution.
POLLUTION
In the previous section we discussed that many of the large scale differences observed between announced blocks and our reference unused block were clustered in a small portion of destination or source address space. We call this significant nonuniform behavior address space pollution. Unlike previous observations of differences between unused blocks [21] we show that increasingly these differences are the result of environmental factors (e.g., misconfiguration, location), rather than algorithmic factors. For example, in analyzing the significant difference between A-1 and A-2 we find that the top 10 /24 destinations receive 75% of the total packets. Table 8 shows the 10 /24 destination subnets that received the most packets in 1.0.0.0/8. These blocks observe significant non uniform traffic that is primarily the result of misconfiguration. Example classes of these misconfigurations include: network protocol vulnerabilities, misconfigured network servers, services, and devices, misconfigured attack tools, misconfigured peerto-peer network software, and various other software programming bugs. In the following sections we explore these interesting sources of pollution in more depth.
5.1
bytes(M) 3658152 901639 138671 51917 71540 1283 232 28
% pkts 71.0 17.5 7.4 2.5 1.3 0.0 0.0 0.0
%bytes 75.8 18.6 2.8 1.0 1.4 0.0 0.0 0.0
Table 9: Top 8 RTP Payloads
Table 8: Top 10 /24 destinations in 1.0.0.0/8
5.
packets(M) 17093 4213 1791 605 334 5 2 0.5
packets(M) 6511 2114 1582 803 588 50 18 7 4 3
bytes(M) 515323 165388 124775 63827 46752 3974 1418 517 303 232
%pkts 55.7 18.0 13.5 6.8 5.0 0.4 0.1 0.0 0.0 0.0
%bytes 55.8 17.9 13.5 6.9 5.0 0.4 0.1 0.0 0.0 0.0
Table 10: Top 10 destination ports for UDP traffic to 1.4.0.0
this case, the packets were created to have the stream sent to 1.1.1.1:15206. Since these RTP streams are done over connectionless UDP, no response from 1.1.1.1 was necessary for us to receive these RTP streams in our capture. We were able to isolate a handful of these streams, and using Wireshark, extract the unencrypted audio encoded in these streams. The audio file consists of a series of reorder tones (fast busy), followed by an automated voice stating: “The number you have dialed is not in service. Please check the number and try again.” Each RTP stream contributes about 40-50 packets per second (80kbit/s), with an average of more than 5000 streams sending to 1.1.1.1:15206 simultaneously at any time. Analysis of the TTL values for this traffic reveals 4 separate default TTL values that appear to be the original TTL for the packet. Due to the nature of TTL values decreasing at every hop on its way from the source to our darknet, we expect the received TTL value to be approximately 10-20 less than the starting value. From this, we infer 4 distinct starting values, of 32, 64, 128 and 255. As different operating systems choose different default TTL values, we can conclude that this traffic is likely coming from a cross-platform software application.
UDP SIP Traffic to 1.1.1.1
In analyzing the destination IP addresses of traffic to 1/8, we discovered a relatively high amount of hot-spots, compared to other /8s we analyzed during roughly the same time. We found that packets with a destination address in the 1.1.1.0/24 subnet made up 44.0% of packets and 58.7% of bytes in the 1.0.0.0/8 traffic over the entire week analyzed. Further analysis of this traffic showed that the vast majority of this traffic was UDP packets to 1.1.1.1, port 15206. This highly specific subset of traffic made up 34.2% of packets and 49.3% of bytes to the entire 1.0.0.0/8 subnet. We found that 71.0% of packets (75.8% of bytes) of traffic to UDP 1.1.1.1:15206 started with a payload of 0x8000. An additional 17.5% of packets (18.6% of bytes) started with 0x8008, and 7.4% of packets (2.8% of bytes) started with 0x8004. Previous analysis by RIPE suggested that this traffic was a trojan, however a couple of SIP blogs [28] [29] revealed that this traffic was likely RTP streams resulting from malicious SIP INVITE packets sent to vulnerable servers. These INVITE packets request that the server dial a telephone number, and send the resulting audio stream back to an IP address and port specified in the INVITE packet. In
5.2
DNS Traffic to 1.4.0.0
The second highest hot-spot in 1.0.0.0/8 is 1.4.0.0/24, receiving 16.6% of packets and 9.4% of bytes over the weeklong capture. We observed that almost all of this traffic was UDP packets to 1.4.0.0, on a handful of destination ports. Inspection of these packets reveals them to be validly constructed DNS queries. Over the week-long capture, 6,536,254 unique source IPs contributed to this traffic, mostly from a handful of ASNs. Using nmap, we were able to determine that most of these hosts were in fact ASUS DSL modems. We suspect that these modems have either a hardware or software misconfiguration that causes them to use 1.4.0.0 on certain non-standard ports as a DNS server. We are un-
71
Mar 11 23:59:57 Muck-TS.CheckUserDir check snapshot in \\muck-ts\david\archive\user\ 10088000\todo Mar 11 23:59:59 srv-tobit Creating Watchdog (C:\Programme\COSYNUS\ BlackBerry4Dv\TXEngine4BB. watchdog.txt) Mar 12 00:02:01 vm-eco_cosynus archive \\eco-online-serv\david\ archive\system\cosynus\bb4dv\bcc\ archive.dat is empty
Domains hotelnikkohimeji.co.jp x.myspacecdn.com wirelessdigest.typepad.com th411.photobucket.com www.google.com
Table 11: Example A record lookups to 1.4.0.0
sure why these modems would send DNS queries on such non-standard, yet concentrated few ports. Analysis of the domains that are being looked up to 1.4.0.0 shows a mix of domains that users are not likely to look up directly — for example, content distribution network domains from popular sites like myspace or youtube. This suggests that 1.4.0.0 is not the sole DNS server for the misconfigured box, as these CDN domains are looked up upon retrieval of the main site — which requires a successful DNS resolution in the first place.
5.3
Table 12: Three example syslog messages received on 50.153.199.194 UDP/514. The PRI part () corresponds to security/authorization messages with a debug (lowest) level severity.
sages contain combinations of the strings “david”, “tobit” and “cosynus”. We contacted Cosynus, a German software publishing company, that owns the Cosynus Blackberry connector, to verify the source of this traffic. This software allows Tobit software’s David to run on the blackberry. Tobit’s David software is a multimedia application available for Windows that consists of E-mail, speech, fax, RSS and instant messaging. Cosynus confirmed that some of their customers entered “062” as the first octet of an IP address during configuration. This is interpreted as octal, resulting in the traffic being sent to 50.153.199.194 instead of 62.153.199.194. Cosynus offered to firewall the victim IP address in future client updates, which should allow this /24 netblock to become useable. Table 12 shown an example of the messages received.
Iperf Traffic to 1.2.3.4
Roughly 1.8% of all packets measured to the 1.0.0.0/8 network were UDP packets with a destination port of 5001. This port is the default port commonly used by the network testing application iperf. These packets were all sent to the 1.2.3.4 destination IP address. This pollution by itself accounted for roughly 10Mbps of traffic and was observed to be originating from fewer than 100 unique sources.
5.4
IP Address Byte-Order Misconfiguration
Though not singly a high contributor of packets, there are three seemingly out-of-place /24s in the top 10 destination subnets for traffic captured to 1.0.0.0/8. These are 1.1.168.0/24, 1.0.168.0/24 and 1.2.168.0/24. Further analysis of packets with 168 in the third octet reveals almost all of these packets to be to 1.x.168.192. Interestingly, this is the popular RFC1918-space gateway address 192.168.x.1 in host-byte order for little-endian machines. Furthermore, these packets are UDP to destination port 80, and contain the same data. The UDP length field specifies 1 byte of payload data (9 bytes - 8 byte UDP header), and the data that follows the UDP packet is always 0x31. While we do not know of a specific device or program that would produce such packets, it is possible a program is sending raw packets, and not doing a proper htonl() on its destination IP. Another explanation is an embedded device (or other platform) using a big-endian architecture is running an incorrectly ported network application from a little-endian system, and could still be performing the byte-ordering switch. We also see the same UDP packets (destination port 80, same payload data) sent to 1.1.0.10, and 1.0.0.10, which are 10.0.1.1 and 10.0.0.1 (other popular RFC1918 gateway addresses) in little endian.
5.5
5.6
eMule to 35.206.63.212
In each week-long capture of 35/8 (datasets A-2, B-2, C2), 1.0% of packets and 0.9% of bytes were for a specific destination IP 35.206.63.212. Of this, roughly 83% was UDP packets, mostly with 18 bytes of data. The first two bytes of these packets are the same (e3 9a), followed by 16 bytes of varied data. These packets, when interpreted with the eDonkey protocol, a peer-to-peer file sharing protocol, indicate that these are “Get Sources” packets, used to fetch a seed-list for a given file hash. We found that 35.206.63.212 was listed as a fake server on the official eMule forum [30], confirming that this traffic is in fact peer-to-peer traffic using the eDonkey protocol.
5.7
µTorrent traffic Recently, newer versions of the popular bittrorrent client µTorrent have implemented a new protocol called Micro Transport Protocol (µTP), to provide better congestion control for bittorrent connections. µTP runs on top of UDP, allowing the µTorrent application to perform congestion control on its bittorrent streams independent of TCP congestion control. In each of our datasets we were able to observe approximately 4 MBit/s of µTP traffic. This traffic consists primarily of 33 byte packets, to various UDP ports. The destination IPs seem to be varied as well, though the source IP for a given destination IP appears to send packets only to that destination IP. In other words, each source IP sends several packets to only a single destination IP. Each 33 byte UDP packet starts with 12 bytes of changing
Syslog to 50.153.199.194
In dataset B-1 (50/8), an interesting hotspot on UDP destination port 514 caught our attention. Subsequent analysis revealed that the hotspot destination /24 is 50.153.199.0/24, receiving 3.8% of packets, and 6.7% of bytes for the entire 1 week capture. Almost all of these were to a single IP, 50.153.199.194, UDP port 514. Closer examination revealed that these packets are all syslog messages originating mainly from IPs in the .de (Germany) TLD. Many of these mes-
72
data, followed by 21 bytes of data that is the same in all packets: 7f ff ff ff ab 02 04 00 01 00 00 00 08 00 00 00 00 00 00 00 00. We were able to confirm that this 21 byte sequence occurs in packets generated during a torrent download with a recent version of µTorrent.
5.8
that any such network blocks that are found be placed on a well-known temporary watch list, publicized to the network operator community. Furthermore, address block tainting is not simply a result of Internet background radiation, but can also occur when address space is re-allocated from one user to another. Prior ownership of an address block might have resulted in that network block being placed on various spam or botnet blacklists, thereby affecting its usability. We would like to work with the RIRs and the Internet operator community to understand how a simple process can be put in place which attempts to mitigate the affect of address block pollution, either via the dissemination of widespread filters or via a sustained cleanup effort. A related issue is of the study address pollution beyond unallocated or reallocated blocks, including the problem of discovering and removing pollution in already allocated and routed blocks. While some work has been done on examining what is normal for background radiation [7] and how to maximize visibility to unused space within a network [31], we believe this is a very interesting future area of study. We view this work as yet another step in understanding the interesting phenomenon of Internet background radiation. As such, we hope to encourage follow-on work in this area by making the datasets used here available via the PREDICT [16] dataset archive. We acknowledge that the current policy for PREDICT limits the use of these datasets to research carried out at US institutions. We will continue to work with existing internal PREDICT efforts to broaden participation beyond its initial scope. Until these efforts bear fruit, the authors encourage interested non-US researchers to contact them directly to investigate alternative paths to data sharing, including jointly seeking institutionally approved research studies (e.g., via research oversight organizations such as the US institutional review board system and similar systems abroad) and/or through entering into researcher-specific data sharing agreements.
Responding to Pollution
In responding to these unique forms of pollution, we adopt the philosophy of the original authors of [10] to build classifiers for the removal of the unwanted traffic. Our purpose, however, is different. Unlike [10], we are not attempting to reduce traffic in order to build a scalable active responder, our goal instead is to determine the usability of a network block and the utility of any cleanup effort. Given the concentrated nature of much of this pollution, these classifiers need not be complicated and may often simply filter based on net-blocks. Table 8 lists the top 10 most polluted /24 network blocks in 1/8. Together these account for 75% of all packets and 85% of all bytes of pollution traffic to the 1/8 network block. Based on this, APNIC has already proposed the following filters for one of their recently allocated blocks based on this philosophy: “The following /24s should be withheld from general allocation by APNIC: 1.0.0.0/24, 1.1.1.0/24, 1.2.3.0/24, 1.4.0.0/24, 1.10.10.0/24. If further investigation reveals that the traffic to any of these /24s abates to a normal background level in the future, then these addresses would be returned to the APNIC unallocated address pool at that time.” We also know that a cleanup of some of the pollution to 50/8 is possible, as we have contacted the software vendors responsible for the misconfiguration. Their response was helpful in eliminating the pollution being caused by their software. The pollution traffic which we were able to identify as SIP was originating from only a few thousands of sources and the iperf pollution traffic was originating from only a few tens of unique sources. These as well as other similar types of pollution can likely be minimized with a sustained cleanup effort.
6.
Acknowledgments The authors wish to thank the anonymous reviewers for their helpful comments and suggestions. Furthermore, we wish to thank the IMS team, especially Evan Cooke, without whom the longitudinal collections would not have been possible. We would also like to thank Jakub Czyz and Michael Milliken at Merit for their help in the collection and archiving of the data used in this paper. This work was supported in part by the Department of Homeland Security (DHS) under contract numbers NBCHC080037, NBCHC060090, and FA8750-08-2-0147, the National Science Foundation (NSF) under contract numbers CNS 091639, CNS 08311174, CNS 0627445, and CNS 0751116, and the Department of the Navy under contract N000.14-09-1-1042.
CONCLUSIONS AND FUTURE WORK
In this paper we have taken a fresh look at Internet background radiation. While today’s Internet radiation continues to be as ubiquitous, variegated, and dynamic as was uncovered in the initial study [10], we note several important changes since the last study including: rapid growth outpacing the growth in productive network traffic, reduced contribution from the exploit ports reported in previous work, and trends toward increasing SYN and decreasing SYN-ACK traffic. In examining traffic across address blocks, we note that significant differences exist, but often these differences are clustered in a handful of network blocks. We use the term Internet address pollution to refer to this significant nonuniform behavior that is primarily the result of environmental rather than algorithmic factors. We examine several case studies in Internet address pollution and offer some specific suggestions for filtering the most egregious of these blocks. We would like to develop a more systematic process that passes all newly allocated network blocks through an evaluation phase, where potential usability of the block is assessed. Any recipient of a tainted network block will be unfairly penalized in terms of bandwidth costs and actual usability of their address space. Therefore, it is important
7.
REFERENCES
[1] D. Moore, V. Paxon, S. Savage, and Shannon C. Inside the Slammer Worm. In Proceedings of IEEE Security and Privacy, Jun 2003. [2] D. Moore, C. Shannon, and J. Brown. A Case Study on the Spread and Victims of an Internet Worm. In Proceedings of ACM SIGCOMM Internet Measurement Workshop, Nov 2002. [3] Michael Bailey, Evan Cooke, David Watson, Farnam
73
[4]
[5]
[6]
[7]
[8]
[9]
[10]
[11]
[12]
[13]
[14]
[15]
[16] [17]
[18]
Jahanian, and Jose Nazario. The Blaster Worm: Then and Now. IEEE Security & Privacy, 3(4):26–31, 2005. D. Moore, G. Voelker, and S. Savage. Inferring Internet Denial of Service Activity. In Proceedings of the 2001 USENIX Security Symposium, Aug 2001. M. Bailey, E. Cooke, D. Watson, F. Jahanian, and N. Provos. Practical Darknet Measurement. In Proceedings of the 40th Annual Conference on Information Sciences and Systems (CISS), Mar 2006. D. Moore, C. Shannon, G.M. Voelker, and S. Savage. Network Telescopes. Cooperative Association for Internet Data Analysis - Technical Report, 2004. M. Bailey, E. Cooke, D. Watson, F. Jahanian, and N. Provos. Towards Understanding Distributed Blackhole Placement. In Proceedings of the 2nd Workshop on Rapid Malcode (WORM), Oct 2004. V. Yegneswaran, P. Barford, and D. Plonka. On the Design and Use of Internet Sinks for Network Abuse Monitoring. In Proceedings of the Symposium on Recent Advances in Intrusion Detection, Sep 2004. M. Bailey, E. Cooke, D. Watson, F. Jahanian, and N. Provos. The Internet Motion Sensor - A Distributed Blackhole Monitoring System. In Proceedings of the 12th Annual Network and Distributed System Security Symposium (NDSS), Feb 2005. R. Pang, V. Yegneswaran, P. Barford, V. Paxson, and L. Peterson. Characteristics of Internet Background Radiation. In Proceedings of the 4th ACM SIGCOMM Conference on Internet Measurement, Oct 2004. Moheeb Abu Rajab, Jay Zarfoss, Fabian Monrose, and Andreas Terzis. A multifaceted approach to understanding the botnet phenomenon. In IMC ’06: Proceedings of the 6th ACM SIGCOMM on Internet measurement, pages 41–52, New York, NY, USA, 2006. ACM Press. Evan Cooke, Farnam Jahanian, and Danny McPherson. The Zombie roundup: Understanding, detecting, and disrupting botnets. In Proceedings of the Steps to Reducing Unwanted Traffic on the Internet (SRUTI 2005 Workshop), Cambridge, MA, July 2005. E. Eugene Schultz. Where have the worms and viruses gone?–new trends in malware. Computer Fraud & Security, 2006(7):4–8, 2006. Craig Labovitz, Scott Iekel-Johnson, Danny McPherson, Jon Oberheide, and Farnam Jahanian. Internet Inter-Domain Traffic. In Proc. ACM SIGCOMM (To Appear), 2010. Geoff Huston. The changing Foundation of the Internet: confronting IPv4 Address Exhaustion. The Internet Protocol Journal, September 2008. Protected Repository for the Defense of Infrastructure Against Cyber Threats. http://www.predict.org. Michael Bailey, Evan Cooke, Farnam Jahanian, Niels Provos, Karl Rosaen, and David Watson. Data Reduction for the Scalable Automated Analysis of Distributed Darknet Traffic. Proceedings of the USENIX/ACM Internet Measurement Conference, October 2005. Sushant Sinha, Michael Bailey, and Farnam Jahanian. Shedding light on the configuration of dark addresses.
[19]
[20]
[21]
[22]
[23]
[24]
[25]
[26] [27]
[28]
[29]
[30]
[31]
74
In Proceedings of Network and Distributed System Security Symposium (NDSS ’07), February 2007. John Bethencourt, Jason Franklin, and Mary Vernon. Mapping Internet sensors with probe response attacks. In Proceedings of the 14th USENIX Security Symposium, Baltimore, MD, August 2005. Moheeb Abu Rajab, Fabian Monrose, and Andreas Terzis. On the effectiveness of distributed worm monitoring. In Proceedings of the 14th USENIX Security Symposium, Baltimore, MD, August 2005. Evan Cooke, Z. Morley Mao, and Farnam Jahanian. Hotspots: The root causes of non-uniformity in self-propagating malware. In Proceedings of the International Conference on Dependable Systems and Networks (DSN’2006), June 2006. Abhishek Kumar, Vern Paxson, and Nicholas Weaver. Exploiting underlying structure for detailed reconstruction of an internet-scale event. Proceedings of the USENIX/ACM Internet Measurement Conference, October 2005. Mark Allman, Vern Paxson, and Jeff Terrell. A brief history of scanning. In IMC ’07: Proceedings of the 7th ACM SIGCOMM conference on Internet measurement, New York, NY, USA, 2007. Route Views Project. University of Oregon Route Views Project. http://archive.routeviews.org/, Aug 2010. ˜ ˜ RIPE (RAl’seaux IP EuropAl’ens). RIS Raw Data. http://www.ripe.net/projects/ris/rawdata.html, Aug 2010. RADb: Merit network inc. routing assets database. http://www.radb.net/. B. Kantor, S. Savage, R. Wesson, B. Enright, P. Porras, V. Yegneswaran, J. Wolfgang, and Castro S. Conficker/Conflicker/Downadup as seen from the UCSD Network Telescope - Feb 2009. http://www.caida.org/research/security/ms08067/conficker.xml. S. Gauci. RTP Traffic to 1.1.1.1 - Feb 2010. http://blog.sipvicious.org/2010/02/rtp-traffic-to1111.html. S. Eivind. usken.no - VoIP news! - Feb 2010. http://www.usken.no/2010/02/sip-scanning-causesddos-on-ip-1-1-1-1/. ˜ so. Fake Servers List - Official Adrian MariA´ eMule-Board - Apr 2010. http://forum.emuleproject.net/index.php?showtopic=139609&st=60. Evan Cooke, Michael Bailey, Farnam Jahanian, and Richard Mortier. The Dark Oracle: Perspective-Aware Unused and Unreachable Address Discovery. In Proceedings of the 3rd Symposium on Networked Systems Design & Implementation (NSDI ’06), pages 101–114, San Jose, California, USA, May 2006.