What Happened in my Network? Mining Network Events from Router Syslogs Tongqing Qiu
Zihui Ge
Dan Pei
Georgia Tech Atlanta, GA
AT&T Labs – Research Florham Park, NJ
AT&T Labs – Research Florham Park, NJ
[email protected]
[email protected] [email protected]
Jia Wang
Jun (Jim) Xu
AT&T Labs – Research Florham Park, NJ
∗
Georgia Tech Atlanta, GA
[email protected]
[email protected]
ABSTRACT
General Terms
Router syslogs are messages that a router logs to describe a wide range of events observed by it. They are considered one of the most valuable data sources for monitoring network health and for troubleshooting network faults and performance anomalies. However, router syslog messages are essentially free-form text with only a minimal structure, and their formats vary among different vendors and router OSes. Furthermore, since router syslogs are aimed for tracking and debugging router software/hardware problems, they are often too low-level from network service management perspectives. Due to their sheer volume (e.g., millions per day in a large ISP network), detailed router syslog messages are typically examined only when required by an on-going troubleshooting investigation or when given a narrow time range and a specific router under suspicion. Automated systems based on router syslogs on the other hand tend to focus on a subset of the mission critical messages (e.g., relating to network fault) to avoid dealing with the full diversity and complexity of syslog messages. In this project, we design a SyslogDigest system that can automatically transform and compress such low-level minimally-structured syslog messages into meaningful and prioritized high-level network events, using powerful data mining techniques tailored to our problem domain. These events are three orders of magnitude fewer in number and have much better usability than raw syslog messages. We demonstrate that they provide critical input to network troubleshooting, and network health monitoring and visualization.
Management, Performance
Keywords Syslog, Data Mining, Troubleshooting
1.
Categories and Subject Descriptors C.2.3 [Computer System Organization]: Communication Networks—Network Operations
INTRODUCTION
Router syslogs are messages that a router logs to describe a wide range of events observed by it. Although router syslogs are primarily designed and intended for router vendors to track and debug router software/hardware problems, they are also widely used by the network service providers as one of the most valuable data sources in monitoring network health and in troubleshooting network faults and performance anomalies. However, working with raw syslog messages is not easy from network service management prospectives. First, router syslog messages are essentially free-form text with only a minimal structure. The type of information that is logged and its formats vary among different vendors and router operating systems. Second, router syslog messages are often too low-level. They do not directly translate into what actually happened in the network (i.e., network events) without meaningful abstraction and aggregation. Third, not every router syslog message is an indication of an occurrence of an incident that could potentially impact network services. For example, some router syslog messages are generated purely for debugging purposes and have no implications on network services. Although large ISP (Internet Service Provider) network, consisting of thousands of routers, is expected to observe millions of information-rich syslog message per day, the lack of sentence structures in log messages and relational structures across messages prevents router syslogs from being utilized to its fullest extent in various network management applications. Network monitoring systems typically rely on the input of domain knowledge to be able to focus on a rather small (yetdeemed important) subset of syslog messages. For example, commercial network management tools such as Lonix [1] and NetCool [2] focus on a small set of messages concerning network faults. The syntax and the relations of these syslog messages are explicitly captured to allow for automated parsing and understanding. When certain patterns of syslog messages are observed in the network, alarms are triggered and operation tickets are issued. The parsers and the message relationship models therein need to be constantly updated to keep up with network changes. For example, routers upgraded to a new operat-
Computer-
∗This work was supported in part by NSF grant CNS-0905169, funded under the American Recovery and Reinvestment Act of 2009 (Public Law 111-5), and NSF grant CNS-0716423.
Permission to make digital or hard copies of all or part of this work for personal or classroom use is granted without fee provided that copies are not made or distributed for profit or commercial advantage and that copies bear this notice and the full citation on the first page. To copy otherwise, to republish, to post on servers or to redistribute to lists, requires prior specific permission and/or a fee. IMC’10, November 1–3, 2010, Melbourne, Australia. Copyright 2010 ACM 978-1-4503-0057-5/10/11 ...$10.00.
472
ing system may introduce new syslog message formats and hence require a new parser. Network issues can also fly under the radar if they do not match syslog patterns already programmed. Meanwhile, when troubleshooting a network event, network operators have to focus on a narrow time-window and a specific router in examining the raw syslog messages in detail, in order to avoid being overwhelmed by the number of syslog messages. It is a very time-consuming and inefficient process when a complicated network incident involves a large number of messages. Moreover, by limiting to a small scope, operators lose the sight of “big picture”, such as the information regarding the frequency or the scope of the kind of network events under investigation. Finally, network auditing and trend analysis systems have to rely on rather simple frequency statistics when it comes to router syslogs. For example, MERCURY [15] detects network behavior changes due to network upgrades by tracking the level-shift of message frequencies of individual syslogs. Knowing the relationship across syslog messages would make the result much more meaningful. In this work, we focus on proactively mining network events from router syslogs. In particular, we design an automated system (called SyslogDigest) that transforms and compresses massive lowlevel minimally-structured syslog messages into a small number of meaningful and prioritized high-level network events. SyslogDigest is vendor/network independent and does not require domain knowledge on expected network behaviors. It automatically identifies signatures of different types of syslog messages in terms of both their syntax and temporal patterns (e.g., interarrival time of each type of syslog messages). In addition, SyslogDigest learns association rules between different types of syslog messages both on the same router and across routers. The combination of the signatures and association rules of syslog messages enables us to group them into meaningful network events. Furthermore, SyslogDigest prioritizes network events using a number of severity/importance measures. This allows network operators to quickly identify and focus on important network events. More importantly, this enables complex network troubleshooting, in which thousands to tens of thousands of syslog messages on multiple routers may be related to a single network event and may need to be identified out of millions of syslog messages for examination. SyslogDigest systematically classifies and groups these syslog messages into a single meaningful event, making obsolete the long and error-prone manual grouping process in the current practice. This automated grouping capability not only enables monitoring overall network health and tracking the appearance and evolvement of network events, but also allows for much better network visualization, since visualizing such network events provides a much clearer and more accurate big picture of what happened in the network than visualizing raw syslog messages. It is also worth noting that, SyslogDigest greatly alleviates our reliance on the domain knowledge of (human) network operators in interpreting syslog messages. Instead, SyslogDigest is able to learn signatures and rules that capture how the network behaves over time. That is, SyslogDigest automatically learns network domain knowledge directly from the data. Such domain knowledge not only tells us what happens in the network, but also provides direct insights on “how the network behaves” vs. “how the network should behave”. In addition, external domain knowledge, if available, can be easily input into SyslogDigest to further enhance or customize the system. We apply SyslogDigest to router syslog messages collected from two large operational IP networks: one tier-1 ISP backbone network and one large IPTV backbone network. We show that SyslogDigest outputs prioritized network events that are over three or-
ders of magnitude fewer in number and have much better usability than raw syslog messages. Using real applications, we further demonstrate that they provide critical input to not only network troubleshooting but also network health monitoring and visualization. To summarize, we make four major contributions in this paper. 1. We designed an automated tool SyslogDigest that transforms massive volume of router syslog messages into a much smaller number of meaningful network events. 2. We developed effective techniques tailored to our problem domain to systematically identify signatures of syslog messages, learn association rules that capture network behaviors over time, group relevant raw syslog messages across multiple routers into network events, and label and prioritize network events based on their nature and severities. 3. We conducted large-scale experiments on real router syslog data collected from two large operational IP networks and demonstrated that SyslogDigest is able to transform millions of syslog messages into network events that are over three orders of magnitude fewer in number and smaller in size. The remainder of this paper is organized as follows. Section 2 describes the syntax and semantics of router syslogs. Section 3 presents an overview of SyslogDigest system and Section 4 describes the detailed methodologies it uses. Section 5 presents the evaluation results based on router syslog data collected from two large operational IP networks. We present some applications of SyslogDigest in Section 6 and related work in Section 7. Finally, Section 8 concludes the paper.
2.
ROUTER SYSLOG
In this section, we provide an overview of the syntax and semantics of router syslog messages. Similar to syslogs on computer servers, router syslogs are the messages that routers generate to record the hardware and software conditions observed by them, such as link and protocol-related state changes (e.g., down or up), alarming environmental measurements (e.g., high voltage or temperature), and warning messages (e.g., triggered when BGP neighbors send more routes than the router is configured to allow). Although syslog messages are intended primarily for tracking and debugging router software and hardware problems, they can be extremely valuable to network operators in managing networked services and troubleshooting network incidents. For this reason syslogs are usually collected on all routers inside a network, especially an ISP network, and a syslog (transmission) protocol [6] is standardized and widely supported by router vendors to transmit syslog messages from routers to one or more syslog collector(s). While the syslog protocol – for transmitting syslog messages – is standardized, the syslog messages themselves are not. They are essentially free-form texts, the syntax and semantics of which vary among router vendors and router operating systems. Table 1 shows a few examples of syslog messages from two router vendors. We can observe only a minimal structure in a syslog message: (1) a timestamp indicating when the message is generated, (2) the identifier of the router that generates the message (called originating router), (3) message type, also known as the error code, indicating the nature of the problem, and (4) detailed message information generated by the router OS. In order to correlate syslog messages across routers, the clocks (for generating the timestamps) on these routers need to be synchronized often through the Network Time Protocol (NTP), which is the case in our studies.
473
Table 1: Syslog messages example Vendor V1 V1 V1
Message timestamp 2010-01-10 00:00:15 2010-01-10 00:00:15 2010-01-10 00:00:15
Router r1 r5 r8
Message-type/error-code LINEPROTO-5-UPDOWN LINK-3-UPDOWN SYS-1-CPURISINGTHRESHOLD
V1 V2 V2 V2
2010-01-10 00:00:26 2010-01-10 00:00:23 2010-01-10 00:00:24 2010-01-10 00:00:26
r8 ra rb ra
SYS-1-CPUFALLINGTHRESHOLD SNMP-WARNING-linkDown SVCMGR-MAJOR-sapPortStateChangeProcessed SNMP-WARNING-linkup
The detailed message information (aforementioned field (4)) in router syslogs is quite ad hoc in nature. They are simply free-form texts “printf"-ed by router operating systems with detailed information such as the location, state/status, or measurement readings of a alarming condition embedded in them. For example, in Table 1 line 1, (Line protocol on Interface Serial13/0.10/20:0, changed state to down), the Serial13/0.10/20:0 part indicates the network interface at which the layer-2 line protocol (PPP) has been impacted and the down part indicates the status/state of the line protocol. The rest of it, Line protocol on Interface ..., changed state to ..., can be viewed as the sub type for this type of syslog message. It is worth noting that there are often multiple sub types associated with the same syslog type (error code). The combination of syslog type and this sub type can be used as a template to uniquely identify the class of network conditions that the syslog message describes. In some syslog versions, the error code field contains severity information. For example, in the first four lines (vendor V1 syslogs) of Table 1, the number between two “-” symbols is the severity level of the messages – the smaller the number is, the more important the message is perceived by the originating router. It is important to note, however, that the severity level of a syslog message is assigned by the equipment vendor based on the perceived impact of the observed event on the performance and proper functioning of the local network elements. It does not in general translate into the severity of the impact that this event will have on the performance and proper functioning of the overall network and therefore cannot be directly used for to rank-order the importance of events for network service management purposes. For example, syslog messages concerning router CPU utilization rising above or falling below a given threshold (lines 3 and 4 in Table 1) have been considered more important (smaller in severity number) than those concerning an adjacent link changing its state to “down" (line 2 in Table 1) in some router OS. Network operators would certainly disagree in this case. Router configuration tools usually allow network operators to specify a threshold such that potential syslog messages with severity levels above or equal to it will be recorded. In this study, we collect syslogs at such “informational” level (usually the default setting). Depending on the network conditions, the amount of router syslog messages in an operational network varies. In the largescale ISP network (hundreds to thousands routers) that we study in the paper, there are typically hundreds of thousands to millions of messages per day.
3.
Detailed message Line protocol on Interface Serial13/0.10/ 20:0, changed state to down Interface Serial2/0.10/2:0, changed state to down Threshold: Total CPU Utilization(Total/Intr): 95%/1%, Top 3 processes (Pid/Util): 2/71%, 8/6%, 7/3% Threshold: Total CPU Utilization(Total/Intr) 30%/1%. Interface 0/0/1 is not operational The status of all affected SAPs on port 1/1/1 has been updated. Interface 0/1/0 is operational
condition on a network element, such as an network interface, router hardware, and router software, can often trigger a large number of different messages across time, protocol layers, and routers. For example, messages m1 to m16 in Table 2 are all triggered by the same network condition: the link between routers r1 and r2 flapped a couple of times. Based on this observation, our basic idea is to automatically construct a network event by grouping together related messages, i.e., those triggered by the same network condition, and then prioritize network events using a number of severity/importance measures. Our goal is to be able to automatically determine such connections or the lack of them among syslog messages without relying on domain knowledge being manually input and updated (by network operators). SyslogDigest accomplishes this goal through a two-step process. In this first step, an offline domain knowledge learning component automatically extracts relevant domain knowledge from raw syslog data. In the second step, an online processing component will rely on such acquired domain knowledge and other available information (e.g., temporal closeness of messages) to finally group related messages into high-level events and present the prioritized results. In the rest of this section, we will provide a high-level overview of SyslogDigest’s architecture, shown in Figure 1, and the functionalities of its components, by working out a running example shown in Table 2, where 16 syslog messages are eventually grouped into 1 high-level network event.
3.1
Offline Domain Knowledge Learning
The offline domain knowledge learning component automatically acquires domain knowledge such as the syntax/semantics of syslog messages, the relationships among various message templates, and the detailed location information pertained from raw syslog data. The offline domain knowledge learning proceeds as follows. First, it automatically learns message templates from the historical syslog messages. To deal with the challenge posed by minimally-structured messages from different vendors and/or different OS versions that adopt different template syntax/semantics systems, we develop an effective signature identification technique in which messages are decomposed into whitespace-separated words and a frequent word (excluding those words denoting specific locations) sequence is considered as a template. For example, without going into the details of the signature identification technique, it is intuitive to see the following template can be extracted: t1: LINK-3-UPDOWN Interface ..., changed state to down, t2: LINEPROTO-5-UPDOWN Line protocol on Interface ..., changed state to down, t3: LINK-3-UPDOWN Interface ..., changed state to up, and t4: LINEPROTO-5-UPDOWN Line protocol on Interface ..., changed state to up.
SYSTEM DESIGN OVERVIEW
The goal of the SyslogDigest system is to automatically transform and compress low-level minimally-structured syslog messages into meaningful and prioritized high-level network events. Our key observation is that one single (sometimes intermittent)
474
Table 2: Toy Example. Router r1’s interface Serial1/0.10/10:0 is connected to r2’s inteface Serial1/0.20/20:0. index m1 m2 m3 m4 m5 m6 m7 m8 m9 m10 m11 m12 m13 m14 m15 m16
timestamp 2010-01-10 00:00:00 2010-01-10 00:00:00 2010-01-10 00:00:01 2010-01-10 00:00:01 2010-01-10 00:00:10 2010-01-10 00:00:10 2010-01-10 00:00:11 2010-01-10 00:00:11 2010-01-10 00:00:20 2010-01-10 00:00:20 2010-01-10 00:00:21 2010-01-10 00:00:21 2010-01-10 00:00:30 2010-01-10 00:00:30 2010-01-10 00:00:31 2010-01-10 00:00:31
router r1 r2 r1 r2 r1 r2 r1 r2 r1 r2 r1 r2 r1 r2 r1 r2
message-type/error-code LINK-3-UPDOWN LINK-3-UPDOWN LINEPROTO-5-UPDOWN LINEPROTO-5-UPDOWN LINK-3-UPDOWN LINK-3-UPDOWN LINEPROTO-5-UPDOWN LINEPROTO-5-UPDOWN LINK-3-UPDOWN LINK-3-UPDOWN LINEPROTO-5-UPDOWN LINEPROTO-5-UPDOWN LINK-3-UPDOWN LINK-3-UPDOWN LINEPROTO-5-UPDOWN LINEPROTO-5-UPDOWN
Historical Syslog data
router config
Signature Identification
Location Extraction
detailed message Interface Serial1/0.10/10:0, changed state to down Interface Serial1/0.20/20:0, changed state to down Line protocol on Interface Serial1/0.10/10:0, changed state to down Line protocol on Interface Serial2/0.20/20:0, changed state to down Interface Serial1/0.10/10:0, changed state to up Interface Serial1/0.20/20:0, changed state to up Line protocol on Interface Serial1/0.10/10:0, changed state to up Line protocol on Interface Serial2/0.20/20:0, changed state to up Interface Serial1/0.10/10:0, changed state to down Interface Serial1/0.20/20:0, changed state to down Line protocol on Interface Serial1/0.10/10:0, changed state to down Line protocol on Interface Serial2/0.20/20:0, changed state to down Interface Serial1/0.10/10:0, changed state to up Interface Serial1/0.20/20:0, changed state to up Line protocol on Interface Serial1/0.10/10:0, changed state to up Line protocol on Interface Serial2/0.20/20:0, changed state to up
Historical Syslog data
Domain Expert
Signature Matching
Rule Mining
Location Parsing
Domain Expert Rule Adjustment
Historical Syslog+ data Temporal Mining
Offline Domain Knowledge Learning
Domain Knowledge Base
Message Template
Location dictionary
Temporal Patterns
Rule set
Message grouping Real-time Syslog data
Signature Matching
Location Parsing
Realtime Syslog+ data
Temporal Grouping
Rule based Grouping
Cross Router Grouping
Prioritization
Presentation
Syslog Digest
Online Processing
Figure 1: SyslogDigest Architecture. Bold arrows denotes the data flow. Dotted components run offline. Second, to be able to parse the location information embedded and hidden in syslog messages, SyslogDigest learns and builds a “dictionary" for the locations in each router’s syslog messages based on its configuration files (i.e., router configs). One might be tempted to parse the location information purely based on the vendor manual description for each message. This can however be overly expensive due to the high diversity of message formats and large number of messages. Our solution is based on one key observation: a router almost always writes to syslog messages only the location information it knows, i.e, those configured in the router. Our solution is therefore to parse router configs (much better formatted and documented than syslog messages) to build a dictionary of its locations offline. With router configs, we also build the mapping between different locations, e.g., from an interface name to its IP address, and the hierarchical location relationship between interfaces, ports and linecards, and network topology such as the interfaces connecting two routers. These mappings enable us to group syslog messages with related locations. In the example shown in Table 2, the location dictionary will contain interfaces r1,Serial1/0.10/10:0 and r2,Serial1/0.20/20:0 and also the information that these two interfaces are connected to each other. Third, to learn the relationship among different templates, we first augment each historical syslog message with additional information, including message template and its location information, by matching it with the templates and locations previously learned. In our example, m1 is augmented as
m1|t1|r1,Serial1/0.10/10:0 (with template t1 and location r1,Serial1/0.10/10:0 appended), and m4 is augmented as m4|t2|r2,Serial1/0.20/20:0, and so on. The resulting messages are called Syslog+ messages in our system. We then apply association rule mining techniques to Syslog+ messages to learn the relationships (i.e., associations) among different messages with different templates. A rule of thumb is that if two messages frequently occur close enough in time and at related locations (postpone the details to Section 4), they are considered associated and should be grouped together. For example, if syslog messages in templates t1 and t2 often happen close together, the association t1, t2 will be declared. Domain experts can be asked to comment on and/or adjust such associations (some of which can be “puzzling" or even “bizarre") but this is entirely optional. Finally, SyslogDigest learns the temporal patterns of each template from Syslog+ message. The intuition is that messages with same template can appear periodically (e.g., due to various network timers), and if so, these events can be grouped together. Such kind of periodicity can be learned offline through measurements of corresponding interarrival times and predictions based on their linear regression. The above domain knowledge learning process will be periodically run (offline) to incorporate the latest changes to router hardware and software configurations, and the acquired domain knowledge will be used as input to the online SyslogDigest System.
475
3.2
Online SyslogDigest System
Table 3: The messages belong to the same message type (BGP5-ADJCHANGE)
The online system takes the real-time syslog message stream as well as the previously learned domain knowledge as input, and output meaningful prioritized network events, in a two-step process. The first step is to augment the real-time syslog messages with template and location information just like in the aforementioned offline process, and output the (augmented) Syslog+ messages in an online fashion. The second step is to group related Syslog+ messages together to construct meaningful network events. We propose three grouping methods: temporal grouping, rule-based grouping and crossrouter grouping. Temporal grouping targets at messages with the same template on the same router. It groups together messages that have the same template and happen periodically, where such periodicity (temporal patterns) is already detected during the offline temporal mining. In our example, it is intuitive to see that after the temporal grouping, m1, m5, m9, m13 (with common template t1 and common location r1,Serial1/0.10/10:0) are grouped together. So are (m2, m6, m10, m14), (m3, m7, m11, m15), and (m4, m8, m12, m16). Rule-based grouping targets the messages with different templates on the same router. Based on the association rules learned by the offline learning component and saved in a domain knowledge base, this method groups messages that have different templates, but happen close together in time. In our example, after the rulebased grouping, messages m1, m3, m5, m9, m11, m13, m15 are grouped together due to association rule {t1, t2} with common location r1,Serial1/0.10/10:0. Messages m2, m4, m6, m8, m10, m12, m14, m16 are grouped together due to association rule {t3, t4} and common location r2,Serial1/0.20/20:0. Finally, the cross-router grouping method will group together messages with locations that are on different routers yet closely connected (e.g. two ends of one link, two ends of one BGP session), determined by the location dictionary in the domain knowledge base. They will be applied to the Syslog+ messages in this order (justifications explained later). After these three grouping methods are applied in the order that they are described above to the online syslog message stream, we obtain groups of messages, each of which is considered a single network event, which are much smaller in number compared to the raw syslog messages. In our example, m1 to m16 are eventually grouped together into a single network event. The final step is to prioritize and present the network events based on their perceived importance to network operators. Various factors are considered together to determine the (relative) importance of an event, including the number of messages the event (group) contains, the frequency of this event type in the history and the perceived impact of this event on network health. Each event is presented as a well-formatted text line, with multiple fields summarizing the information contained in the raw syslog messages that are grouped into this event, including the start/end timestamps of this event, an location field that records where the event happens, an event type field that is more informative than its counterpart in individual raw syslog messages, and an index field that allows us to retrieve these raw syslog messages if necessary. The presentation of Table 2 could be 2010-01-10 00:00:00|2010-01-10 00:00:31|r1 Interface Serial1/0.10/10:0 r2 Interface Serial1/0.20/20:0|link flap, line protocol flap.
neighbor 192.168.32.42 vpn vrf 1000:1001 Up neighbor 192.168.100.194 vpn vrf 1000:1002 Up neighbor 192.168.15.78 vpn vrf 1000:1003 Up neighbor 192.168.108.38 vpn vrf 1000:1004 Up neighbor 192.168.0.26 vpn vrf 1000:1004 Down Interface flap neighbor 192.168.7.6 vpn vrf 1000:1001 Down Interface flap neighbor 192.168.0.238 vpn vrf 1000:1003 Down Interface flap neighbor 192.168.2.114 vpn vrf 1000:1002 Down Interface flap neighbor 192.168.183.250 vpn vrf 1000:1002 Down BGP Notification sent neighbor 192.168.114.178 vpn vrf 1000:1003 Down BGP Notification sent neighbor 192.168.131.218 vpn vrf 1000:1001 Down BGP Notification sent neighbor 192.168.55.138 vpn vrf 1000:1000 Down BGP Notification sent neighbor 192.168.1.13 vpn vrf 1000:1000 Down BGP Notification received neighbor 192.168.12.241 vpn vrf 1000:1002 Down BGP Notification received neighbor 192.168.155.66 vpn vrf 1000:1003 Down BGP Notification received neighbor 192.168.254.29 vpn vrf 1000:1004 Down BGP Notification received neighbor 192.168.35.230 vpn vrf 1000:1004 Down Peer closed the session neighbor 192.168.171.166 vpn vrf 1000:1001 Down Peer closed the session neighbor 192.168.2.237 vpn vrf 1000:1002 Down Peer closed the session neighbor 192.168.0.154 vpn vrf 1000:1003 Down Peer closed the session
m1 m2 m3 m4 m5 m6 m7 m8 m9 m10 m11 m12 m13 m14 m15 m16 m17 m19 m19 m20
Table 4: Sub message types of BGP-5-ADJCHANGE M1 M2 M3 M4 M5
4.
neighbor * vpn vrf * Up neighbor * vpn vrf * Down Interface flap neighbor * vpn vrf * Down BGP Notification sent neighbor * vpn vrf * Down BGP Notification received neighbor * vpn vrf * Down Peer closed the session
SYSLOG-MINING METHODOLOGIES
In this section, we present the detailed methodologies used in both the offline learning and the online digesting systems.
4.1
Offline Learning Methodologies
There are several basic aspects that we need to learn from syslog messages: message templates, location information, temporal patterns of message templates and template relationship.
4.1.1
Message Template Learning
As mentioned earlier, raw syslog messages have little structure. Although there is a message type field to describe the characteristics of messages, for each message type there can be multiple sub types. For example in Table 3, while all messages belong to the same type "BGP-5-ADJCHANGE" and correspond to BGP adjacency change in MPLS VPN, the details of these messages (and hence their sub types) can be different. At issue is how to automatically construct such sub types and combine them with the message type to form the template without intervention from domain experts. In our example, the neighboring IP addresses and the VRF1 IDs (e.g. VRF 1000:1001 in m1 ) differ from one message to another, but when these two fields are masked (i.e., replaced by the same symbol, say asterisk, as shown in Table 4), there are only five distinct “structure" types, or sub types as we call them. In practice, however, it is not easy to manually find all masked parts without domain knowledge, because all needed-masked parts do not have obvious pattern like IP address or VRF ID. Our template learning approach is inspired by the signature abstraction used in spam detection [18]. The high level idea 1 VRF stands for Virtual Routing and Forwarding. It is a technology that allows multiple instances of a routing table to co-exist within the same router at the same time. VRF is a common technique used in VPN environment. The VRF ID XXX:XXXX is a simple conceptional name.
476
Physical hierarchy
Logical configuration
Path
Router Logical L3 Interface Slot/Line card Multilink/Bundlelink Physical L3 Interface Port
Interface
Figure 2: Sub type tree construction example.
Figure 3: Location hierarchy
is that a signature, which corresponds to an aforementioned sub type node, is a combination of words with high frequency. We decompose messages into words separated by whitespace. For each type of message, we construct a tree structure to express the template (sub type) hierarchy based on the input messages (e.g. m1 , m2 , . . . , m20 ), shown in Figure 2. We say that a word associates with a message when the word appears in the message. The detailed construction algorithm follows breath-first search tree traversal. We first use the message type (e.g. BGP-5ADJCHANGE) as the root of the tree. All messages are associated with this message type. Then given the parent node, we look for the most frequent combination of words which can associate with most messages that the parent node can associate with, and make this combination as a child node. We repeat this process to create child nodes based on remaining messages, until all messages have been associated. We then recursively proceed to the child nodes and repeat the process. Finally we prune the tree until it has the desired degree properties as follows. If a parent node has more than k children, we will discard all children to make the parent a leaf itself. Now each path from root to the each leaf become one template (type + sub type). The intuition of this pruning is that on the one hand, there are only a few sub types for each message type, on the other hand, usually there would be many more messages associated with each sub type. For example, there should be many IPs and VRF addresses associated with each sub type given enough data. In practice, We choose k = 10 based on our experience that no message type has more than 10 sub types. Our template inference approach is quite generic because it is based on the words frequency as opposed to text semantic. However, we use an implicit assumption that the variable part of the syslog messages would appear as many distinct values given enough historical data. This assumption is surely not always true. For example, if certain protocol are enabled only on one type of network interface, say GigabitEthernet, then the “GigabitEthernet” part of the message may be falsely included in the syslog template of the protocol messages. However, this would have negligible impact on the final outcome of the grouping result, since the “GigabitEthernet” in this case contains as much information as the syslog sub type and hence there is no need to extract it out.
4.1.2
One to many
Figure 3 shows the generic location hierarchical structure. We classify the basic components here into physical ones and logical ones. The physical ones have a clear hierarchical structure from top to bottom. The arrow here illustrates a “one-to-many” relationship. For example, one router have multiple slots, each slot can have multiple ports and etc. Besides physical hierarchy, there are some logical configurations, but they will eventually map to some physical component. For example, one multilink/bundlelink can be mapped to multiple physical interfaces. Based on router configuration data, we can extract offline the hierarchy in Figure 3 specific to each router, cross-router location relationships such as neighbor links, etc. The key question here is how to automatically exploit such kind of location information from each message. First, we know the particular format of these location information embedded into the messages. For example, the IP address has the format XXX.XXX.XXX.XXX, the port has the format X/X/X , etc. Compared with various parts of message we need to mask during template learning, the number of location format patterns are limited, which is manageable for extraction using predefined patterns. However, the naive pattern matching is not sufficient to extract needed location addresses, mainly because more than one location pattern (no matter whether they are all needed) can be found in each message. For example, multiple IP addresses can be found in one message. One could belong to the router itself, one could belong the neighbor router, and it is also possible there are some remote (e.g. remote session connection) or invalid IPs (e.g. scanning attacks). To understand the exact meaning of multiple location patterns, especially the belongings, we correlate these locations with router configuration data. For example we can verify if this IP belongs to the router or its neighbors. Note that the acquired location information and location hierarchy will be used during the offline rule mining and online grouping.
4.1.3
Learning Temporal Patterns of Templates
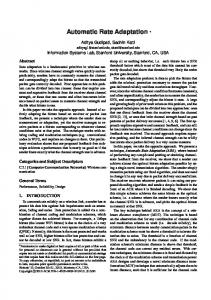
Once we identified the message templates, we learn the temporal patterns of the message templates, i.e, the interarrival patterns. This learned knowledge will be used in the online temporal grouping component. We observe that if a particular template of message occurs periodically, the corresponding messages naturally form a number of clusters in the time series. For example, Figure 4 shows that one controller goes up down many times within a short interval because controller is unstable during the interval. Another example
Location Information Learning
In a typical syslog message, we only have a router id field as the basic location information, but this is clearly not enough. For example, some events occur on a particular physical port while some other events occur on multiple logical links (e.g., IP links). Such detailed location information is essential for understanding what is going on in the network.
477
Event Occurrence
cur frequently together in a dataset and are widely-used for market basket analysis. Following the original definition by Agrawal et al. [3] the problem of association rule mining is defined as: Let I = {i1 , i2 , . . . , in } be a set of n binary attributes called items. Let D = {t1 , t2 , . . . , tm } be a set of transactions called the database. Each transaction in D has a unique transaction ID and contains a subset of the items in I. A rule is defined as an implication of the form X ⇒ Y where X, Y ∈ I and X ∩ Y = ∅. To select interesting rules from the set of all possible rules, constraints on various measures of significance and interest can be used. The bestknown constraints are minimum thresholds on support and confidence. Support supp(X) of an itemset X is defined as the proportion of transactions in the data set which contain the itemset. The confidence of a rule is defined as
00:00
m
01:00
02:00
03:00
04:00
05:00
06:00
Time series (GMT)
event count
Figure 4: Controller up/down example.
00:00
conf (X ⇒ Y ) =
01:00
02:00 03:00 04:00 Time series (GMT)
05:00
In our problem setting, each message template is one item. In order to construct the transactions, we use a sliding window W . It starts with the first message, and slides message by message (sorted messages on the time series). Each time there is one transaction. In one such transaction, the message templates in the window W are considered as the items showing up. Note that we only consider pair wise association, or |X| = |Y | = 1. In other words, each rule only contains two templates. The reason is, first, the computation complexity is low, and second, it is relatively easy to verify the generated rule sets. Domain experts only need to verify the relationship of two templates per rule. The disadvantage of pair wise is that based on these rules we cannot group more than two templates each time, but since we assume the transition property during rule-based grouping discuss later in Section 4.2.2), the final digest will combine multiple templates together. Until now, we assume that the rules are generated based on static dataset. But ideally we want to learn the rules continuously. In order to adaptively adjust the rules, we use the following conservative way. First, we training the a period of data to generate the basic rule sets. Then we keep change the rules periodically (e.g. each week). The new rules X ⇒ Y should be added when supp(X) and conf (X ⇒ Y ) are above the threshold. Old rules X ⇒ Y should be deleted when updated conf (X ⇒ Y ) is below the threshold, no matter what supp(X) is. Such conservative deletion approach ensures that we do not delete the rules because X are not common in this updating period (it is quite possible X become common again soon).
06:00
Figure 5: TCP bad authentication example in Figure 5 shows that TCP bad authentication message has periodic occurrences, likely due to the underling timer configuration, or outside impact, e.g. scanning patterns. In order to learn such temporal patterns, i.e. , the interarrival time within each cluster, we make a basic assumption, that is the impact of current message on the further message with the same template will exponentially decay. Such assumption is widely used for time series analysis and system measurement purpose [5, 21]. Our learning method is based on the interarrival sequence S1 , S2 , . . . for each message template. We compute the (predicted) exponential weighted moving average (EWMA) of interarrival time t, Sˆt . Sˆt = α · St−1 + (1 − α) · Sˆt−1 where α ∈ (0, 1) is the weighting factor. A higher α discounts older observations faster. Intuitively, if the messages belong to the same cluster, in other words, there is a periodic pattern within the group, then the predicted value Sˆt should not be far away from the real one St . Consequently, we assume that if St ≤ β · Sˆt where (β >= 1), which means the real interarrival time is no much larger than predicted one, we view that the message belongs to the same group. Otherwise, there is another new group. Here parameter β defines a threshold for grouping. Larger β means tolerating larger intervals in the group. The offline learning component uses long-term historical data to infer the proper value of parameters α and β and can be updated periodically. The actually values of these parameters will be discussed in Section 5. These parameters are used in the online temporal grouping component.
4.1.4
supp(X ∩ Y ) supp(X)
4.2
Online System Methodologies
The online system takes the real-time Syslog+ data (with message template and location information) and the offline-learned domain knowledge as input, groups related messages together and construct prioritized event. Roughly speaking, if two messages occur close in time and locations, they are related with high probability. While the temporal closeness between two messages can simply the characterized by the closeness of their timestamps, the characterization of spatial closeness is more subtle. We model various location types in the location hierarchy shown in Figure 3. We say the two locations are spatially matched when they can be mapped to same location in the hierarchy. For example, suppose one message happens on slot 2 and another one message on the same router happens on interface series 2/0/0:1. They are considered spatially matched because the later message’s location (2/0/0:1) can be mapped upwards in Figure 3 to slot 2 (the first digit before the backslash interface series of 2/0/0:1).
Template Relationship (Rule) Learning
In order to group different messages together to extract network events, one natural thinking is to discover some implicit rules among different templates. Some rules are very intuitive. For example, layer-1 link failures (LINK-3-UPDOWN) often trigger layer-2 failures (LINEPROTO-5-UPDOWN). Some others are much more subtle. As we explained before, we cannot rely on domain experts to compile and update a complete rule set given the large number of templates. We need a systematic way to identify such rules. This turns out to be a typical association rule mining problem. Association rules describe items that oc-
478
4.2.1
Temporal Grouping
pened on the higher level of the hierarchy is more important. For example, an event happened on the router is more important than the one happened on the interface. Let lm denote the location metric of message m, and we can assume that the value of lm higher level is several (e.g. 10) times of lower level. Finally, we consider the number of messages in the grouped event, which in some sense reflects severity of the event. The group with more messages should be relatively important. Based on these three metrics, there is a score we assign for each event:
Online temporal grouping uses the same methodology as offline temporal patterns learning, presented in Section 4.1.3. Similar to Section 4.1.3 , if the real inter-arrival time St ≤ β·Sˆt , then the messages belong to the same group, otherwise there is separate group. We also introduce two thresholds Smin and Smax . Smin is the minimal interarrival time, and Smax is the maximum. The reason of introducing Smax is that the our algorithm cannot guarantee convergence. Each time we only guarantee that the St is not too large. But when Sˆt increase, St can grow exponentially. If the real interarrival time is smaller than Smin , then we consider the messages belong to the same group. If the real interarrival time is larger than the Smax , then we believe there is a separate group. We set Smin to be 1 second (this is the finest time granularity available in the syslog data we used) and Smax to be 3 hours (this is based on domain knowledge).
4.2.2
Score =
where the event contains M messages. The reason for taking logarithm here is to prevent rare events with tiny fm values from dominating the top of the ranked list. Note that our scoring method provides a baseline for ranking. The network operators can adjust the weights for each type of messages, based on their experience. We rank all events based on the score in a decreasing order. After ranking, we (actually the SyslogDigest system) are ready to present the final result. There are many ways to display the event, and we choose the most concise way. First, we present the beginning and ending time of the event, which map to the time range of all messages in the group. Second, we present the location information of the event. For each router, we present the most common highest level location on hierarchy. For example, if the event contains two messages, one on the router level while the other on the interface level, we only show the router. Third, we present the type of event. One direct way is to present the combinations of message signatures within the group. Domain experts can certainly assign a name for each type of event. For example, we can assign a name "link flap" to a event which contains "LINK-DOWN" and "LINKUP" messages.
Rule based Grouping
5.
Cross Router Grouping
EVALUATION
We evaluate SyslogDigest using real syslog data from two large operational networks. We first validate several design choices we made in the offline domain knowledge learning component. Then we report the results of the entire SyslogDigest system.
The first two grouping methods all focus on a single router. A network event, however, can affect multiple routers. For instance, a link down event should involve two adjacent routers’ links. To group such messages, our solution is a conservative one. Our offline location learning component already provides a dictionary for cross-router location relationship such as links, sessions, tunnels (a path) between different routers. Assuming that the propagation along the connects are fast enough, we group messages with the same template which happened on the same link, session, or path at almost the same time (e.g no larger than 1 second difference). We perform three grouping methods in the order they are described. If any two messages in two different groups have been grouped together, then these two groups will be merged. Thus the changes of orders of these three parts have no impact on the final grouping results. We use this order because it is more natural to describe: from one signature to multiple ones, from single router to multiples ones.
4.2.4
lm /log(fm )
m=1
In the temporal grouping part, we only consider grouping messages with the same template together. Now we try to discover the connections among messages with different message templates. The offline-learned rules using association mining contain pairwise message templates that occur frequently together. The rule based grouping component groups the messages which happen on the spatially matched locations and happen close enough in time (within the window W discussed in rule-learning part). Note that our rule based grouping does not consider the direction of rule since our system is not a troubleshooting system thus does not rely on causality inference. It is possible that we have A → B and A → C in the rule set, but we ignore the direction and can group A, B, C together, assuming temporal and spatial constraints are satisfied. This is because it is very likely they are triggered by the same network condition thus should be considered as one event, even though we ignore the detailed causal relationship among the messages.
4.2.3
M X
5.1
Evaluation Methodology
We use syslog data collected from two large operational IP networks in North America: a tier-1 ISP backbone network and a nation-wide commercial IPTV backbone network. Each of these two networks has around a couple of thousands of routers and records millions of syslog messages per day. We refer to these two syslog data as Dataset A and Dataset B, respectively. Note that these two networks use routers from different vendors and have different network design and protocol configurations for supporting different network applications/services – the ISP backbone network is for general/traditional IP/Internet service and the IPTV backbone is for commercial TV service. Both the types of messages and their signatures are very different in these two dataset. In our evaluation, we use three months of data collected from September to November 2009 for offline domain knowledge learning and two weeks’ of data collected December 1-14, 2009 for online processing and reporting event digests. We evaluate the effectiveness of SyslogDigest in the following two aspects. First, we use the metrics compression ratio to measure the ability of SyslogDigest to reduce the amount of information that operators need to receive and examine in order to know what happened in the network for each incident. We define the the compression ratio to be the number of events (compressed information
Prioritization and Presentation
We now have a number of messages in each group. We first prioritize the messages so that the most important events will appear at the top of the digest. Recall from Section 2 that the severity level of a message provided by syslog shall not be trusted/used. Instead, we use a combination of the following three metrics. The first metric is the occurrence frequency of message signature on each router, say fm for message m. The intuition is that we care more about rare events. We also consider the impact of the events. The event hap-
479
700
Table 5: Sensitivity of minimal support SPmin value Top % (A) 13.4% 27.5% 42.5%
Coverage (A) 98.72% 99.92% 99.98%
Top % (B) 14.2% 32.3% 54.3%
Coverage (B) 89.34% 99.95% 99.99%
size) divided by the total number of raw messages (uncompressed information size). Second, we validate the event digests output by SyslogDigest to see whether they are good representation of real network events. This validation process done manually by people who have rich network experiences and domain knowledge on these two operational networks.
5.2
Suppmin = 0.001 Suppmin = 0.0005 Suppmin = 0.0001
600 The number of rules
SPmin 0.001 0.0005 0.0001
500 400 300 200 100 0.5
0.65
0.7 0.75 Confmin
0.8
0.85
0.9
Figure 6: The impact of parameter SPmin and Confmin , in dataset A. 450
Message Template Identification
Dataset A Dataset B
400 The number of rules
SyslogDigest automatically abstracts the template of each type of syslog messages. We validate our template abstraction method presented in Section 4.1 by comparing the syslog message templates identified by SyslogDigest with the “ground truth” templates obtained from hard-coding comprehensive domain knowledge on syslog. The domain knowledge we used here are very specific to certain router vendors. Hard-coding domain knowledge is clearly not scalable, and hence we use it only for validation purpose. Note that such kind of methods require the knowledge of all message format in advance, which is not practical specially when there are many messages types and facing different syslog data sources. We observe that 94% of message templates matches. It indicates our learning approach can extract the template fairly well.
5.2.2
0.6
Components Effectiveness
We first evaluate our design choices in message template identification, association rule mining and temporal mining components shown in Figure 1.
5.2.1
0.55
350 300 250 200 150 100 50 0
60
120 180 Window size (seconds)
240
300
Figure 7: The impact of parameter W , when Confmin = 0.8 and SPmin = 0.0005.
Association Rule Mining
In order to generated rules, we use three months (Sep 2009 to Nov 2009) for mining for both datasets. There are three parameters used by SyslogDigest in mining association rules between syslog messages: Window size W , the threshold of minimal support SPmin , and the minimal confidence Confmin . We evaluate the sensitivity of these parameter setting on learning associations between syslog message. In particular, we vary W from 5 to 300 seconds and Confmin from 0.5 to 0.9. We also set SPmin at values 0.001, 0.0005, 0.0001. The implication of these settings of SPmin in our context is shown in Table 5. For example, when SPmin = 0.005, the top 27.5% types of messages will be used in rule mining and these types of messages cover over 99.9% of all messages in dataset A. Figure 6 shows the number of association rules learned from dataset with fixing the value of W to be 1 minute and varying the values of SPmin and Confmin . As we expected, the number of rules decreases as the value of Confmin increases. In addition, the higher the value of SPmin is, the fewer rules learned from the dataset. Similar observations hold different values of W . In our experiments, we set Confmin = 0.8 and SPmin = 0.0005. With this setting, Figure 7 shows the number of generated rules by varying the value of W . We observe that the number of rules increases as W increases. However, the increase in the number rules diminishes at W = 120 seconds for dataset A and W = 40 second for dataset B. That is, the number of rules learned by SyslogDigest is less sensitive to the value of W when W is large. A detailed analysis on the rules reveals that the newly added rules by increasing W often captures implicit timing relationship between two types
of messages. For example, in dataset A, we observe that when W changes from 10 to 30 seconds, there are several new rules added to the knowledge base. These rules associate the controller flap, link flap andline protocol flap messages, indicating that these types of messages usually occur together between 10-30 apart. Similarly, in dataset B we find that ftp login failure and ssh login failure messages are associated together when W is set to 30 - 40 seconds. Next, we present results on association rule mining with using W = 120 seconds for dataset A and W = 40 seconds for dataset B. The association rule mining is performed weekly by SyslogDigest to (i) add new rules to the knowledge base, and (ii) identify invalid rules in the knowledge base and remove them using the method presented in Section 4.1.4. Figure 8 and Figure 9 show the total number of rules in the knowledge base as well as added/deleted rules for each week from week 2 to week 12. The number of rules in the knowledge base becomes stable after week 6 for dataset A and after week 8 for dataset B. This is because the number of added and deleted rules are close to zero after few weeks for both datasets. We further validated the rule sets obtained at the end of week 12 with expert domain knowledge and vendor documentations. We found that almost all the rules are consistent with either the domain knowledge or the expected behaviors specified in vendor documentations. Thus, we believe that SyslogDigest successfully captures network behaviors using automatically learned rules. However, we did report a few “unexpected” rules (3 rules for dataset A and 16 rules for dataset B), which means the potential false positive rate
480
0.09
450
0.08
400
0.07
The compress rate
The number of rules
500
350 300 250 200
Total rules Deleted rules Added rules
150 100
Dataset A Dataset B
0.06 0.05 0.04 0.03 0.02 0.01
50 0
0 2
4
6 8 The number of weeks
10
12
0
0.1
0.2
0.3 0.4 Parameter α
0.6
Figure 10: The impact of varying value of α on the compression ratio (β = 2).
Figure 8: The number of rules over 12 weeks, dataset A. 400
0.019
350
Dataset A Dataset B
0.018 300
0.017 The compress rate
The number of rules
0.5
250 200
Total rules Deleted rules Added rules
150 100 50
0.016 0.015 0.014 0.013 0.012 0.011 0.01
0 2
4
6 8 The number of weeks
10
0.009
12
0.008 2
3
4 5 Parameter β
6
7
Figure 9: The number of rules over 12 weeks, dataset B. Figure 11: The impact of varying value of β on the compression ratio (α = 0.05 for dataset A and α = 0.075 for dataset B).
is less than 0.05 during rule mining. These unexpected rules are currently under investigation.
5.2.3
Table 6: Parameter setting in SyslogDigest
Temporal Pattern Mining
Dataset A B
The goal of temporal pattern mining is essentially to find the proper parameter α and β, such that the underlying interarrival model can present the temporal patterns very well. In other words, we want to find α and β such that we can group messages appropriately (i.e. compression ratio would be optimal). Figure 10 shows the compression ratio of temporal grouping with α varying from 0 to 0.6 and β = 2 (i.e., if a new message arrives at an interval that is at least twice of the predicted interval, the message is put in a separate group). We observe that in both datasets, the larger the value of α is the higher the compression ratio is, except for very small value of α (e.g., α < 0.05). The lowest (i.e., best) compression ratio is achieved when α = 0.05 for dataset A and α = 0.075 for dataset B. They will be used as the default value for α in the remaining experiments. Figure 11 shows the impact of varying value of β (from 2 to 7) on the compression ratio with α being set at the default values. We observe that the compression ratio first decreases as we increase the value of β. This is consist to our intuition because a larger β value means larger intervals are used in temporal grouping of messages and hence fewer number of groups are output. We also observe that the improvement of compression diminishes when β increases. Thus, we set β = 5 for both datasets. In summary, Table 6 shows the parameter settings in SyslogDigest. The rules of thumb are of choosing parameters are (1) to ensure the stability of rule sets and (2) to ensure the stability of the
α 0.05 0.075
β 5 5
W (Dataset A/B) 120 40
SPmin 0.0005 0.0005
Confmin 0.8 0.8
compress ratio, as we discussed through Section 5.2. These values in Table 6 will be used in the rest of our experiments presented in this paper.
5.3
Performance of SyslogDigest
Using the domain knowledge base built by applying offline learning on three months of syslog data, we run SyslogDigest in online mode and generate event digests for 2 weeks of syslog data to evaluate the effectiveness of the entire system. Note that it generally takes less than one hour to digest one day’s syslog. Table 7 shows compression ratios of different message grouping methodologies for both datasets. We found that the compression ratio varies by grouping method by dataset. Overall, the number of event digests is over three orders of magnitude smaller than the number of raw syslog messages. This is fairly substantial information compression/reduction. Figure 12 shows the number of events and number of messages per day during these two weeks for dataset A (the numbers are normalized by a fixed factor due to proprietary information). Again, we obverse the three orders of magnitude compression. In addition, the number of events per day is relatively stable across days
481
and dataset B, each of which is associated with a unique case identifier, timestamp of which the ticket is created and/or updated, and type and location of the event. While an extensive and systematic evaluation is undergoing, we show our preliminary results in this paper. In our preliminary evaluation, we rank the tickets based on the number of times a ticket is investigated and the corresponding record is updated. The intuition is that the more times that a ticket is investigated, the more likely the corresponding event is more important (and/or complicated). Hence, we use the number of times a ticket is investigated and updated as an approximation of the important of an event. We select the top 30 tickets regarding dataset B and correlate them with event digests output by SyslogDigest. We say there is match between a trouble ticket and an event digest if (i) the duration of the event digest covers the creation time of the trouble ticket and (ii) the event location of specified in the event digest is consistent with that described in the trouble ticket (at the state level, e.g. TX, GA, etc.). We found that all 30 tickets match with event digests that are ranked as top 5% or even higher by SyslogDigest. This initial evaluation shows that SyslogDigest does not miss important incidents.
Table 7: Effectiveness (compression ratio) of three digest methodologies. T: temporal based, R: rule based, C: cross router Methodology T T+R T+R+C
Ratio (Dataset A) 1.63 × 10⁻² 5.15 × 10⁻³ 3.27 × 10⁻³
Normalized counts (log scale)
1
Ratio (Dataset B) 9.08 × 10⁻³ 2.26 × 10⁻³ 0.91 × 10⁻³
# messages # events # active rules
0.1
0.01
0.001
0.0001 0
2
4
6
8 Days
10
12
14
6.
16
Figure 12: Number of event digests and active rules per day for dataset A. The number of messages/events
1
APPLICATIONS
In this section, we demonstrate that SyslogDigest can be used an essential building block for many critical applications in network operations, such as troubleshooting and network health monitoring and visualization.
6.1
Number of messages Number of events
Complex network troubleshooting
Router syslog is one of the most important data source for network troubleshooting, and SyslogDigest provides network operators the gist of the syslogs – high-level network events. This is very important especially for diagnosing complex events that involve protocol interactions across multiple network layers and locations. We next examine a real-world example on PIM neighbor loss event in the IPTV network – an event that was identified by SyslogDigest and is intriguingly complex. In the commercial IPTV network, live TV streams are delivered using native IP multicast (i.e., PIM in this example). A change or loss of PIM neighbor session (e.g., caused by link failures) can disrupt delivery of IPTV data streams. Hence, there are several mechanisms implemented in the layer 2 and layer 3 network to enhance the service reliability. Particularly, two static layer 2 paths are configured between each pair of routers on the multicast tree – the primary path is the single-hop one directly connecting these two routers and the secondary path is a multi-hop path through routers in different VHOs. When there is a physical link failure on the primary path, the secondary path will be used to deliver IPTV data streams through the MPLS tunnels. The fast re-route (FRR) is done in layer 2 so that layer 3 routing (i.e., OSPF) is oblivious of this fail-over event, avoiding lengthy route-reconvergence impacting the PIM neighbor session. In this design, PIM neighbor session should only be impacted when there are dual failures on both primary path and secondary path. Such dual failures are extremely rare in operational networks. In a troubleshooting task, operators investigated a PIM neighbor session flap event between a pair of nodes in two VHOs. The event was somewhat unexpected because the PIM neighbor session loss appeared to be triggered by a single link failure on the primary path between two routers. In theory, the PIM neighbor session should not be impacted. The event signature output by SyslogDigest revealed that the secondary path had not been set up successfully and was undergoing connection retries every five minutes. Con-
0.1 0.01 0.001 0.0001 1e-05 Router
Figure 13: The digest result per router of dataset A. for both datasets. In addition to the events digest, SyslogDigest also tracks the association rules that are used in message grouping (we call them “active rules”). The number of active rules is also stable: 100 ∼ 200 per day. The observations on dataset B is similar and omitted due to space limit. Figure 13 show normalized number of raw messages and number of events on each individual router for datasets A2 . We observe that the distribution of events across routers are less skew than that of raw syslog messages. In addition, routers that have more syslog messages usually have a better compression ratio. The best compression ratio is achieved on the router which has the largest number of raw message. In order to verify that SyslogDigest system does not miss important network events during extraction, we compare the event digests output by SyslogDigest with known network events obtained from the trouble tickets. We obtained trouble tickets for both dataset A 2 Due to page limitation, very similar result for dataset B is not shown here
482
Figure 14: Visualization based on SyslogDigest output.
Figure 15: Visualization based on raw syslog data.
sequently, the PIM neighbor session was immediately interrupted when the primary path failed. In the event signature, hundreds of syslog messages recorded on a dozen of routers in multiple VHOs are associated to this SyslogDigest event. These syslog messages are of 15 distinct error codes involving 6 network protocols across three network layers. If without SyslogDigest, it would easily take operators hours to manually identify these messages among tens of thousands of syslogs recorded at these routers and close in time to the PIM loss event. As a matter of fact, it is not clear what time duration should the network operators focus on in searching for related syslogs, simply because different protocols operate (or react to network changes) at different time granularities (ranging from subseconds to minutes or longer). In this particular event, the syslog messages that indicates a failure in setting up the secondary path, i.e., the connection retries, are several minutes apart from the link failure. Without knowing the exact protocols and timer involved, it is difficult to find the right time window to focus on – a short window (e.g., ±60 seconds) would risk missing the failure information of the secondary path, while a long window (e.g., ±3600 seconds) would certainly increase the amount of syslogs to be analyzed, slowing down operators’ investigation. By contrast, SyslogDigest was able to uncover the complete stream of this complex event. This is because SyslogDigest “learns” both the types and the co-occurrence time patterns of related syslog messages, and consequently associate such syslogs together when they do co-occur. Furthermore, even with other automated troubleshooting systems (e.g., [8]) in place, working with pre-processed high-level events can greatly improve the efficiency compared to working with large numbers of raw syslog events.
more events (or messages) observed. We observe that only a small number of events took place in the network then, while the corresponding syslog messages range from dozens to a couple of hundreds on each of these routers. Making sense of the raw syslogs visualization requires decoding plenty of supplement information (e.g., the pie chart shown in Figure 15 reporting the mixture of syslog types and counts for all events on the router). It is worth noting that high syslog message counts do not necessarily imply more network events or “bigger trouble” – the big circle in Figure 15 was one moderate level event compare to others in Figure 14. Visualization the raw syslog messages can potentially mislead operators to focus on routers with more messages and delay their investigation on more sever issues.
6.2
7.
RELATED WORK
Commercial softwares, like NetCool [2] Lonix [1], that are capable of parsing and making log data. These tools, however, require intensive domain knowledge to describe the format of logs. Xu et al. propose a general methodology to mine the console logs and to automatically detect system running time problem [19]. But they assume that they have the access to source code which generate the logs. It is not a practical assumption in the environment of router syslogs. Troubleshooting network problems is one of the most important management tasks. Many approaches have been proposed recent years [12, 11, 17, 7, 14, 13, 10]. The general idea is to apply advanced statistical methodologies to multiple raw data sources. Our system is not specifically designed for troubleshooting, but as illustrated in Section 6, it can benefit complex troubleshooting task significantly. Rule learning has been widely applied in acquiring insight on different network problems. Kandula et al. [9] mine the rules in edge networks based on the network traffic data. Brauckhoff et al. [4] use association rule mining techniques to extract anomaly in backbone network. Their data sources, detailed mining methodologies and utilities of final mining results are different from our system. Yamanishi et al. [20] provides a dynamic syslog mining technique on server syslogs. They focus on generating predicative alarm for system failures. Our goal is more broad – to represent the network events. Moreover, their syslog data are essentially logs on the end host devices, rather than router syslogs. The idea of extracting high level information from raw data has been used in network traffic analysis. A few tools aggregate traffic volumes and visualize the resulting aggregates. For example, FlowScan [16] analyzes and reports on Internet Protocol (IP) flow
Network health monitoring and visualization
It is imperative for network operators to keep track of “what happened in my network?". Visualization is often an effective way to achieve this as operators are able to “see” what happened in the network and how things evolve over time. The digest events from SyslogDigest can greatly improve network health visualization. Figures 14 and 15 show the snapshots of network status map at 2009/12/5 16:00:00 (in 10 minute updating window) using SyslogDigest and using raw syslog messages, respectively. Network topology and link load status are removed from the graph to protect proprietary information. The circles in the map indicate events (or messages) observed at these routers with larger circles indicating
483
data exported by routers, based on the application, the IP prefix, or the AS identifier. eXpose [9] identifies temporally correlated clusters of flows. NICE [14] is a correlation tool focusing on the chronic network conditions. In comparison, our system is the first one used for extracting network events from logs.
8.
[9] Srikanth Kandula, Ranveer Chandra, and Dina Katabi. What’s going on? learning communication rules in edge networks. In Proc. ACM SIGCOMM, 2008. [10] Srikanth Kandula, Ratul Mahajan, Patrick Verkaik, Sharad Agarwal, Jitendra Padhye, and Paramvir Bahl. Detailed diagnosis in enterprise networks. In Proc. ACM SIGCOMM, 2009. [11] R. R. Kompella, J. Yates, A. Greenberg, and A. C. Snoeren. Detection and localization of network blackholes. In Proc. INFOCOM, 2007. [12] Anukool Lakhina, Mark Crovella, and Christophe Diot. Mining anomalies using traffic feature distributions. In SIGCOMM ’05: Proceedings of the 2005 conference on Applications, technologies, architectures, and protocols for computer communications, pages 217–228, New York, NY, USA, 2005. ACM. [13] A. Mahimkar, Z. Ge, , A. Shaikh, J. Wang J. Yates, Y. Zhang, , and Q. Zhao. Towards automated performance diagnosis in a large iptv network. In Proc. ACM SIGCOMM, 2009. [14] A. Mahimkar, J. Yates, Y. Zhang, A. Shaikh, J. Wang, Z. Ge, and C. T. Ee. Troubleshooting chronic conditions in large ip networks. In Proc. ACM CoNEXT, 2008. [15] Ajay Mahimkar, Han Hee Song, Zihui Ge, Aman Shaikh, Jia Wang, Jennifer Yates, Yin Zhang, and Joanne Emmons. Detecting the performance impact of upgrades in large operational networks. In Proc. ACM SIGCOMM, 2010. [16] Dave Plonka. Flowscan: A network traffic flow reporting and visualization tool. In Proc. USENIX System Admin. Conf.,, 2000. [17] M. Tariq, A. Zeitoun, V. Valancius, N. Feamster, and M. Ammar. Answering what-if deployment and configuration questions with wise. In Proc. SIGCOM, 2008. [18] Yinglian Xie, Fang Yu, Kannan Achan, Rina Panigrahy, Geoff Hulten, and Ivan Osipkov. Spamming botnets: Signatures and characteristics. In Proc. ACM SIGCOMM, 2008. [19] Wei Xu, Ling Huang, Armando Fox, David Patterson, and Michael I. Jordan. Detecting large-scale system problems by mining console logs. In SOSP ’09: Proceedings of the ACM SIGOPS 22nd symposium on Operating systems principles, pages 117–132, New York, NY, USA, 2009. ACM. [20] Kenji Yamanishi and Yuko Maruyama. Dynamic syslog mining for network failure monitoring. In Proc. ACM KDD, August 2005. [21] Nong Ye, S. Vilbert, and Qiang Chen. Computer intrusion detection through EWMA for autocorrelated and uncorrelated data. In IEEE transactions on reliability, October 2003.
CONCLUSION
In this paper, we develop a system called SyslogDigest that groups massive volume of syslog messages into small number of meaningful network events using data mining techniques. SyslogDigest systematically identifies signatures of syslog messages, learns association rules that capture network behaviors over time, groups related raw syslog messages across multiple routers into network events, and labels and prioritizes network events appropriately. We evaluated SyslogDigest using real syslog data collected from two large operational networks and demonstrated how SyslogDigest can be applied on complex network troubleshooting and network health monitoring and visualization. Though we focused on syslog data in this paper, our techniques can also be applied on other network data. We believe SyslogDigest will be an essential building block for many network management tools. Applying SyslogDigest on other network data and integrating it into various network management tools are among our future work.
9.
REFERENCES
[1] Emc lonix website. http://www.emc.com/ products/family/ionix-family.htm. [2] Ibm netcool website. http://www-01.ibm.com/ software/tivoli/welcome/netcool. [3] Rakesh Agrawal, Tomasz Imielinski, and Arun Swami. Mining association rules between sets of items in large databases. In Proc. ACM SIGMOD, 1993. [4] Daniela Brauckhoff, Xenofontas Dimitropoulos, Arno Wagner, and Kavè Salamatian. Anomaly extraction in backbone networks using association rules. In Proc. ACM IMC, 2009. [5] Peter J. Brockwell and Richard A. Davis. Introduction to Time Series and Forecasting. Springer, 2002. [6] R. Gerhards and Adiscon GmbH. The Syslog Protocol. In IETF RFC, 2009. [7] Yiyi Huang, Nick Feamster, Anukool Lakhina, and Jim (Jun) Xu. Diagnosing network disruptions with network-wide analysis. SIGMETRICS Perform. Eval. Rev., 35(1):61–72, 2007. [8] Charles R. Kalmaneka, Zihui Ge, Seungjoon Lee, Carsten Lund, Dan Pei, Joseph Seidel, Jacobus Van der Merwe, and Jennifer Yates. Darkstar: Using exploratory data mining to raise the bar on network reliability and performance. In Proc. the 7th international workshop on Design of Reliable Communication Networks (DRCN), October 2009.
484