Aug 28, 2001 ... INTRODUCTION TO MATHCAD. Basic Concepts. INTRODUCTION: This is the
first in a series of handouts that present a self-paced.
8/28/01 3:47 PM
INTRODUCTION TO MATHCAD Basic Concepts INTRODUCTION: This is the first in a series of handouts that present a self-paced tutorial introduction to Mathcad. The earlier part of the tutorial is highly directed, giving keystroke-level instructions. The tutorial soon moves on to more advanced topics, and offers less keystroke instruction. Students are expected to master the earlier skills before proceeding to subsequent lessons. The lessons give introduction to a variety of ways of entering information into Mathcad. Students are shown how to use some keyboard shortcuts, or how to select commands from the various menus. A successful Mathcad user will understand the philosophy of the Mathcad approach to data reduction and problem solution. The less successful will memorize keystrokes and mouse clicks. Try to remember concepts and methods, rather than just using the same method for everything. And remember to access the “help” facilities for supportive information. Keystrokes that are to be typed are shown in this font. These keystrokes should be typed exactly as shown, including any punctuation. Mathcad often uses punctuation to control how it understands typing. Mouse and menu commands are shown in this font .
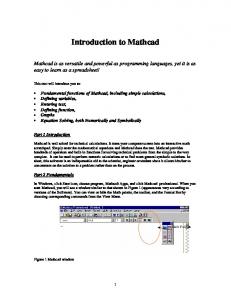
GETTING STARTED: Your instructor will give you the necessary information for logging on to the Cadig network and launching the Mathcad program. When Mathcad is running you will see a worksheet (the large white area). Consistent with many Windows applications, there are also toolbars, action buttons and drop-down menus. Many of the items in the tool-bar and menus are self-explanatory, but many perform special operations peculiar to Mathcad. You will gain experience with their use and these lessons will introduce the more common and important ones to you.
HELP: Let’s investigate some of the help facilities. First, find the yellow “?” button near the top-right of the Mathcad window. Click the “?” button to launch the main help facility Click the “Index” tab In the “keyword” box, type in the words text box. The list of topics jumps to an entry about text boxes. Click the “Display” button and read the help information that appears in the right panel. TEXT BOX: Go back to your Mathcad worksheet and click the mouse somewhere (anywhere) on the white worksheet. Then follow the help instructions you just read to create a text box with your name in it.
1
8/28/01 3:47 PM
Insert, Text Region – then type in your name Follow the instructions in the help panel to stop entering data into the text box. Now click somewhere else on the worksheet. Now try typing the following directly onto the worksheet. When you have done typing, click somewhere else on the worksheet. “Mathcad Tutorial Note that Mathcad understands the “ to mean “open a text box”. This is a shortcut key, and one you will find very useful. You have probably noticed that when you click on the worksheet you get a red cross (or plus). This marks the position where commands, graphics or whatever will be placed in Mathcad. Try entering different text boxes at different places on the worksheet.
EDITING AND MOVING BOXES: Often you will want to move a box to somewhere else on the worksheet. Let’s move the textbox with your name. First click somewhere in the text box that you want to move. A black border (and other stuff) appears around the box. We call this box a region. Move the mouse around the edge of the region until the cursor turns into a black hand. Now you can click and drag the box to wherever you want it. You use the same procedure to move any region, including the complex equations and graphics you will soon be putting on your worksheet. Now try editing your name. Click somewhere in the text you want to edit. You will see a vertical red bar. This is your cursor. Later, when you edit equations, you will get a blue vertical line. Both lines show where you will make changes. Type in extra characters, and they appear at the red line. Try using the keyboard cursor keys to move the red line. Try using the mouse to position it somewhere else in the text. Use Delete and Backspace to remove characters. What happens if you delete all of the text from the box? Here’s a quick way to get rid of an entire region. Click the mouse somewhere close to, but outside, the region. Click and Drag the mouse over the region to make the black border appear. Now press D on the keyboard and the region is deleted.
2
8/28/01 3:47 PM
Use the skills you have developed to clean up your worksheet. Make your worksheet have one text box at the top-left of the first page. This single box should have two lines of text. The first line should be your name. The second line should be your course number, section number and date. Save your worksheet to the Cadig network (Drive N:). Give your file the name Mcad_Basic_01
MORE ABOUT REGIONS: We have introduced the concept of “regions”. A region is where Mathcad blocks-out space on the worksheet. You can see the regions by using the drop-down main menu. View, Regions All this menu item does is make the worksheet background gray, and leaves the regions white. (There is also a slightly different format to the way equations are shown, but that doesn’t make any difference in how Mathcad works.) Repeat the View, Regions to toggle the region display on and off. If you highlight a region by clicking & dragging the mouse over it, you can move the region, or change its size if it is a graph, and many other things that it is best to practice on your own. CALCULATOR & IMMEDIATE MODE: You can use Mathcad as a calculator. Click somewhere on a blank part of your worksheet and type: 20*3.3+13/8= After you press the '=' key the result (67.625) is presented to the right of the '=' sign. Notice that Mathcad understands the keyboard commands ‘*’ to mean multiplication and the ‘/’ to mean division; however, it writes these operations with more common algebraic symbols on the worksheet. Try typing in different calculations. Try editing the equations. If you “get lost” and can’t get Mathcad to edit things just the way you want, just delete the entire region and start over. This is a good “trick” to use. Notice that Mathcad does not calculate new values until you click a blank area of the worksheet. If you want to leave the ‘editing cursor’ inside a region, and force Mathcad to recalculate without moving the mouse, press the key. This is a useful trick for doing manual iteration calculations. PALETTES: There are several “palettes” you can use to speed up using Mathcad. These palettes are small windows with several functions on each. Look at the action buttons just above the main worksheet. One of them looks like a little blue calculator.
3
8/28/01 3:47 PM
Click the calculator several times . You should see the calculator palette (a separate window) flashing on and off as you click the button. There are about 9 palettes. Open and close each one to get an idea of the things they contain. You will use these palettes as a major way of entering commands and symbols into Mathcad. Click and drag the open palettes to somewhere on the screen where they do not get in your way. You only need to open those you want to use. Make sure the ' calculator palette' is visible. Use it to enter some additional calculations. Notice that every time you insert an arithmetic operator (*, /, +, -, etc.), a small solid black box appears on the worksheet. This box is called a “placeholder”. It is important to recognize the importance of placeholders when you edit equations later in this lesson. For now, the placeholder indicates where the next number you enter will be placed in the arithmetic operations. Click on a blank part of your worksheet and enter the following (use the calculator palette): 4*9= Notice that the answer is “6”. Why? Shouldn’t it be 2×9=18? Click on another blank part of your worksheet and enter the following, where → means use the keyboard right-cursor key: 4 → *9 = This time you get 18 ! What was the difference? REPEAT these two examples, going very slowly, and watching how the cursor and blue lines change on the screen between every palette selection or keystroke. In place of using the → key, you could also have used a space between the 4 and *. THE SUBTLE DIFFERENCE BETWEEN HOW YOU ENTER THE PREVIOUS EXAMPLES IS AN IMPORTANT LESSON. Learn it!
FORMATTING NUMBERS: There are several ways we can change the format and display of numbers. In this tutorial we will examine two methods. When Mathcad prints numeric results, it doesn’t use very many significant figures. Especially for statistics, you will probably need to change this. Go to a blank area of the worksheet, and enter (use the calculator palette): π /10= You should get the result ‘0.314’. Single-click the region and make sure the region has the black highlight around it. Go up to the main menu bar and select Format, Result…. .
4
8/28/01 3:47 PM
You get a new window where you can control the format of your results. Select the decimal format, with 6 decimal places. Make sure your result shows 0.314159. In the previous format control window, there was an option to “Show trailing zeros.” What do you think it does? Why/where do you think you might need it? Now let’s brighten up your worksheet! Use your mouse to right-click on the 0.314159 answer. You get a pop-up menu. Select Properties. Try selecting the Highlight Region, and Show Border. Click OK and look at the result. You region should now be colored, and have a black border. You can highlight regions in this way to identify where you worksheet produces its final output (results). DEFINING VARIABLES AND EQUATIONS: Using Mathcad like a calculator can be useful, but it isn’t very efficient when it comes to solving repetitive calculations or doing complex data reduction. The way we improve the functionality of Mathcad is to assign number to variables. We then use the variable names in place of the numbers. Variable names are CASE SENSITIVE. This means that variables DIA, dia and Dia all refer to different variables. Variable names can include numbers, the underscore _, the prime ' and the percent %; however, names cannot begin with these characters. Names are assigned to scalars, vectors, matrices and functions. At this point in the tutorial we will work only with scalars. The simplest equation is one that assigns a specific value to a name. Assume that you want to use a variable called 'acc' for acceleration and you want to assign the value of 32.2 ft/sec2 to 'acc'. Type: acc:32.2 The colon is the second of several “Mathcad equals” functions you will come across. Mathcad does not just show a colon on the worksheet. It shows it as := but you just type a single colon. Here’s what the Mathcad equals signs you have come across so far mean: = :
Shows as = and means, “calculate everything on the left of the = sign, and show me the result.” Shows as := and means, “make the variable to the left of the := sign take the number (or formula) entered to the right of the := sign. In other words, “assign the information on the right of the sign to the variable on the left.”
Let’s try an example. The equation for distance traveled by an object over a period of time from an initial position Y relative to a reference origin with an initial velocity of zero
5
8/28/01 3:47 PM
and acceleration is: (Caution: Lower case y and upper case Y are different symbols and have different meanings.) y = Y + (acceleration x time2) / 2 Here’s how you can type this into Mathcad as an equation. Note the effect of the 'space' between the '2' and the ‘*’. Try it with and without the space and look at the difference. y:Y+1/2 *acc*t^2 But you get errors! The result on your worksheet should include (sequential) red highlights of the 'Y' and the 't', but no such highlight of the 'acc'. Any time you define an equation for which the named variables or constants have not been defined earlier, this red highlight will mark the undefined variable or constant. (Recall that you defined the acceleration, acc, to be 32.2 earlier, so it is not highlighted in red.) Now move the cursor ABOVE the expression that defines y, and define Y to be 100 and t to be 1.5, by typing: Y:100 t:1.5 Now see the result for y, for these conditions, by typing y= below the expression for y. Mathcad returns the result '136.225’. What happens if you type the y= above the expression for y? Try it! THIS IS AN IMPORTANT LESSON Mathcad works “left-to-right, top-to-bottom,” the same way you read a book. ALL VARIABLES MUST BE ASSIGNED BEFORE THE EXPRESSION THAT IS BEING EVALUATED. Once a variable is defined, it can be used anywhere later in the worksheet. You cannot “unassign” a variable. Move the y= output region down your worksheet so that there is some white space between the equation and the result. Make sure you worksheet is calculating the value of y correctly (136.225). Click on a blank area of the worksheet BELOW the y= region, and enter acc:-32.2 (i.e. make the acceleration negative). Notice the result for y does not change. Move the new acc:-32.2 region above the equation (but below the acc:32.2 region). The solution for y should now be 63.775. (Remember to click a blank area, or press to recalculate.)
6
8/28/01 3:47 PM
What happens if you move the acc:-32.2 region between the equation and y= region? Why? Make sure your worksheet is using the negative value for acceleration (delete the region that assigns the positive value to acc), move the regions around to make your work give the correct answer for y (63.775) and make your work look presentable. Save your work to the Cadig network using file name Mcad_Basic_02.
RANGE VARIABLES: You have found the result for values of acc=-32.2, Y=100 and t=1.5, and can edit these assignments to make Mathcad automatically calculate the answer for the new values. This is a powerful tool if you want to do a complicated calculation and only change one variable a couple of times. Here is a method you can use to automatically calculate the result for position, y, at a large number of values for the time, t. Instead of assigning a single numeric value to variable t, we set t as a "range variable”. This assigns lots of values to the single variable, t. Delete the t:1.5 region from your worksheet. Replace it with: t:1;10 And then type (to the right, and/or below the new assignment): t= Mathcad shows that t is now a column of values from 1 to 10. This is known as a range variable. We do not have to use integer intervals for the range variables. Suppose you want the first time to be 2 seconds, with an increment of 0.5 and a highest value of 6 seconds. You define the range variable by entering it in the format: first,second;last Try it. Edit the region so that the worksheet looks like: t:=2,2.5;6 (Remember, you do not enter the ‘=’, Mathcad looks after that!) Check that your column shows the numbers 2, 2.5, 3, 3.5, up to 6. Range variables are not restricted to positive numbers, and the range variable may be decreasing in value rather than increasing. Define some range variables that decrease in value from the first to the last element and include some variables with negative as well as positive numbers. NOTE: In Mathcad, range variables are distinct and different from vectors. Vectors and matrices will be considered later in the tutorial.
7
8/28/01 3:47 PM
DEFINING FUNCTIONS: Mathcad has many built-in functions, and you know how to access some of them using the palettes. In the last section, you created a “user function” that enabled you to calculate a distance, y, for a range of times. Let us now see how we can extend the idea (and usefulness) of creating our own functions. START A NEW WORKSHEET by opening file Mcad_Basic_02, and immediately save it with another file name, Mcad_Basic_03. Delete the region that has t:1.5. You should now have the acceleration and range Y defined, but not the time. Let’s now edit the equation so that we can use it for any time. Edit the distance equation simply by changing, y to y(t). The worksheet should look like this: y ( t) := Y +
1 2
⋅ acc⋅ t
2
Now when you type y= you get an error message. This is because you told Mathcad that “y is a function of t”, but you did not give it a value for t. Compare this to the built in function log(). You can’t evaluate a logarithm until you tell the function what value to evaluate it for! The same applies to your own y(t) function. You have to tell it what value of t to use. Type: y(2)= and you should obtain ‘y=35.6’ in your worksheet (assuming Y = 100 and acc = -32.2) Now create a range variable for t and evaluate y(t). For example, define 't' by typing (above the distance equation) t:0,0.5;2.5 Mathcad updates your evaluation for y(t) with a column table of results beginning with 100 for t=0 and ending, with -0.625 for t=2.5 (after you type ‘y(t)=’ if you haven’t already typed it) PLOTTING: Mathcad has a powerful plotting capability. Let’s create a plot of y(t) vs. t. To do this, we need a plot with position y(t) as the ordinate (vertical axis) and t as the abscissa (horizontal axis). Begin by opening the Graphics Palette. Click somewhere blank on your worksheet (below the y(t): function definition) and select the X-Y plot from the Graphics Palette. You get something that looks like this:
8
8/28/01 3:47 PM
This is a blank graph, where the little solid boxes are placeholders (Did you remember their name?) waiting for you to define the axes. In the placeholder for the abscissa, type t. Next, click on the placeholder to the left of the ordinate, and type y(t). When you click outside of the X-Y plot window, Mathcad draws the graph. Editing plots. Double clicking on the area within the X-Y plot opens a set of editing windows that allow you to title the graph as well as change the color or appearance of the line(s) plotted by Mathcad. Go to the Traces tab, Hide Arguments, but do not Hide Legend. Change the Line to become dash ed. Click the Labels tab. Enter a Title of Range Data and Show Title above. Enter an X-Axis label of Time (secs) and a Y-Axis label of Range (ft). Click OK and then click on a blank area of the worksheet. Your final graph should look something like: Range Data
Range (ft)
100 50 0
50
0
1 2 Time (secs)
3
trace 1
Size matters! The default size of Mathcad graphs is far too small for your reports. You resize the graph by clicking once on the graph. This highlights the region and puts “handles” (black rectangles) on the enclosing frame. Move the mouse down to the lower right corner of the region. The mouse becomes a double-headed arrow. Drag this arrow to enlarge or shrink the region for the graphics window. Save your work. The file should still be called Mcad_Basic_03 9
8/28/01 3:47 PM
PRINTING: You probably noticed that the worksheet has a gray vertical line that runs from top to bottom, and a horizontal dashed line that runs across the entire width. These lines indicate page breaks when you print. You can control the layout and formatting in a number of ways. Portrait or Landscape? Select main menu item File, Page Setup … In the “Orientation” frame, select the page layout you want. Landscape can be useful if you have wide equations. Portrait is more useful if you have long columns and/or short equations. For this course, portrait is to be used unless you have a specific and strong need to use landscape. Making enclosures. Most often you will want to format your Mathcad worksheets as enclosures to be added to your main report. SECNAVINST 5216.5D requires enclosures to have the phrase “Enclosure (1)” at the lower right corner of the first page of the enclosure (and also optionally on every page). For multi-page enclosures, pages must be numbered, but only from the second page onwards. Let’s get your worksheet into the correct format. Select menu item
Format, Headers/Footer….
This opens up a window where you can specify headers (that go at the top of each page) and footers (that go at the bottom of each page). In the “Options” part of the window, make sure there is a cross in the selection box Different header and footer on first page. Now click the Footer – Page 1 tab. In the Right panel, type in Enclosure (1). Now click the Footer tab – this is the footer for every page except page 1 - and then click in the Right panel. Look at the Tools frame, and find the button that has the symbol # on it. Let your mouse stand still over this button and the pop-up help will tell you that this button will “Insert Page Number”. Click the # button and see what gets put in the right panel. Finally, click OK and your worksheet is correctly formatted as an enclosure. Use the skills you have developed to clean up your worksheet. Make sure your worksheet has one text box at the top-left of the first page. This single box should have two lines of text. The first line should be your name. The second line should be your course number, section number and date. Move the equations and graphs into an arrangement that looks acceptable and presentable. Keep everything on the first page.
10
8/28/01 3:47 PM
Single-click on the graph region. Use the menus to Copy the region to the Windows clipboard. Move down to the second page, and paste in the region (graph). This makes a copy of the graph. Also on the second page, add a text box that says something profound! Save your worksheet to the Cadig network (Drive N:), using the same file name you are currently using, Mcad_Basic_03 Finally, print your worksheet to the printer in the computer classroom. Make sure both pages print, and the footers are correctly formatted as enclosures.
Delete EVERYTHING from this worksheet except the text box at the top of the first page. Save the worksheet to a new file. Call it Mcad_Encl_Template When you start work for a laboratory report or the project, rather than starting with a “blank” screen, you can open this worksheet. That way, your new work will automatically be correctly formatted as an enclosure. You just need to change the footer for page 1 to have the correct enclosure number. Don’t forget to save your new work to a new file, otherwise you will over-write the template. Start a new (blank) worksheet in preparation for the next part of this tutorial. Do this by opening file Mcad_Encl_Template and immediately saving it as Mcad_Basic_04
DEFINING VECTORS AND MATRICES: Vectors and matrices are defined by typing in a variable name, followed by the : assignment command. You then tell Mathcad the size of the matrix. You do this by opening the Vector and Matrix palette. Click the topleft button in the Matrix palette (the matrix icon) and use the new window to set the size of the matrix. Matrices with one column (column vector) or one row (row vector) are vectors. However, many Mathcad vector functions will only work if you have your data in a single column (a column vector). ur ur Let’s try entering two 3-element space vectors, A = (3iˆ+ 4 jˆ + 6kˆ) and B = (10iˆ + 5jˆ + 8kˆ) . Type
11
8/28/01 3:47 PM
A: Then use the matrix icon on the Matrix palette to specify a matrix of 1 row and 3 columns. You will get an empty three-element ‘1 x 3’ matrix (row vector), with placeholders where you will enter the data. Type the ‘i’ quantity (3) into the first placeholder, the ‘j’ quantity (4) into the second placeholder, and the ‘k’ quantity (6) in to the third placeholder. Either use mouse clicks or the TAB key to move from one placeholder to the next. Define the second vector, B, in the same way. Try calculating the vector scalar (dot) product of vectors A and B. Use the matrix palette to select the Dot Product command. Remember; let your mouse stay still over an icon and after a short while you will get a pop-up help that tells you what the icon does. A.B= Note that Mathcad cannot calculate the dot product, and you get an error. This is because you are attempting to perform a vector operation on a row vector. We can convert a row vector into a column vector by transposing it. This is one of the Matrix palette options. Click in an area above the dot product calculation, and transpose both the A and B vectors. A:AT and B:BT The scalar product will now be calculated and you should get the result of '98'. Of course, rather than transposing the vectors you could have defined A and B to be ‘3 x 1’ column vectors when you created the original matrices! Now that you have ur defined ur A and B as column vectors, find their vector (cross) product. You should obtain A × B = (2iˆ + 36jˆ − 25kˆ) . We will look at more matrix operations later. Let’s not forget that the EM375 Experimentation course needs you to do a lot of statistical calculations. Therefore, before we leave this first tutorial, let’s look at a couple of statistics formulae.
MEAN, VARIANCE AND STANDARD DEVIATIONS: To find the mean and variance of a set of numbers, enter them into a Mathcad worksheet as a vector. Some of the statistics operations can operate on rows, and some can’t. But they can all operate on columns. For some data sets, it is probably best to enter the data in a single row vector, and then transpose it (just like in the previous section of this tutorial). For other data sets you may want to enter column vectors directly. The choice is up to you, but your over-riding consideration should be to make the worksheet look as presentable and as easy to follow as possible.
12
8/28/01 3:47 PM
The built-in Mathcad functions that evaluate mean, standard deviation (sample and population) and variance (sample and population) are (in order): mean(x)
Stdev(x)
stdev(x)
Var(x)
var(x)
WARNING: These functions are case sensitive. Stdev and stdev are different functions. Create a blank 10-element vector using variable name ‘x’ and the Matrix palette. Enter the following numbers: 12, 14, 19, 8, 32, 11, 32, 15, 13, 20 Make sure you have the data in a column, and check that you can calculate the following: mean(x) = 17.6 Stdev(x) = 8.369 stdev(x) = 7.94 Var(x) = 70.044 var(x) = 63.04 What do you get if you calculate stdev ( x ) 2 − var( x )= ? And what do you get if you calculate stdev ( x ) − var( x )= ? Why the difference? Save the worksheet to the current file Mcad_Basic_04 Close Mathcad, then continue with this tutorial.
PUTTING MATHCAD INTO MICROSOFT WORD: Often you will need to combine the output from Mathcad with a report typed in a word processor. The following instructions give you one way of putting Mathcad into Word 2000. Similar instructions probably work for other word processors, and there are LOTS of ways of achieving the same results. But for now, let’s just take things one step at a time. Make sure you have Word open with a blank document. Also, start Mathcad and open a blank worksheet. In Mathcad, create the following equation and plot it using the default x-axis range: y ( x ) = 1.5 x 3 − 15 x 2 + 2 y(x):1.5*x^3→ -15*x^2→+2
13
8/28/01 3:47 PM
2
2000 0
y ( x) 2000 3
− 2.998×10 4000
10
0
10
− 10
x
10
Make sure you have clicked a blank area of your worksheet. Then look at the main menu, and select Edit, Select All. Dashed lines appear round the regions (including both the equation and the graph). Now Edit, Copy. This copies the selected regions into the Windows clipboard. Move to your blank Word document and Edit, Paste. You are done. Your Mathcad work is now in your Word document! What if you don’t want the entire worksheet in your report (you will rarely want it all)? There are several ways of selecting just a few regions. One common operation is to select (for example) just the graph. Unfortunately, if you click a region (especially a graph) and select “Copy” you also copy the axis controls, and sometimes other “stuff” as well. When you paste it into Word, the result can look messy, like this:
2
2000 0
y ( x) 2000 3
− 2.998×10 4000
10
0
10
− 10
x
10
But you usually want the graph to look like the “final product”. Try this. Click somewhere blank on the Mathcad worksheet. This time, press and hold down the key and then click the graph. Now Copy it and Paste it into Word. The result is much better:
14
8/28/01 3:47 PM
2000 0 y ( x) 2000
4000
10
0
10
x
But do remember. In this quick example we didn’t set the axis labels, Arguments, Legends, line style, or even get the graph to be bigger. For your submitted work, you should get the graph to look as professional as possible before copying it into your Word report! Save your work Mathcad work to file name Mcad_Basic_05 You do not have to save your Word document.
SUBMIT to your instructor: Submit the two pages you printed out and saved as file Mcad_Basic_03. These pages are printed directly from Mathcad (i.e. not from Word) and are in full Enclosure format. Close Mathcad. This introduction to basic concepts is finished!
15


![[PDF] Download Introduction to Mathcad 15 (3rd Edition) Top Ebook](https://m.moam.info/img/260x300/pdf-download-introduction-to-mathcad-15-3rd-editio_647719d4097c4737708b53f9.jpg)


![[PDF] Introduction to Mathcad 15 (3rd Edition) Read ... - Google Sites](https://m.moam.info/img/260x300/pdf-introduction-to-mathcad-15-3rd-edition-read-go_6476f720097c474d228b52e8.jpg)

![[PDF] Introduction to Mathcad 15 (3rd Edition) Read ... - Google Sites](https://m.moam.info/img/260x300/pdf-introduction-to-mathcad-15-3rd-edition-read-go_647787b1097c474d228c24a6.jpg)
![[PDF] Download Introduction to Mathcad 15 (3rd Edition ... - Google Sites](https://m.moam.info/img/260x300/pdf-download-introduction-to-mathcad-15-3rd-editio_6477135b097c4786708b45ba.jpg)


