which uses oriented kernels for inferring saliency as it relates to ...... She established her research laboratory in 1988 to study breast cancer and ionizing ...
IEEE TRANSACTIONS ON IMAGE PROCESSING, VOL. 16, NO. 3, MARCH 2007
615
Iterative Voting for Inference of Structural Saliency and Characterization of Subcellular Events Bahram Parvin, Senior Member, IEEE, Qing Yang, Member, IEEE, Ju Han, Member, IEEE, Hang Chang, Bjorn Rydberg, and Mary Helen Barcellos-Hoff
Abstract—Saliency is an important perceptual cue that occurs at different levels of resolution. Important attributes of saliency are symmetry, continuity, and closure. Detection of these attributes is often hindered by noise, variation in scale, and incomplete information. This paper introduces the iterative voting method, which uses oriented kernels for inferring saliency as it relates to symmetry. A unique aspect of the technique is the kernel topography, which is refined and reoriented iteratively. The technique can cluster and group nonconvex perceptual circular symmetries along the radial line of an object’s shape. It has an excellent noise immunity and is shown to be tolerant to perturbation in scale. The application of this technique to images obtained through various modes of microscopy is demonstrated. Furthermore, as a case example, the method has been applied to quantify kinetics of nuclear foci formation that are formed by phosphorylation of histone H2AX following ionizing radiation. Iterative voting has been implemented in both 2-D and 3-D for multi image analysis. Index Terms—Foci detection, geometric voting, iterative voting, segmentation, subcellular localization.
I. INTRODUCTION HE response of tissues and biological material to exogenous stimuli, such as ionizing radiation, is often heterogeneous and requires a large amount of data for detailed characterization. These responses, which are often multidimensional in space and time, and can be imaged using digital microscopy. Quantitative analysis of these multispectral images is a necessary step toward the construction of predictive models. Research in this area has leveraged machine learning techniques using a texture field that is based on patterns of protein localization [11] and variational methods for segmentation of subcellular compartments [8], [12], [14], [23]. Nuclear segmentation often provides context for quantifying protein localizations that are either nuclear-bound or near nuclear membranes. These protein com-
T
Manuscript received May 12, 2006; revised September 19, 2006. The Research was supported in part by the National Aeronautics and Space Administration under Grant T6275W, in part by the NASA Specialized Center for Research in Radiation Health Effects, and in part by the low dose radiation research program and medical imaging program at the Office of Biological Effects Research U.S. Department of Energy under Grant DE-FG03-01ER63240. The associate editor coordinating the review of this manuscript and approving it for publication was Dr. Gaudenz Danuser. B. Parvin, J. Han, B. Rydberg, and M. H. Barcellos-Hoff are with Lawrence Berkeley National Laboratory, Berkeley, CA 94720 USA (e-mail: parvin@ media.lbl.gov). Q. Yang is with Institute of Automation, Chinese Academy of Sciences, Beijing 100080, China. H. Chang is with the Lawrence Berkeley National Laboratory, Berkeley, CA 94720 USA, and also with the Institute of Automation, Chinese Academy of Sciences, Beijing 100080, China. Color versions of one or more of the figures in this paper are available online at http://ieeexplore.ieee.org. Digital Object Identifier 10.1109/TIP.2007.891154
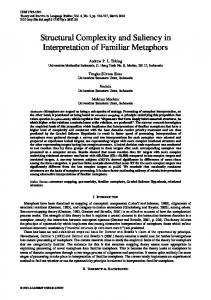
plexes may be punctate (e.g., radially symmetric), may vary in size and shape, and may potentially overlap each other. Thus, segmentation of protein complexes may become an additional necessary step for a more refined representation of functional events that lead to a particular state of a cell. From a human vision perspective, radial symmetry is an important perceptual cue for feature-based representation, localization, and segmentation. For example, in protein localization studies, fluorescence microscopy may be used to quantify nuclear-bound foci formation, and, in structural biology, cryo-EM may be used to image macro-molecular assembly for 3-D reconstruction. In image understanding, saliency or perceptual grouping [6], [9], [19] can be driven by continuity [21], symmetry, or closure. Among these, it is well known that symmetry is a preattentive process [1] that improves recognition, provides an efficient mechanism for scene representation, and aids in reconstruction and description. Radial symmetry is a special class of symmetry, which persists in nature at multiple scales. Robust and efficient detection of inexact radial symmetries facilitates the semantic representation of images for summarization and interpretation. At the lowest level, a radial symmetry operator can be used as an interest operator for detecting critical features that lead, for example, toward visual attention. However, interest operators have to be fast, retain good noise immunity, be sufficiently stable with respect to the underlying intensity distribution, and be capable of delineating and resolving nearby features into disjoint events. Yet, the notion of radial symmetry is used in a weak sense, since the basic geometry can deviate from convexity and strict symmetry for the purpose of approximating the center of mass. The method proposed here allows inference of saliency from incomplete boundary information through voting and perceptual grouping and is implemented through the refinement of specifically tuned voting kernels [24]. Fig. 1 shows several examples indicating potential application areas. In Fig. 1(a), living cells are imaged in bright-field, and their responses are tracked as a function of exogenous stimuli. In Fig. 1(b), a mouse mammary tissue section is stained with a DNA counterstain in one channel to provide context for localization studies in other channels [14]. Some of the nuclear regions in this example have perceptual boundaries. In Fig. 1(c), nuclear foci are visualized following ionfollowing phosphorylation of histone izing radiation. In the last example, a protein complex with two stable resting positions is imaged through cryo-electron microscopy with the ultimate intent of building a 3-D structure through large numbers of observations. While the proposed application is demonstrated in a number of biological domains, it has been applied for one biological endpoint that involves quantitative assessment of the kinetics of the phosphorylation of hi-
1057-7149/$25.00 © 2007 IEEE
616
IEEE TRANSACTIONS ON IMAGE PROCESSING, VOL. 16, NO. 3, MARCH 2007
Fig. 1. Presence of radial symmetries at different physical scales: (a) cells imaged in bright field microscopy mode; (b) nuclei in mouse mammary tissue imaged with fluorescence microscopy; (c) phosphorylation of histone H2AX within the nuclear region following ionizing radiation; (d) macromolecular assemblies imaged through cryo-electron microscopy.
stone following ionizing radiation. Once these events are detected, other attributes are also computed for a more complete representation. Spatial voting has been studied for at least four decades. Hough introduced the notion of parametric clustering in terms of well-defined geometry, which was later extended to the generalized Hough transform [4]. In general, voting operates on the notion of continuity and proximity, which can occur at multiple scales, e.g., points, lines, lines of symmetry, or generalized cylinders. The novelty of our approach is in defining a series of kernels that vote iteratively along the radial or tangential directions. Voting along the radial direction leads to localization of the center of mass, while voting along the tangential direction enforces continuity. At each iteration, the kernel orientation is refined until it converges to a single focal response. Several different variations of these kernels have been designed and tested. They are cone shaped, have a specific orientation but variable in scale, and target geometric features of approximately known dimensions in both 2-D and 3-D. In the case of radial symmetry, the voting kernels are initially applied along the gradient direction, then at each consecutive iteration and at each edge location, the kernel orientation is aligned along the maximum response in the space. The shape of the kernel is also refined and focused as the iterative process continues. The method is applicable to perceptual shape features, has excellent noise immunity, is tolerant to variations in scale, and is applicable to a large class of application domains. The organization of this paper is as follows. Section II provides a brief review of the previous research. Section III describes the basic idea and detailed implementation of evolutionary voting. Section IV defines and explains the parameters of the algorithm. Section V demonstrates the performance of the technique on a variety of spatial distributions. Section VI applies the proposed method to a data set for detailed quantitative analysis. Section VII concludes the paper. II. REVIEW OF PREVIOUS WORK The difficulties in the detection of saliency are often due to variations in scale, noise, and topology. Other complexities originate from missing data and perceptual boundaries that lead to diffusion and dispersion of the spatial grouping in the object space. Fig. 2 shows variations in the shape geometry as a result of angular deviation between the gradient and radial vector along an object’s boundary that can result in ambiguity
Fig. 2. Topological variation as a result of an angular difference between the radial gradient vectors: (a) circle; (b) ellipse; (c) general convex region.
in the presence of noise. Techniques in the detection of radial symmetries can be classified into three different categories: 1) point operations leading to dense output, 2) clustering based on parameterized shape models or voting schemes, and 3) iterative techniques. Point operations are usually a series of cascade filters that are tuned for radial symmetries. These techniques use image gradient magnitudes and orientations to infer the center of mass for blobs of interest [17], [18], [20]. Recent efforts have focused on speed and reliability [7]. Parametric clustering techniques are often based on a variant of the Hough transform, e.g., circle or ellipse finders. These techniques produce loci of points corresponding to the parametric models of well-known geometries. These point distributions are then merged, and model parameters are refined [3]. Nonparametric clustering techniques operate along the gradient direction to search for radial symmetry, using either line- or area-based search. Line-based search [10] is also known as the spoke filter, where the frequency of occurrence of points normal to the edge direction is aggregated. In contrast, area-based voting accumulates votes in a small neighborhood along the gradient direction. Examples of iterative methods include the level set method [13] and the regularized centroid transform (RCT) [23], which iteratively transport boundary points to the local center of mass. The centroid transform can be classified as curve-based voting since the voting path is not along a straight line but along a minimum energy path. Voting paths can be easily distorted by noise, local structures, and other singularities in the image, and may lead to over-segmentation. Thus, the problem is often regularized at different levels through either nonlinear diffusion of random noise [15], or nonlinear diffusion of speckle noise [23], or enforcing smoothness of the path leading each point on the surface to its local centroid [23]. The first two categories of radial symmetry detection can be summarized as follows. Interest-point operators are fast and
PARVIN et al.: ITERATIVE VOTING FOR INFERENCE OF STRUCTURAL SALIENCY
well suited for detecting small features for higher levels of interpretation and manipulation. Parametric voting techniques are potentially memory-intensive, depending upon the dimensionality of the parameter space, and remain sensitive to small deviations from the underlying geometric model. Line- and areabased voting produce a voting space that is diffuse and subject to further ad hoc analysis. Techniques for grouping local features into globally salient structures have incorporated dynamic programming [21], clustering and graph theoretic methods [22], and tensor voting [9]. While these techniques differ in their methods, they share a common thread of using continuity and proximity along the minimum energy path to infer global saliency. The method proposed here falls into the category of iterative techniques, which are adaptive to geometric perturbation and typically produce more stable results. This method shares several attributes with tensor-based voting [9]; however, it differs in that it is iterative and scalar. It demonstrates excellent performance in the presence of noise, variations in scale, and topological changes. In summary, most optimization problems in computer vision rely on establishing proper geometric constraints and then regularizing the solution, which is expressed as a gradient search problem leading to a local minima. Iterative voting operates in the same fashion, where geometric constraints are expressed in the shape of the voting kernel and the regularization is embedded in the smoothness of kernel. The iterative process leads the solution into its local minima by searching for the maximum response in a local neighborhood. III. APPROACH Detection of radial symmetry is iterative where gradient magnitude is projected along the radial direction according to a kernel function. The kernel function is smooth and its topography becomes more focused and dense at be the original image, where each iteration. Let are 2-D image coordinates. Let the domain points be the voting direction at each image point, where for some angle that varies with the image location. Let be the be the angular range, both defined in radial range and Section IV. It is clear that the object size is never exact; therefore, variations in size can be expressed either by specifying lower and upper bounds, or by an average size measure and a deviation around it. In our implementation, we have opted with the former representation. The main advantage is that , then one parameter is eliminated at the cost of if higher computational cost and at no loss to reliability. Let be the vote image, dependent on the radial and angular ranges and having the same dimensions be the local as the original image. Let and dependent voting area, defined at each image point on the radial and angular ranges, defined by
(1) Finally, let
be a 2-D Gaussian kernel (e.g., with variance , masked
617
Fig. 3. Kernel topography: (a)–(e) Evolving kernel for the detection of radial symmetries (shown at a fixed orientation) has a trapezoidal active area with Gaussian distribution along both axes. Application of the voting method requires continuous refinement in the shape of the kernel for improved localization.
by the local voting area , and oriented . Fig. 3 shows a subset of voting in the voting direction kernels that vary in topography, scale, and orientation. The kernel shapes are further described in Section IV. The iterative voting algorithm is outlined below for radial symmetry. Naturally, in the case of continuity, the voting direction is along the tangential direction as opposed to the radial direction. Iterative Voting 1) Initialize the parameters: Initialize and a sequence . , where is the number of iterations, and let Set . Also fix a low gradient threshold, , and a kernel variance, , depending on the expected scale of salient features. 2) Initialize the saliency feature image: Define the feature to be the local external force at each pixel image of the original image. The external force is often set to the gradient magnitude or maximum curvature, depending upon the type of saliency grouping and the presence of local feature boundaries. 3) Initialize the voting direction and magnitude: Compute the , and its magnitude, . image gradient, . Define a pixel subset , define the voting direction For each grid point to be
4) Compute the votes: Reset the vote image for all points . , update the vote image as For each pixel follows:
5) Update the voting direction: For each grid point , revise the voting direction. Let
Let
,
, and
618
IEEE TRANSACTIONS ON IMAGE PROCESSING, VOL. 16, NO. 3, MARCH 2007
Fig. 4. Re-orientation of the kernel at each iteration.
6) Refine the angular range: Let , and repeat steps 4)–6) until . 7) Determine the points of saliency: Define the centers of mass or completed boundaries by thresholding the vote image
and remain staIn step 6) of the above algorithm, tionary, and only the voting spread, defined by , is reduced and becomes more focused. The kernel evolution is shown in Fig. 3. The only remaining variable is the impact of a particular edge detector on voting. In the current implementation, the edge detector corresponds to the derivative of the Gaussian with . Larger values of simply diffuse noise and reduce the voting intensity due to reduced edge magnitude across the entire image, but this only reduces the amplitude in the voting landscape globally and has no other impact. Smaller values of amplify noise and the edge strength at the same time. However, noise is random, and as a result, its voting contribution is uniformly distributed in the image. On the other hand, voting results corresponding to true edges tend to be directed and focused to the center of mass. A. Initialization of Voting Direction and Magnitude In the absence of prior knowledge about object locations, it is reasonable to assume that the center of mass is positioned along the gradient direction of the object boundary. The main intent is to integrate the contribution of all edge locations on the grid, which may be densely or sparsely distributed, as shown in Fig. 1. Unlike the existing practice of grouping illusory contours into a continuous representation [9], we aim at localizing gross islands of information. B. Updating Voting Direction Voting along the gradient direction provides a hypothesis profile for saliency, which is initially quite ambiguous. At each consecutive iteration and each edge location, the kernel is refined and reoriented along the maximum value in its search window, as shown in Fig. 4. For each point , if is the maximum in ’s voting area, then the new voting direction at is along the direction. The rationale for choosing the maximum as the estimated center is as follows. 1) Under ideal conditions, the maximum value is exactly the center of mass. 2) By aligning the voting direction along the maximum values, local maxima in the same neighborhood are grouped together. 3) Localization of the maximum is not compute intensive.
Fig. 5. Detection of radial symmetries for a synthetic image with multiple overlapping objects: (a) original image; (b)–(g) voting landscape at each iteration; (h) final localization of centers of mass.
Fig. 6. Evolution of radial voting on a nuclear image: (a) original image with edges being projected inward in the directions of the voting kernels; (b)–(d) voting landscapes from a subset of iterations. Notice that the initial bimodal voting landscape is eventually condensed into a single convex region.
As pointed out in the previous section, existing methods use or a constant angular range either a single line . Voting along a single line provides a better local maximum but suffers from noise and small variations in scale. Here, the angular range is initialized to a large number, which is gradually decremented to zero. As a result, the voting landscape is refined and focused from coarse to fine. Eventually, radial symmetry or saliency along a boundary is reduced to a single isolated point or a group of points that is strongly clustered together. An example of the application of radial kernels to synthetic overlapping objects is shown in Fig. 5 together with the intermediate results. The voting landscape corresponds to the spatial clustering that is initially diffuse and subsequently refined and focused into distinct islands. A more visual example justifying the iterative nature of the technique is shown in Fig. 6. Notice that the voting landscape is not initially localized; however, through continued refinement, a more refined landscape has emerged. C. Computational Complexity The computational complexity of the iterative voting algorithm is now analyzed. Let us examine the voting area defined by (1). The cost of generating such a voting area is very high. To solve this problem, a voting angular bins, e.g., direction can be quantized into
and a template voting area may be generated and stored for each angular bin. The number of angular bins is usually set to , or . Compared to the voting operation, the cost
PARVIN et al.: ITERATIVE VOTING FOR INFERENCE OF STRUCTURAL SALIENCY
of precomputing and searching these templates can be ignored. The computational complexity of performing a single voting , where operation at iteration is is the number of pixels in the original image. If we select the , where is sequence of angular ranges to be the number of iterations, then the total complexity of the voting operations is
Essentially, the complexity is determined by the image size and the predetermined radial and angular ranges, which depend on the geometric shapes of the objects of interest. If the objects are and can known to be nearly circular, then may be set to be quite small, and . be reduced to as low as IV. VOTING PARAMETERS The voting algorithm contains a number of parameters that need to be appropriately defined. Each of these parameters and its impact on the voting process is analyzed below. • Voting area: For radial voting, the algorithm can be tuned to look exclusively for dark or bright objects, or both, by selecting the signs in (1), which dictate whether the kernels are oriented in the direction of positive versus negative grais set to dient. For bright objects,
For dark objects,
is set to
In the case of tangential voting, or if we want to detect both bright and dark objects, then bidirectional voting is needed
• Voting magnitudes: The voting profile contributed by each pixel is a function of its strength (e.g., gradient magnitude). Weak features can be thresholded with a small value, , to improve computational efficiency; however, this is not a necessary step. It is the edge magnitude and organization of edges that contribute to the voting landscape, thus suppressing random noise even further. and on • Radial and angular ranges: The bounds , the radial range, and the maximum angular range are preselected given the shapes of the objects to be detected. For example, to detect circles, we can set and , and to detect ellipses of the form , we set , , and , which
619
Fig. 7. Synthetic images perturbed with noise: (a), (b) objects with incomplete boundaries; (c), (d) checkerboard with increasing amount of noise.
is the maximum angle between the radial and the gradient (normal) vectors of the ellipse (e.g., , , in Fig. 2). While these are ideal cases, tolerand ances are added for real-world images. • Step size in the evolution of kernel shape: An important value in the protocol is the step size with which the voting area is iteratively reduced. If the step size is too large, then the centers of mass or boundaries will be fragmented, and if it is too small, then the computational cost will rise. The monotonically decreasing sequence, , controls the convergence rate of the algorithm. Each time the voting direction is updated, the angular range is decreased to shrink the voting area. In ] is equally partitioned, our system, the interval [0, and the maximum value is set interactively. For an object demonstrating simple circular geometry, a few iterations ) are adequate. A higher value is necessary for (e.g., noisy images with overlapping objects. • Threshold of output image: The final vote image is always may be set to select ranked. In some cases, a threshold the most prominent set of hypotheses. V. PERFORMANCE ANALYSIS The proposed method for detecting saliency has been applied to a wide variety of object classes across various application domains. We will show that our method is tolerant to variations in scale and geometry, has excellent noise immunity, and can detect overlapping objects with incomplete or perceptual boundaries. The only comparison has been with the Hough transform, which did not perform well on test images, and the results have not been reported. 1) Synthetic Data: Fig. 7 shows several synthetic images corrupted by noise, where the detection results are marked by dark squares. The boundary information in Fig. 7(a) and (b) is incomplete, so the problem is one of perceptual grouping. The algorithm detects the centers of the five objects successfully. Fig. 7(c) and (d) shows the correct detection and localization of symmetries in noisy images. The voting method is applied along the radial direction to detect an approximate location of centers of mass of both bright and dark noisy regions. For a more detailed assessment, we have opted for test data consisting of two overlapping circles that are corrupted by noise and change in scale (e.g., radius of the circles). In both experiments, parameters are constant, and never changed; these are and . Other parameters such as and voting have minimal effect on the final outcome. threshold Fig. 8 shows the detection result when the signal-to-noise ratio is varied from 26 to 6 dB. To demonstrate variability to scaling,
620
IEEE TRANSACTIONS ON IMAGE PROCESSING, VOL. 16, NO. 3, MARCH 2007
Fig. 8. Detection of radial symmetries for a synthetic image with two overlapping circles and gradual increase in noise: (a) SNR = 26 dB; (b) SNR = 20 dB; (c) SNR = 12 dB; (d) 6 dB; (e) 0 dB; (f) 3.5 dB; (g) 6.0 dB. Noise has no effect in (a)–(d) and (f), but there are false positives in (e) and (g). Even at high SNR, iterative voting detects objects of interest, but at the cost of increased false alarms.
0
0
Fig. 11. (a) Fixed sample from C. elegans observed through fluorescence microscopy; (b) detected nuclei.
Fig. 9. Detection of radial symmetries for synthetic images with two overlapping circles and a gradual change in the size of the radius by up to 60% from the reference image (c): (a-b) results after the size reduction; (c) detection results where the parameter setting is performed; and (d-e) results following expansion.
6
Fig. 10. Cells imaged in bright field and florescence: (a) the image demonstrates complex intensity distributions in the imaging signatures of each cell; (b) the voting technique localizes the position of each cell even though some are adjacent to each other; (c) iterative voting provides initial seeding for nuclei from a 3-D cell culture model with overlapping compartments. These images demonstrate potential conditions where segmentation through boundary completion remains ambiguous, as indicated by the arrows. However, through seeding and subsequent tessellation, a more meaningful localization can be inferred.
the radius of each circle was altered by up to 60%, with the detection result shown in Fig. 9. These results indicate tolerance to noise and scale (e.g., object size) for a well-defined object. 2) Real Data: Several examples from different modes of microscopy at different physical scales are demonstrated. The first group, shown in Fig. 10(a) and (b), corresponds to cells imaged in bright field that have gone through apoptosis (cell death) as a result of an exogenous stimuli. The image shows a nonuniform intensity distribution within each cell, with cells overlapping each other. It is also an example, where tensor voting through boundary completion may fail to separate touching cells. Another example, corresponding to a 3-D cell culture model, is shown in Fig. 10(c), where overlapping nuclei are clearly delineated. Again, segmentation through boundary completion methods (e.g., tensor voting) will not produce desirable results. However, through seeding and subsequent tessellation, a more
Fig. 12. Evolution of the voting landscape for localization of nuclei in a mouse mammary tissue section: (a) original image; (b)–(e) refinement of the voting map; (f) final localization of radial symmetries.
confined local neighborhood can be constructed. The second group, shown in Fig. 11, corresponds to nuclear localization in developmental biology to study proliferation rates. In this case, samples at different time points are fixed and imaged with an epi-fluorescence microscope to examine the kinetics of cell division in the C. elegans model system under different treatments. The technique is being used to build a stochastic representation of the growth rate from these studies. The third group, shown in Fig. 12, is an example of mouse mammary tissue imaged with confocal microscopy. The nuclei have a number of substructures corresponding to chromatin that add texture to the nuclear regions; they possess a wide variety of geometric shapes, and their boundaries overlap. In this example, intermediate results of the iterative voting are shown to demonstrate the refinement behavior of the technique. The fourth example, shown in Fig. 13, corresponds to small protein assemblies, which are potentially related to double-strand breaks as a result of ionizing radiation. In this case, radial voting is used as an interest operator to count the number of these protein assemblies in each nucleus. These assemblies are heterogeneous in scale and intensity; as a result, intensity-based thresholding may not produce reliable detection results. Studies
PARVIN et al.: ITERATIVE VOTING FOR INFERENCE OF STRUCTURAL SALIENCY
Fig. 13. Fluorescence assay for H2ax proteins indicates punctate events within the nuclear regions: (a) original; (b) detected assemblies at a specific scale and dimension. Isolated detected events outside of the nuclear regions can be filtered in context.
621
Fig. 15. Spot detection and neighborhood formation with Voronoi tessellation: (a) original image; (b) detected spots and Voronoi tessellation forming a local neighborhood for estimating background and foreground density.
Fig. 14. CryoEM image: projections of protein structures observed with a transmission electron microscope are often noisy and, and depending upon the 3-D resting position, the protein structure’s geometric projections are diverse. The voting technique detects radial symmetries in the presence of noise and significant geometric variation: (a) original image; (b) detected structures.
have shown that the number of these protein markers correlates with the radiation dosage. The final group, shown in Fig. 14, corresponds to a protein structure with two stable positions, and imaged with cryo-electron microscopy. The image is very noisy (as a result of small exposure time to reduce radiation damage) and contains objects with different geometries. These images demonstrate that 1) objects of interest often have variable scales and topologies, 2) objects of interest often overlap, and 3) a significant amount of noise—both random and speckle—is often present. In all four groups of images, the radial voting method successfully localizes the centers of mass of the objects of interest. VI. EXPERIMENTAL RESULTS The above voting method has been applied to detection of following foci formed by phosphorylation of histone ionizing radiation. A system has been developed to segment the nuclear regions [16], which provide context for quantifying protein localization. However, segmentation of foci is complicated as a result of variation in 1) background intensity, 2) foreground intensity, 3) sample preparation, and 4) instrument configuration. Furthermore, our experience indicates significant intensity crosstalk between neighboring foci. While voting provides an initial localization of foci, a robust method for accurate segmentation is needed. Our proposed approach is based on 1) es-
Fig. 16. Three-dimensional visualization of foci in a single nucleus: (a), (c) top views; (b), (d) side views.
tablishing a local neighborhood for each of the foci based on Voronoi tessellation, as shown in Fig. 15, which is also bounded by the maximum size of the foci, and 2) modeling the local intensity distribution as a mixture of two Gaussian distributions, whose latent variables are estimated using the expectation-maximization method [2]. The technique has been validated on synthetic data with and without noise, and then applied to real data. Two data sets from a recent experiment have been used for detailed quantitative analysis. In this experiment, cells were irradiated and then fixed at different time points for a kinetics analysis. The results were then compared with the control data set (e.g., zero irradiation) that provides an estimate of the background foci formation as a normal cell process. Samples were irradiated in such a way that the 2-D and 3-D image acquisition produces the same number of foci in each case. Furthermore, the voting technique is extended and implemented in 3-D for comparative analysis, and two examples of 3-D segmentation results are shown in Fig. 16. Samples were initially imaged in 3-D, and 2-D images were obtained through maximum projection along the axis. Foci were then counted and segmented for each nucleus in the image. Each image has approximately 50 cells, and there are a total of 128 images corresponding to control and ir-
622
IEEE TRANSACTIONS ON IMAGE PROCESSING, VOL. 16, NO. 3, MARCH 2007
of view. The voting algorithm can provide a general framework for inferring a variety of types of low-level saliency by simply modifying the kernel shapes and external force measured from the image (gradient, curvature, etc.). The performance of this method has been demonstrated on synthetic and real data containing noise, variation in scale (e.g., object size), and presence of perceptual boundaries. Although the method has been applied to a specific biological problem to estimate the formation and resolution of radiation-induced nuclear foci, a wider application of the method to atmospheric images and facial data has been presented earlier. The data and software are posted on the group’s website at http://www.vision.lbl.gov/ under the Software section. REFERENCES
Fig. 17. Kinetics of DNA repair as measured by phosphorylation of H2AX protein as measured from maximum and projection data (a) and the original 3-D data from full 3-D analysis (b). Total of 128 images corresponding to control and irradiated have been processed.
radiated samples. The kinetics of foci loss, as measured by reduction of the number of foci, is shown in Fig. 17. These plots indicate that the kinetics of the foci losses are fast and occur within the first 8 hours. Although 3-D voting is computationally more expensive, it tends to be more robust since 1) more information is present on each foci, and 2) there are fewer ambiguities as a result of crosstalk between foci at adjacent focal planes. VII. CONCLUSION AND FUTURE WORK A new iterative approach for detecting saliency in biological images has been introduced. The main novelties are 1) a re-estimation of voting direction and 2) an update of the voting fields by focusing their energy at each consecutive iteration. We suggest that a dynamic and evolutionary voting strategy overcomes the drawbacks of traditional static voting. The proposed method can be viewed as sharing two features of the selforganizing map [5]: 1) a gradual reduction in the neighborhood size, and 2) the winner-take-all strategy. In our case, the neighborhood size is reduced, but along a specific orientation, and the kernel is always adjusted by the local maximum in its field
[1] F. Attneave, “Symmetry information and memory for patterns,” Amer. J. Psychol., vol. 68, pp. 209–222, 1955. [2] J. Bilmes, “A gentle tutorial on the em algorithm and its application to parameter estimation for gaussian mixture and hidden markov models,” 1997. [3] R. O. Duda and P. E. Hart, “Use of the hough transform to detect lines and curves in pictures,” CACM, vol. 15, no. 1, pp. 11–15, January 1972. [4] P. V. C. Hough, “Method and means for recognizing complex patterns,” U.S. Patent 3 069 654, 1962. [5] T. Kohonen, Self-Organizing Maps. New York: Springer, 1997. [6] D. Lowe, Perceptual Organization and Visual Recognition. Amsterdam, The Netherlands: Kluwer, 1985. [7] G. Loy and A. Zelinsky, “Fast radial symmetry for detecting points of interest,” Pattern Anal. Mach. Intell., vol. 25, no. 8, pp. 959–973, Aug. 2003. [8] R. Malladi and J. Sethian, “A unified approach to noise removal, image enhancement, and shape recovery,” IEEE Trans. Image Process., vol. 5, no. 11, pp. 1554–1568, Nov. 1995. [9] G. Medioni, M. S. Lee, and C. K. Tang, A Computational Framework for Segmentation and Grouping. New York: Elsevier, 2000. [10] L. G. Minor and J. Sklansky, “The detection and segmentation of blobs in infrared images,” SMC, vol. 11, pp. 194–201, 1981. [11] R. Murphy, “Automated interpretation of subcellular locatoin patterns,” in Proc. IEEE Int. Symp. Biomedical Imaging, Apr. 2004, pp. 53–56. [12] C. Ortiz De Solorzano et al., “Segmentation of nuclei and cells using membrane protein,” J. Microsc., vol. 201, pp. 404–415, Mar. 2001. [13] S. Osher, “The level set formulation for the solution of dirichlet problem for Hamilton-Jacobi equation,” Report Univ. California, Los Angeles, 1992. [14] B. Parvin, Q. Yang, G. Fontenay, and M. Barcellos-Hoff, “Biosig: An imaging bioinformatics system for phenotypic analysis,” IEEE Trans. Syst., Man, Cybern. B, Cybern., vol. 33, no. 5, pp. 814–824, Oct. 2003. [15] P. Perona and J. Malik, “Scale space and edge detection using anisotropic diffusion,” IEEE Trans. Pattern Anal. Mach. Intell., vol. 12, no. 7, pp. 629–640, Jul. 1990. [16] S. Raman, B. Parvin, C. Maxwell, and M. Barcellos-Hoff, “Geometric approach segmentation and protein localization in cell cultured assays,” in Proc. Int. Symp. Visual Computing, 2005, pp. 427–436. [17] D. Reisfeld, H. Wolfson, and Y. Yeshurun, “Context-free attentional operators: The generalized symmetry transform,” Int. J. Comput. Vis., vol. 14, no. 2, pp. 119–130, Mar. 1995. [18] D. Reisfeld and Y. Yeshurun, “Preprocessing of face images: Detection of features and pose normalization,” Comput. Vis. Image Understand., vol. 71, no. 3, pp. 413–430, Sep. 1998. [19] S. Sarkar and K. Boyer, “Intergration, inference, and management of spatial information using bayesian network: Perceptual organization,” IEEE Trans. Pattern Anal. Mach. Intell., vol. 15, no. 3, pp. 256–274, Mar. 1993. [20] G. Sela and M. D. Levine, “Real-time attention for robotic vision,” Real-Time Imag., vol. 3, no. 3, pp. 173–194, Jun. 1997. [21] A. Shashua and S. Ullman, “Structural saliency: The detection of globally salient structures using a locally connected network,” in Proc. IEEE Int. Conf. Computer Vision, Tampa, FL, 1988, pp. 321–327. [22] Z. Wu and R. Leahy, “An optimal graph theoretic approach to data clustering: Theory and its application to image segmentation,” IEEE Trans. Pattern Anal. Mach. Intell., vol. 15, no. 11, pp. 1101–1113, Nov. 1993.
PARVIN et al.: ITERATIVE VOTING FOR INFERENCE OF STRUCTURAL SALIENCY
[23] Q. Yang and B. Parvin, “Harmonic cut and regularized centroid transform for localization of subceullar structures,” IEEE Trans. Biomed. Eng., vol. 50, no. 4, pp. 469–475, Apr. 2003. [24] ——, “Perceptual organization of radial symmetries,” in Proc. Conf. Computer Vision and Pattern Recognition, 2004, pp. 320–325. Bahram Parvin (S’78–M’82–SM’98) received the Ph.D. degree in electrical engineering from the University of Southern California, Los Angeles, in 1991. He is the Head of Imaging and Informatics, Lawrence Berkeley National Laboratory, Berkeley, CA, and an Adjunct Professor of electrical engineering at the University of California, Riverside, where he teaches graduate courses on bioimaging and systems biology. His areas of interests are image understanding, high-content representation of scientific data, and computational biology. Dr. Parvin has been a member of the organizing and program committee on IEEE conferences on vision and pattern recognition.
Qing Yang (M’00) received the Ph.D. degree in computer science from the Institute of Automation, Chinese Academy of Sciences, Beijing. He is a Professor with the Institute of Automation, Chinese Academy of Sciences. His research interests include image processing, pattern recognition, and bioinformatics.
Ju Han (S’04–M’06) received the Ph.D. degree from the Electrical Engineering Department, University of California, Riverside, in 2005. Since December of 2005, he has been a Postdoctoral Fellow in the Imaging and Informatics Group of the Life Science Division, Lawrence Berkeley National Laboratory, Berkeley, CA. His research interests include biological image understanding, machine learning, quantitative biology, and biometrics.
623
Hang Chang is pursuing the Ph.D. degree at the Institute of Automation, Chinese Academy of Sciences, Beijing. Since January of 2006, he has been a Graduate Student Research Assistant in the Imaging and Informatics Group, Life Science Division, Lawrence Berkeley National Laboratory, Berkeley, CA, where he conducts research in quantitative biology and biological image understanding. His other areas of research are machine learning, computational biology, and interactive image segmentation and matting.
Bjorn Rydberg received the Ph.D. degree from Uppsala University, Uppsala, Sweden, in 1975, in the area of physical biology. He has been a Staff Scientist with Lawrence Berkeley National Laboratory, Berkeley, CA, for 16 years. His main interest is in the area of DNA damage induced by ionizing radiation and its cytogenetic consequences in human cells.
Mary Helen Barcellos-Hoff received the undergraduate degree in biopsychology from the University of Chicago, Chicago, IL, in 1978, and the Ph.D. degree in experimental pathology from the University of California, San Francisco, in 1986. Her graduate research in experimental pathology was conducted with Dr. D. F. Deen on determinants of brain tumor cell response to therapy, and her postgraduate research concerning extracellular matrix signaling on mammary epithelial functional differentiation training was conducted at Lawrence Berkeley National Laboratory (LBNL), Berkeley, CA, with Dr. M. J. Bissell. She established her research laboratory in 1988 to study breast cancer and ionizing radiation. She is now Deputy Director of the Life Sciences Dvision and Head of Cancer Biology, LBNL. The goal of her research is to understand how multicellular processes are disrupted during the progression from normal growth to neoplasia.