Large-Scale Autonomic Server Monitoring Using Process Query Systems Christopher Roblee Vincent Berk George Cybenko Institute for Security Technology Studies Thayer School of Engineering Dartmouth College, Hanover, NH 03755
[email protected]
Abstract In this paper we present a new server monitoring method based on a new and powerful approach to dynamic data analysis: Process Query Systems (PQS). PQS enables userspace monitoring of servers and, by using advanced behavioral models, makes accurate and fast decisions regarding server and service state. Data to support state estimation come from multiple sensor feeds located within a server network. By post-processing a system’s state estimates, it becomes possible to identify, isolate and/or restart anomalous systems, thus avoiding cross-infection or prolonging performance degradation. The PQS system we use is a generic process detection software platform. It builds on the wide variety of system-level information that past autonomic computing research has studied by implementing a highly flexible, scalable and efficient process-based analytic engine for turning raw system information into actionable system and service state estimates.
1
Introduction
Proper security and performance monitoring of modern server farms is a difficult task. While most commercial monitoring solutions do scale to the capacities required for capturing large amounts of status data being generated by high-throughput server banks, they are weak on the analytic capabilities required to interpret or otherwise use that data in such a way as to implement autonomic behaviors. For example, intrusion detection software often generates hundreds of alerts per minute, most of which are falsepositives, subsequently desensitizing administrators to any actual serious threat. Additionally, it is not uncommon for most servers to share identical software, making the entire server bank vulnerable to the same set of attacks. When one server is compromised but not quarantined immediately, the
attack may spread to the entire server array. The results can be catastrophic; unplanned downtime can cost as much as $550,000 per hour in lost revenue for large server farms, such as those used in the financial services industry [12]. Autonomic computing approaches to server management strive to identify deviant behavior by services running on the servers as a means of mitigating this problem. By having each server closely monitor all of its processes and system variables, it is possible to identify rogue or anomalous behavior when it occurs. Once identified, the process can then be quarantined, shut down, and possibly restarted. One major problem with modern autonomic monitoring approaches, however, is the way in which they monitor processes. They either use a limited number of status indicators or are invasive with respect to the operating system or application software. Some experimental systems, for instance, hook into the OS kernel and monitor all the system calls coming from a monitored process [7]. When combined with dynamic behavior learning algorithms, such methods can impose an unacceptable load on system resources. In this paper we present a significantly more scalable approach to monitoring system processes. Process Query System (PQS) [4] technology allows us to quickly and easily integrate multiple sensor sources and model human system administrator analysis in order to obtain fast and accurate results, with a significantly reduced overhead as compared with other approaches. Human system administrators often only monitor a small portion of the available system data, such as server load, network load, I/O load, and intrusion detection data. By combining this information, a human analyst may decide to further investigate the behavior of any one server. Process Query Systems is a technology that allows quick and easy integration of sensor resources and uses custom built models to detect evidence of occurring processes in the observed environment. Because of its level of abstraction, the programmer can focus on these process models instead of system design or sensor input. By cor-
relating externalized host state with network-level context, PQS models can provide administrators with a clearer picture of network state and facilitate self-healing actions. Our system combines user-space process monitoring, such as system load, I/O load, and fork behavior with intrusion detection data and loads it into the PQS processing core. We will show how our process models can significantly reduce false positive rate of the connected IDS systems, and how deviant process behavior can be easily detected, and qualified without a significant increase in server system load. The next section contains a short introduction to the concepts behind Process Query Systems. Section 3 describes the server monitoring architecture we have implemented using PQS, including the sensor types and process models. Experimental results using a testbed server network are in Section 4 while Section 5 is an analysis of our findings with suggestions for future work.
2
Background
{a}
{a,b}
{c}
A
B
C
A State "A"
2.1
Event−State Associations
{a,b} Observable Events
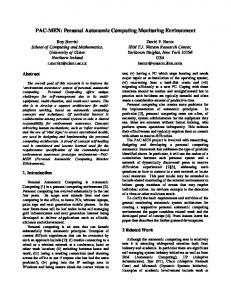
Figure 1. A Simple Process Model, M1 {a,b}
{c}
{b}
D
E
F
D State "D"
In this section we take an in-depth look at the new Process Query System (PQS) technology, as well as the current state-of-the-art in server monitoring systems. The particular implementation of a PQS that we used for this work was called “TRAFEN”, the TRacking And Fusion ENgine [1].
State Transitions
State Transitions
Event−State Associations
{a,b} Observable Events
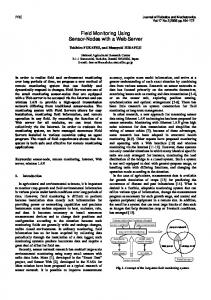
Figure 2. Another Process Model, M2 event sequences. Below is a set of all the rules necessary for detecting single transitions:
Process Query Systems
Process Query Systems are a new paradigm in which user queries are expressed as process descriptions. This allows a PQS to solve large and complex information retrieval problems in dynamic, continually changing environments where sensor input is often unreliable. The system can take input from arbitrary sensors and then form hypotheses regarding the observed environment, based on the process queries given by the user. Figure 1 shows a simple example of such a model. Model M1 represents a state machine S1 = (Q1 , Σ1 , δ1 ), where the set of states Q1 = {A, B,C}, the set of observable events Σ1 = {a, b, c}, and the set of possible associations δ1 : Q1 × Σ1 consists of δ1 = {{A, a}, {B, a}, {B, b}, {C, c}}. Notice how this process is able to produce observed event a in both state A and state B. A possible event sequence recognized by this model would be: e1 = a, e2 = a, e3 = b, e4 = c, e5 = b which we will write as e1:5 = aabcb for convenience. Possible state sequences that match this sequence of observed events could be AABCB, or ABBCB, both of which are equally likely given M1 . A rule-based model would require many rules to identify this process, based on all the possible
AA → AB → BB → BA → BC → CC → CB → CA →
{aa} {aa}, {ab} {aa}, {ab}, {ba}, {bb} {aa}, {ba} {ac}, {bc} {cc} {ca}, {cb} {ca}
Needless to say the list of possible event sequences for double transitions is massive (e.g. transitions AAA, AAB, ABB, ABC, . . . etc.) and only grows when we consider dealing with the possibility of missed observations. Rules would then have to include sequences that have two transitions for a single observed event, albeit with a lower priority accounting for the fact that we expect only few observations to go missing. We now introduce a second model M2 , shown in Figure 2, defined by state machine S2 = (Q2 , Σ2 , δ2 ). Consider that both processes are regularly and concurrently occurring in the observed environment. Note that the process / although states are labeled differently, i.e. Q1 ∩ Q2 = 0, both processes produce the same set of observable events, i.e. Σ1 ∩ Σ2 ≡ Σ1 ≡ Σ2 . Now consider the following sequence of events:
e1:24 = abaacabbacabacccabacabbc where each observation may have been produced by instances of model M1 , model M2 , or be totally unrelated. It must be noted that any modeled process may very well be occurring multiple times concurrently. A Process Query System uses multiple hypothesis, multiple model techniques to disambiguate observed events and associate them with a “best fit” description of which processes are occurring and what state they are in. By comparison, a rule-based system would become extremely complex for the above situation and quickly become unmaintainable and unintelligible. Additional problems with rule-based approaches arise when probabilities are assigned to the state transitions, and/or the event productions, as in Hidden Markov Models for example. Consider the following example. Assume that the first model describes the dynamics of a propeller plane, and the second model describes the dynamics of a fighter jet, both observed by radar. It may very well be possible that there are several propeller planes and a group of jet fighters in the same airspace, all within radar range. The PQS will use the radar data as input observations together with the two models to disambiguate which radar observations were triggered by which aircraft by associating radar observations using the models. Subsequently, the hypothesis will be that there are several instances of the model M1 (the propeller plane) and a group of instances of model M2 in the observed environment. Since the environment is dynamic, the top hypothesis will be changing continuously as planes move in and out of radar range. A PQS is a very general and flexible core that can be applied to many different fields. The only elements that change between different applications of a PQS are the format of the incoming observation stream(s) and the submitted model(s). Compare this with a traditional DBMS; inventory tracking systems, accounting, customer databases, etc. are all different applications that, at the core, are all based on the same DBMS. Likewise we have implemented vehicle tracking systems, server farm monitoring applications, enterprise network security trackers, and covert timing channel detectors using the same PQS software core by simply supplying a different observation stream and a different set of models. Internally, a PQS has four major components that are linked in the following order: 1. Incoming observation handling and sensor subscription. 2. Multiple hypothesis generation. 3. Hypothesis evaluation by the models. 4. Selection, pruning, and publication.
To conclude, the major benefits of a PQS are its superior scalability and applicability. The application programmer simply connects the input event streams and then concentrates on writing process models. Models can be constructed as state machines (above), formal language descriptions, Hidden Markov Models, kinematic descriptions, or a set of rules. All these different model types are first compiled down to the fundamental PQML (Process Query Modeling Language) representation and then submitted to the PQS. The PQS is then ready to track processes occurring in a dynamic environment and continuously present the best possible explanation of the observed events to the user.
2.2
Related Work
In recent years there has been significant research into different implementations of self-awareness and selfhealing in server environments. The authors of [5] describe the motivations and architectural concepts underlying much of the work in this space. Commercially-available server monitoring platforms, such as NimSoft’s NimBUS [11] and JJ Labs’ WatchTower [10], offer robust, lightweight sensing and reporting capabilities across large server farms. However, these types of solutions are oriented towards massive data collection and performance reporting, and leave much of the final analysis and decision-making to the administrator. Our approach automates this analysis by identifying failure states probabilistically, based on behavioral models. The authors of [13] and [6] also present scalable, lightweight architectures for cluster monitoring. The host-based Autonomic Defense System in [9] solves a similar problem through model-based detection and response. Their approach involves offline training of Markov models to represent different attack scenarios. The architecture is different from ours, in that sensing, detection and control components run on the individual hosts themselves. We hope to use PQS to determine the viability of a joint network and host-based paradigm built on a centralized architecture for detecting and responding to server failures. The SARA experiment in [14] compares local and orchestrated mechanisms for the autonomic detection and mitigation of a distributed e-mail denial of service attack. Like our system, theirs uses data from multiple observation spaces to support coordinated detection of attacks. Forrest et al. [7] have proposed methods of detecting anomalous host behavior by monitoring system call sequences of selected Unix processes. This requires the offline construction of normal pattern databases for each monitored application. The online detection of anomalous traces is a difficult task to scale, however, as every server can exhibit different system call behaviors for the same applications. Runtime analysis of system calls can furthermore
curtail the monitored server’s performance. Backdoors [2] is a system architecture for the remote detection and repair of OS damage with non-intrusive probes. This system imposes no overhead on OS resources, but requires the installation of a dedicated hardware control channel and specialized OS extensions (kernel hooks) to monitor performance metrics. Our platform uses passive, platformagnostic sensors that run in user-space to extract similar OS state information. This sensing architecture is light-weight and portable, as it does not require any significant host reinstrumentation.
3
User−space Sensor /proc
State Extractor
system variables continuous metric stream log files
Evaluator
Architecture extraordinary events
In this section, we describe the fundamental components of our approach to autonomic server monitoring, and how they integrate with our current PQS implementation, TRAFEN (TRacking And Fusion ENgine). The host-level component is a user-space sensor, which monitors host behavior and publishes significant events to a TRAFEN engine as observations. The TRAFEN engine fuses this information with observations from other sensors using custom process models, which hold the high-level evaluation logic. Models correlate host-generated events with events from other spaces, such as network sensors, that pertain to network-level indicators of host failure. From the output of these process models, administrators or higher-level TRAFEN instances can make valuable conclusions about the state of one or more nodes in the monitored network.
3.1
User-space Sensors
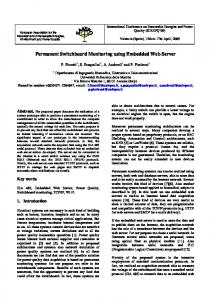
The purpose of the user-space sensor is to collect and pre-process host-level state data and to generate sufficient, meaningful events in order to enable host verification at higher levels in the system. The principal design consideration for these sensors is that they operate in a relatively non-intrusive manner, and that they require minimal host reinstrumentation upon deployment. Events are generated on a reactive basis when short-term anomalies in any of the monitored host metrics are detected. These events are subsequently published to the TRAFEN system as observations over a dedicated TCP socket connection. Observations are treated as possible symptoms of larger-scale host or service failures, or security compromises. The user-space sensor, shown in Figure 3 comprises two decoupled modules: a state extractor and an evaluator. The state extractor samples a set of raw process-level and system-level performance metrics at regular intervals. The state extractor can be configured to monitor or exclude from monitoring any subset of processes. This allows for the reduction in the number of generated events, and subsequently noise, by limiting evaluation to specific applica-
host observations
Figure 3. The user-space sensor running on monitored host.
tions. The state extractor’s performance may also be tuned by adjusting its sampling rates. At present, this is the only machine-specific configuration required by the sensors. The state extractor acquires the following metrics: For each monitored process: • process ID (PID) • process state • process memory utilization in MB • percent process CPU utilization • process parent name • process parent ID (PPID) For the entire system: • total system memory utilization in MB • percent total system CPU utilization • total number of processes • total MB received over network interface • total MB sent over network interface The raw data is extracted from the /proc file system, while other system-level properties, such as IP address and time stamps are acquired through external calls to shell commands. These indirect measures of host behavior provide a fairly platform-agnostic view of a system’s runtime
state and can be extracted non-invasively, without reinstrumenting the kernel or application code. The evaluator consumes this continuous stream of state samples, and generates an event when it detects something extraordinary across them. The sensor provides for two basic event models: • Routine, continuous events (e.g., system CPU usage up 30%). • Relatively infrequent, discrete events (e.g., httpd process forks a shell process). Both alert categories are highly valuable as potential manifestations of system or service failure to the detectors at the TRAFEN level, so we account for both in our process models and sensor architecture. A fundamental challenge to developing robust host sensors for effective and lightweight anomaly monitoring is that many instances will in practice generate excessive amounts of redundant or insignificant events, possibly degrading host, network, and detector performance. It is often difficult at the host level to distinguish normal or acceptable variations in runtime variables from true anomalies. Many host sensors address this by capturing characterization baselines of each performance metric during an initial training phase. This can be a lengthy and burdensome process, however, and we hope to minimize the degree of machine-specific configuration. Extensive sensor training can reduce the generation of seemingly irrelevant observables (e.g., system CPU utilization increase). However, we do not want the evaluator to simply ignore these traces, as they might be valuable in a higher-level context as symptoms. To manage the evident tradeoffs between monitor runtime performance, portability and detection accuracy, the evaluator aggregates performance metrics over sampling windows to effectively maintain smoothed, running averages. The sensor, in turn, listens for short-term deviations in OS and target application behavior by comparing each metric slope to threshold values. When a new sample exceeds the previous window average by this threshold, an event is generated. Hence, the slope thresholds and sampling window length control the sensitivity of the sensor. This coarser-grained analysis reduces the overall frequency of false alert generation and doesn’t require a priori determination of acceptable behavior ranges.
3.2
Event Format
When a user-space sensor detects an anomalous trace in one of the monitored host metrics, it generates an event to describe the perceived host state and publishes it to TRAFEN. Each event is assembled as a TRAFEN observation - a structured, canonical format that only contains information that is relevant to higher-level entities. To enforce
this level of granularity, significant host events are generally translated into higher-level semantics (e.g., System memory up 15% → SYS.MEM) . Observations are collections of name-value pairs and adhere to a simple ontology, demonstrated in the examples below. HostObservation { time: Thu Jan 06 13:34:05 EST 2005 type: SYS.PROCS.GROWTH ip: 10.0.0.20 num_procs: 56 } HostObservation { time: Thu Jan 06 13:33:04 EST 2005 type: PROC.CPU ip: 10.0.0.24 name: sftp-server pid: 30039 state: S parent_name: sshd ppid: 30038 } The observation’s type field is a generic descriptor for the type of anomaly detected at the host. Observations are divided into two semantic categories: continuous and discrete. Continuous observations correspond to slope anomalies, whereas discrete observations correspond to singular, categorical sensed events. Observations are subdivided into process-level (PROC.*) and system-level (SYS.*). The observation type hierarchy shown in Table 1 illustrates the type and granularity of information that is fed into TRAFEN.
3.3
Models
Leveraging the extensibility of the TRAFEN system, we have developed a suite of novel process models to perform event correlation, scoring and problem determination. TRAFEN models encapsulate all of the necessary logic for evaluating hypothetical tracks of observations from monitored hosts and network sensors. Since the TRAFEN infrastructure abstracts away the collection and mapping of host observations to process models, the administrator can concentrate on developing and experimenting with a set of underlying models by applying various state estimation techniques. For the purpose of autonomic host monitoring, each model is designed to track one of the following: • Isolated host runtime performance. • Correlated network and host activity. • Aggregate network status.
Table 1. User-space sensor observation types Continuous types PROC.MEM Process memory utilization PROC.CPU Process CPU utilization SYS.NET.RX Incoming network traffic SYS.NET.TX Outgoing network traffic SYS.MEM System memory utilization SYS.CPU System CPU utilization Discrete types PROC.SPAWN Spawning of a monitored process type (e.g., sh, httpd) SYS.PROCS.GROWTH Growth in total number of processes SYS.PROCS.HIERARCHY Suspicious process hierarchy (e.g., depth, breadth)
{SYS.CPU,SYS.PROCS.GROWTH}
Nominal
{Network Recon}
{PROC.MEM, PROC.CPU, SYS.MEM,PROC.SPAWN}
Questionable
Compromised
Figure 4. An example state-machine process model, M3 , for detecting generic attackrelated server compromises through host and network activity correlation.
The TRAFEN engine evaluates incoming observations one at a time, and checks if they are related by some modelspecific measure. Correlated events (events that are likely related) are gathered as tracks, which describe one possible host scenario. We have implemented several prototype models that embody the problem behavior of monitored entities with varying degrees of complexity and granularity. These initial models serve to reduce the overall rate of false positives in server failure detection. We are currently working with process models that cover the following general scenarios: 1. Network intrusion and host-level manifestations: Models in this category analyze changes in host behavior after a network-level event relevant to that host (IP) has occurred. The underlying rationale for this design pattern is that host sensors will often report "exceptional events" that aren’t actually alarming. Similarly, network-based sensors frequently generate false positives in response to innocuous network activity. Hence, there is often detrimental noise at both host and network levels. By tracking certain properties of re-
ported host-level events, however, models can interpret finer-grained host activity and temporally correlate it with pertinent network activity (by common IP). This should subsequently reduce the rate of false-positives and enable the system to arrive at more sensible hypotheses about the current state of a monitored host. These models operate on two independent observation spaces, H and N, for the observable host and network events, respectively. The observations from each of these spaces at time t are denoted as h1:t = (h1 , h2 , . . . , ht ) and n1:t = (n1 , n2 , . . . , nt ). For each observation, arriving at time t, the model computes p(st |h1:t , n1:t ), the conditional probability of how likely the current event sequence of host and network observations indicates a modeled attack or failure scenario, st , for a monitored host. At each time, t, the TRAFEN engine feeds many different subsets of the observation sequence (tracks) to each model for evaluation. Over time, many tracks accumulate and are scored according to the probability p(st |h1:t , n1:t ). Tracks with lower scores are eventually pruned, and those remaining continue on to the subsequent iteration, where they may grow. Figure 4 shows a simple state machine process model, M3 , with three generic server states: Q3 = {Nominal, Questionable,Compromised}. It treats variants such as short-term system CPU spikes (SYS.CPU) and aggregate process count growth (SYS.PROCS.GROWTH) as indicators of steady-state server behavior. When one or more NIDS observations with the same destination IP as the server arrives, it transitions to the Questionable state, where it waits for a specified timeout. If this is followed by the spawning of a monitored process type, a jump in system memory, or a series of PROC.CPU or PROC.MEM observations, the Compromised state is entered. In this state, the probability of compromise, p(st |h1:t , n1:t ), grows
for each qualified host observation reported within the timeout. 2. Isolated host failure or performance degradation: Models in this category perform local diagnoses of host failures caused by system or service misconfigurations and application flaws. Such models do not make use of global network context, but the TRAFEN engine is still useful in making runtime assessments, as it can provide administrators with a concise and contextual view of the status of their servers. We can configure TRAFEN to simultaneously evaluate observation streams using multiple models to formulate causal alternatives for each detected host failure or performance degradation. For instance, we could submit the host-network activity correlator model, M3 , along with an isolated host degradation model, M4 , to a TRAFEN instance. For simplicity, define M4 as a state machine S4 = (Q4 , Σ4 , δ4 ), with equivalent states as M3 , i.e. Q3 ≡ Q4 , and Σ4 = {ha , hb , hc , hd , he , h f , hg } ⊆ H. Let Σ3 = {na , nb , ha , hb , hc , hd , he , h f }, where {na , nb } ⊆ N. Now suppose that TRAFEN receives the following sequence of host and network-level observations for an observed host (i.e., all share the same destination IP): e1:12 = he h f hg ha hg na hg hg hg hg hg nb Based on the scores generated by the two models over time, the following tracks would be returned as the combinations that most likely indicate the occurrence of their corresponding failure scenarios (s3 , s4 ) on the observed host:
M3 → M4 →
he h f ha ha na nb he h f hg ha hg hg hg hg hg hg
The two models treat different event subsequences as indicators of s3 and s4 , and grow their track likelihoods independently. Therefore, each model forms its own conclusions about the observation sequence. In this example, M3 generates the likelihood p(s3 |h1:t , n1:t ) = 0.55 and M4 the likelihood p(s4 |h1:t ) = 0.9. TRAFEN subsequently concludes that this event sequence’s target host is certainly "questionable", but that it is most likely facing some sort of an isolated failure, perhaps a misconfiguration. The observed network events (na , nb ), are most likely not associated with an attack. The resultant multi-model likelihoods can be compared using a threshold, as in [8], to identify the failure and facilitate an autonomic response: B