An application of Maximum Likelihood Estimation (MLE) theory is ... Most of the
material presented in this paper makes use of maximum likelihood theory.
LDF Curve-Fitting and Stochastic Reserving. A Maximum LikelihoodApproach David R. Clark, FCAS, MAAA
41
LDF Curve-Fitting and Stochastic Reserving: A Maximum Likelihood Approach or
How to Increase Reserve Variability with Less Data
David R. Clark American Re-Insurance 2003 Reserves Call Paper Program
Abstract An application of Maximum Likelihood Estimation (MLE) theory is demonstrated for modeling the distribution of loss development based on data available in the common triangle format. This model is used to estimate future loss emerge nce, and the variability around that estimate. The value of using an exposure base to supplement the data in a development triangle is demonstrated as a means of reducing variability. Practical issues concerning estimation error and extrapolation are also discussed.
The author gratefully acknowledges the help and encouragement of the following people: Dick Cuttle, JeffDavis, Leigh Halliwell, Don Mango, Dave Spiegler, and Chuck Thayer.
42
Introduction
Many papers have been written on the topic of statistical modeling of the loss reserving process. The present paper will focus on one such model, making use of the theory of maximum likelihood estimation (MLE) along with the common Loss Development Factor and Cape Cod techniques. After a review of the underlying theory, the bulk of this paper is devoted to a practical example showing how to make use of the techniques and how to interpret the output.
Before beginning a discussion of a formal model of loss reserving, it is worth re-stating the objectives in creating such a model.
The primary objective is to provide a tool that describes the loss emergence (either reporting or payment) phenomenon in simple mathematical terms as a guide to selecting amounts for carried reserves. Given the complexity of the insurance business, it should never be expected that a model will replace a knowledgeable analyst, but the model can become one key indication to assist them in selecting the reserve.
A secondary objective is to provide a means of estimating the range of possible outcomes around the "expected" reserve. The range of reserves is due to both random "process" variance, and the uncertainty in the estimate of the expected value.
From these objectives, we see that a statistical loss reserving model has two key elements: •
The expected amount of loss to emerge in some time period
•
The distribution of actual emergence around the expected value
These two elements of our model will be described in detail in the first two sections of this paper. The full paper is outlined as follows:
43
Section 1:
Expected Loss Emergence
Section 2:
The Distribution of Actual Loss Emergence and Maximum Likelihood
Section 3:
Key Assumptions of the Model
Section 4:
A Practical Example
Section 5:
Comments and Conclusion
The practical example includes a demonstration of the reduction in variability possible from the use of an exposure base in the Cape Cod reserving method. Extensions of the model for estimating variability of the prospective loss projection or of discounted reserves are discussed more briefly.
Most of the material presented in this paper makes use of maximum likelihood theory that has already been described more rigorously elsewhere. The mathematics presented here is sufficient for the reader to reproduce the calculations in the examples given, but the focus will be on practical issues rather than on the statistical theory itself.
44
Section 1:
Expected Loss Emergence
Our model will estimate the expected amount of loss to emerge based on a) an estimate of the ultimate loss by year, and b) an estimate of the pattern of loss emergence.
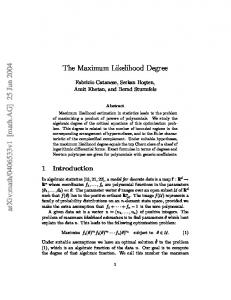
For the expected emergence pattern, we need a pattern that moves from 0 to 100% as time moves from 0 to 8. For our model, we will assume that this pattern is described using the form of a cumulative distribution functionI (CDF), since a library of such curves is readily available.
G(x)
=
1/LDF x
= cumulative % reported (or paid) as of time x
100.0% 9o.o%
5 ,8
80.0% 7o.o% ao.o%
a.
o.o% 40.0%
.~
30.0%
"~
20.0% 10.0%
,.,,
0.0% 0
........................................................... 12 24 36 48 60 72 84 96 108 120 132 144 156 168 180 A Y A g e in M o n t h s , x
We will assume that the time index "x" represents the time from the "average" accident date to the evaluation date. The details for approximating different exposure periods (e.g., accident year versus policy year) are given in Appendix B.
For convenience, the model will include two familiar curve forms: Weibull and Loglogistic. Each of these curve forms can be parameterized with a scale 0 and a shape co ("warp"). The Loglogistic curve is familiar to many actuaries under the name "inverse
t We are using the formofthe distribution function, but do not mean to imply any probabilistic model. The paper by Weissner [9] makes the report lag itself the random variable. By contrast, the loss dollars will be the random variable in our application.
45
power" (see Sherman 2 [8]), and will be considered the benchmark result. The Weibull will generally provide a smaller "tail" factor than the Loglogistic.
The Loglogistic curve has the form:
O(xlo~,0)
-
x~
LDF x
x~ +0 ~
=
l+O'°.x ,~
The Weibull curve has the form:
G(xlco,O)
=
1-exp(-(x/O)
'°)
In using these curve forms, we are assuming that the ~
loss emergence will move
from 0% to 100% in a strictly increasing pattern. The model will still work if some actual points show decreasing losses, but if there is real expected negative development (e.g., lines of business with significant salvage recoveries) then a different model should be used.
There are several advantages to using parameterized curves to describe the expected emergence pattern. First, the estimation problem is simplified because we only need to estimate the two parameters. Second, we can use data that is not strictly from a triangle with evenly spaced evaluation dates - such as the frequent case in which the latest diagonal is only nine months from the second latest diagonal. Third, the final indicated pattern is a smooth curve and does not follow every random movement in the historical age-to-age factors.
The next step in estimating the amount of loss emergence by period is to apply the emergence pattern G(x), to an estimate of the ultimate loss by accident year.
Our model will base the estimate of the ultimate loss by year on one of two methods: either the LDF or the Cape Cod method. The LDF method assumes that the ultimate loss
2 Sherman actually applies the inverse power curve to the link ratios between ages. Our model will apply this curve to the age-to-ultimate pattern.
46
amonnt in each accident year is independent of the losses in other years. The Cape Cod method assumes that there is a known relationship between the amount of ultimate loss expected in each of the years in the historical period, and that this relationship is identified by an exposure base. The exposure base is usually onlevel premium, but can be any other index (such as sales or payroll), which is reasonably assumed to be proportional to expected loss.
The expected loss for a given period will be denoted:
/-/Ar;~,y
=
expected incremental loss dollars in accident year A Y between ages x and y
Then the two methods for the expected loss emergence are:
Method # 1:
U......
=
"Cape Cod"
Premium Ar .ELR .[G(y Ito,0 ) -
Three parameters:
Method #2:
PAr....
=
G(xl to,0)]
ELR, to, 0
"LDF"
UZTAr[a(ylto,o)-a(xlto, O)]
n+2 Parameters:
n Accident Years (one
ULT for each AY) + to, 0
While both of these methods are available for use in estimating reserves, Method # 1 will generally be preferred. Because we are working with data summarized into annual blocks as a development triangle, there will be relatively few data points included in the
47
model (one data point for each "cell" in the triangle). There is a real problem with overparameterization when the LDF method is used.
For example, if we have a triangle for ten accident years then we have provided the model with 55 data points. Fhe Cape Cod method requires estimation of 3 parameters, but the LDF method requires estimation of 12 parameters.
The Cape Cod method may have somewhat higher process variance estimated, but will usually produce a significantly smaller estimation error. This is the value of the information in the exposure base provided by the user 3. In short: the more information that we can give to the model, the smaller the reserve variability due to estimation error.
The fact that variance can be reduced by incorporating more information into a reserve analysis is, of course, the point of our ironic subtitle: How to Increase Reserve Variability with Less Data. The point is obvious, but also easy to overlook. The reduction in variability is important even to those who do not explicitly calculate reserve ranges because it still guides us towards better estimation methods: lower variance implies a better reserve estimate.
3 Halliwell [2] provides additional arguments for the use of an exposure index. See especially pages 441 443.
48
Section 2:
The Distribution of Actual Loss Emergence and Maximum Likelihood
Having defined the model for the expected loss emergence, we need to estimate the "best" parameters for that model and, as a secondary goal, estimate the variance around the expected value. Both of these steps will be accomplished making use of maximum likelihood theory.
The variance will be estimated in two pieces: process variance (the "random" amount) and parameter variance (the uncertainty in our estimator).
2.1 Process Variance The curve
G(x[ to,0) represents the exoected loss emergence pattern. The actual loss
emergence will have a distribution around this expectation.
We,assume that the loss in any period has a constant ratio of variance/mean4:
Variance= Mean
t72 where
1 ~(CAr~--I.tar~) 2 n - p ~,t" -I.t--~rj p
= # of parameters
Car,t = actual incremental loss emergence #arj
= expected incremental loss emergence
(this is recognized as being equivalent to a chi-square error term)
For estimating the parameters of our model, we will further assume that the actual incremental loss emergence "c" follows an over-dispersed Poisson distribution. That is, the loss dollars will be a Poisson random variable times a scaling factor equal to a 2 .
4This assumptionwill be tested by analysisof residualsin our example.
49
Standard Poisson:
Pr(x)
Actual Loss:
Pr(c)
-
x!
E[x] = Var(x) = 2.
.~ c' °2 . e 2
c = x.cr2
(clef2)!
E[c] = R.
- 0 .2 . i -a
The scale factor a 2 is again estimated as above:
n - p 7~.,
#~r~
The second derivative matrix for "LDF Method" is (n+2)x(n+2) and assumes that there is a different ULT for each accident year.
The information matrix, I , is given as:
are calculating the variance in the ~ o f the parameter; the parameter itself does not have any variance. Nonetheless, we will retain the term "parameter variance" as shorthand. 6 To be precise, we
53
•0Zgl,, 0
[y~
o gO+g2,, z.....-TW:'. ~2 , aL]Lr~
...
o
"'"
0
02el+,
i,+~L+,+++ 1 O+G,'
[Z, awr~ao)
__ O+e,,,
+ ~ ' ~ O+Q,,
]
, auLr~a~
I I
~2p •.
0++'.+ I; a2e',' , a~autr,
v' 0++++,' Y a2e2'
+
v
...
~2g
~
,it
v
y_+ ++e,.,
'
02p n.t
nA
_a+++,,
E a~e"'
, a~aUtT~
-
_a+.++.,
vt O0)
.,
E £~
-a2e"
.,, azaco
~
, a~OULT.
The covariance matrix Z is again calculated using the inverse of the Information matrix, but for the LDF Method this matrix is larger.
2.4 The Variance of the Reserves
The final step is to estimate the variance in the reserves. The variance is broken into two pieces: the process variances and the estimation error (loosely "parameter variance"). For an estimate of loss reserves R for a given period
I-Gr:+,y, or group of periods ~/zAr;x,y,
the process variance is given by:
Process Variance of R :
~
2
• YdzAr:~,y
The estimation error makes use of the covariance matrix E calculated above: t
Parameter Variance of R:
Var(E[R])
:
(OR) • E. (OR)
where iI
~OR aR aR\ OR =
\577-~,5~-,5~+~/)
,[ +n ] or
54
OR =
n
aR
X
OR,
,\15~+7/~- f '5-0-'5~+.~/
:
The future reserve R, under the Cape Cod method is given by:
Reserve:
R
EPrerrfitani.ELR.(G(yi)-G(x,))
=
The derivatives needed are then easily calculated:
OR OELR
l
~pl~l~unli.(a(yi)la(xi))
-R : 2 ~ . m ~0
'
ELRf ?G