1
Learning Multi-Scale Deep Features for High-Resolution Satellite Image Classification Qingshan Liu, Senior Member, IEEE, Renlong Hang, Huihui Song, Zhi Li
arXiv:1611.03591v1 [cs.CV] 11 Nov 2016
Abstract In this paper, we propose a multi-scale deep feature learning method for high-resolution satellite image classification. Specifically, we firstly warp the original satellite image into multiple different scales. The images in each scale are employed to train a deep convolutional neural network (DCNN). However, simultaneously training multiple DCNNs is time-consuming. To address this issue, we explore DCNN with spatial pyramid pooling (SPP-net). Since different SPP-nets have the same number of parameters, which share the identical initial values, and only fine-tuning the parameters in fully-connected layers ensures the effectiveness of each network, thereby greatly accelerating the training process. Then, the multi-scale satellite images are fed into their corresponding SPP-nets respectively to extract multi-scale deep features. Finally, a multiple kernel learning method is developed to automatically learn the optimal combination of such features. Experiments on two difficult datasets show that the proposed method achieves favorable performance compared to other state-of-the-art methods.
Keywords Deep convolutional neural networks, spatial pyramid pooling, multi-scale deep features, feature fusion, multiple kernel learning, satellite image classification.
I.
I NTRODUCTION
Remote sensing image classification has been an active research topic in the past few decades, and most of the existing works primarily focus on pixel-wise classification, which assigns label information to each pixel in a multi-spectral or hyper-spectral image [1][2][3][4]. Although significant progress has been made in this area, pixels are not enough for the entire image understanding because they have few Q. Liu, H. Song and Z. Li are with the Jiangsu Key Laboratory of Big Data Analysis Technology, the School of Information and Control, Nanjing University of Information Science and Technology, Nanjing 210044, China (
[email protected]). R. Hang is with the Jiangsu Key Laboratory of Big Data Analysis Technology, the School of Atmospheric Science and School of Information and Control, Nanjing University of Information Science and Technology, Nanjing 210044, China (renlong
[email protected]).
2
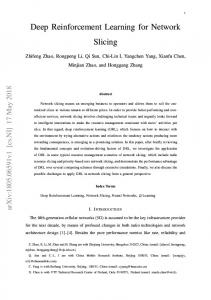
semantic meanings [5]. With the development of imaging techniques, large amounts of high spatial resolution satellite images become available [6][7][8], which opens new possibilities in remote sensing image analysis and classification. However, satellite images with high spatial resolution pose many challenging issues in image classification. First, the enhanced resolution brings more details, thus simple low-level features (e.g., intensity and textures) widely used in the case of low-resolution images are insufficient in capturing efficiently discriminative information [7]. For instance, Figs. 1 (a) and (b) have similar color and texture features, but they belong to different categories (i.e., runway and freeway), which can be discriminated by adding the car information. Second, objects in the same type of scene might have different scales and orientations [9]. As shown by Figs. 1 (c) and (d), the airplane in (d) is much smaller than that in (c), and their orientations are also different. Besides, high-resolution satellite images often consist of many different semantic classes, which makes further classification more difficult [10]. Taking Fig. 1 (e) for example, the commercial scene comprises roads, buildings, trees, parking lots, etc. Thus, developing efficient feature representations is critical for solving these issues.
(a) runway
(b) freeway
(c) airplane
(d) airplane
(e) commercial
Fig. 1: A few examples of high-resolution satellite images.
There have two popular feature representation models that are successfully used in satellite image classification. One is the Bag of Visual Words (BOVW) model [11][12][13], which generally includes three steps: 1) extracting man made visual features, such as SIFT [14] and HOG [15] descriptors; 2) clustering features to form visual words (clustering centers) by using k-means or other clustering methods; 3) mapping visual features to the closest word and generating a mid-level feature representation by word histograms.
3
This model and its variants have been investigated in satellite image classification [16][10]. However, it is an orderless collection of local descriptors, regardless of spatial information. To overcome this drawback, spatial pyramid matching (SPM) method was proposed in [17], in which the image is firstly partitioned into increasingly fine sub-regions and then histograms of local features are extracted inside each sub-region. Since satellite imagery generally does not have an absolute reference frame, the relative spatial arrangement of the image elements becomes very important. Accordingly, the authors in [8] proposed the spatial pyramid co-occurrence, which characterizes both the photometric and geometric information of an image. Unlike dividing the image into uniform cells in [8] and [17], the authors in [18] proposed the randomized spatial partition to characterize various image layout. Feature representation based on sparse coding (SC) is the other popular method for scene classification [19][20]. Its basic idea is that the original signal can be sparsely reconstructed with respect to some fixed bases (dictionary) and the selected bases (training samples) are enforced into as few categories as possible. In [6], a two-layer SC was proposed for satellite image classification. In [9], Sheng et al. proposed to use SC to generate three mid-level representations based on SIFT, local ternary pattern histogram fourier (LTP-HF) and colour histogram features, respectively. Recently, an unsupervised dictionary learning method has been proposed in [10] which achieves favorable performance in satellite image classification. Although these methods have achieved promising results in satellite image classification, there still exist some shortcomings. For the BOVW models, a key step is how to extract low-level visual features. This process is generally hand-crafted and heavily depends on experience and domain knowledge of designers. For the SC models, they can be considered as a single-layer feature learning architecture, which automatically selects a few vectors from a large pool of possible bases to encode an input signal [21][22]. As discussed in [23], the shallow architectures have shown effectiveness in solving many simple or well-constrained problems, but their limited modeling and representational power are insufficient in complex scene cases like the high resolution satellite images. Besides, SC focuses on searching for sparse representation of the original images, which may lose helpful discriminative information for the subsequent supervised classification.
4
Recently, deep learning, especially DCNN, has attracted increasing attention in natural image processing [22]. The core idea is to hierarchically learn high-level semantic features without human interactions. In 2012, Krizhevsky et al. designed a DCNN architecture based on two GPUs with multiple convolutional and fully-connected layers [24]. This architecture achieved excellent classification results on the ImageNet 2012 Large Scale Visual Recognition Challenge. Afterwards, a large amount of works about DCNN sprang up [25][26][27][28][29][30]. In [30], He et al. proposed SPP-net to solve the size constraint problem of input images, which exists in most DCNN architectures. Benefiting from spatial pyramid pooling, SPP-net can be trained faster and achieves higher performance than DCNN. In the field of remote sensing image processing, to the best of our knowledge, there are only a few literatures about DCNN [31] mainly because it is difficult to acquire a large amount of training samples. In this paper, we employ SPP-net to automatically extract multi-scale deep features of high-resolution satellite images. As shown in Figs. 1 (c) and (d), the scales of objects in satellite images often vary. Traditional DCNNs are not able to sufficiently explore this information, because they can only extract the deep features of images from a pre-defined scale (e.g., 224×224). We therefore attempt to construct multiple DCNNs with different input scales to address this issue. However, it is well known that training a deep model costs much time, not to mention training multiple models simultaneously. Benefiting from spatial pyramid pooling, SPP-net can generate a fixed-length representation regardless of image size/scale. In other words, SPP-nets with different input image scales can exactly share the same weight parameters [32]. Besides, for each SPP-net, fine-tuning the parameters in fully-connected layers ensures an efficient network, thus greatly accelerating the training process. Therefore, we choose SPP-net as our basic deep model. Because of the large numbers of parameters and scarce of training samples, the SPP-net inevitably poses overfitting problem. We therefore take advantage of the training results using ImageNet dataset. Afterwards, we use the trained SPP-nets to extract multi-scale deep features. In the subsequent classification process, to optimally fuse such features, we develop a multiple kernel learning method. The major contributions of this paper are summarized as follows:
5
1 Warping
2
…
…
… …
…
…
…
Input satellite image
Multi-scale images
Feature extraction
Multi-kernel learning for feature fusion
Fig. 2: Flowchart of the proposed method.
1)
To effectively apply SPP-nets, a pre-training method using ImageNet dataset is proposed to address the small sample size issue in high-resolution satellite image classification.
2)
Since the scales of objects in satellite images often vary, multiple SPP-nets are successfully applied to capture such information. Each SPP-net corresponds to one-scale images.
3)
Multi-scale deep features represent multi-level abstract information of satellite images. In order to automatically combine these features for the subsequent classification, we propose a multiple kernel learning method. Numerous experimental results certify the effectiveness and superiority of the proposed method.
The rest of this paper is organized as follows. In Section II, we present the proposed method in detail, including the SPP-net architecture, the training method of the architecture and the multiple kernel learning framework. The experiments are reported in Section III, followed by the conclusion in Section IV.
II.
M ETHODOLOGY
The flowchart of the proposed method is shown in Fig. 2. The whole procedure includes three steps: 1) warping the original satellite images into multiple scales; 2) multi-scale deep features extraction using multiple SPP-nets; 3) multi-scale deep features fusion via a multi-kernel learning method. In the following subsections, we introduce the last two steps in detail.
6
Fig. 3: The architecture of SPP-net.
A. SPP-net architecture SPP-net was firstly proposed in [30] to address the size issue of input images. Here, we use it to automatically learn multi-scale deep features of high-resolution satellite images. Specifically, we combine the prevalent seven-layer architecture in [24] with spatial pyramid pooling (SPP). The designed architecture is shown in Fig. 3. The network contains five successive convolutional layers and two fully-connected layers. The first two convolutional layers are followed by max-pooling operators. They operate in a slidingwindow manner and output feature maps representing the spatial layout of the responses. Before the first fully-connected layer, SPP is exploited to pool the features from the last convolutional layer. Similar to SPM [17], we partition the feature maps into increasingly fine sub-regions, and pool the responses inside each sub-region (throughout this paper, we use max pooling). Assume the size of each feature map after the last convolutional layer is a×a pixels and each feature map is partitioned into n×n sub-regions. Then, SPP can be considered as convolution operators in a sliding-widow manner with window size win = da/ne and stride str = ba/nc , where d·e and b·c denote ceiling and floor operators, respectively. Fig.3 demonstrates a threelevel SPP configuration by setting n × n as 1 × 1, 2 × 2 and 4 × 4, respectively. The final output of SPP is to concatenate these three-level pooling results into a vector. This simple pooling operator largely reduces the number of parameters needed to be trained between the last convolution layer and the first fully-connected layer. Thus, it is faster to train SPP-net than the traditional DCNNs. Besides, SPP extracts multi-resolution information from the last convolutional layer, which improves the final classification results. Despite the
7
Source Task C1 —C2—C3—C4—C5
FC1—FC2
Labels
ImageNet Transfer Parameters Fine-tuning with training samples C1 —C2—C3—C4—C5
Satellite images
SPP
FC1—FC2
Labels
Target Task
Fig. 4: The detailed training process of our method.
varying sizes of input images, which leads to the varying sizes of feature maps at each convolutional layer, the lengths of input vectors to the first fully-connected layer remain the same. This property ensures that the number of parameters remains unchanged. Therefore, the multiple SPP-nets are capable of sharing the same initial parameters.
B. Training method The above network contains more than 30 millions of parameters. Training such a network needs large amounts of samples. A canonical dataset widely used in the DCNN architectures is ImageNet, consisting of millions of images. However, only hundreds of samples are available for high-resolution satellite image classification, which is far less than ImageNet. This is the main reason why DCNN has not been successfully used in the remote sensing image processing. The most intuitional method to enlarge the number of training samples is via cropping and flipping operators [24][30]. However, it is still far from enough to train an efficient network. Recently, the authors in [33] proposed to transfer image representations learned with DCNN on large datasets to other visual recognition tasks with limited training data. Motivated by this work, we propose to firstly pre-train the network in [24] using auxiliary ImageNet 2012 dataset (Source task), and then fine-tune our SPP-nets by employing the training samples from satellite images (Target task).
8
The training procedure of source task is carried out via the open source Caffe DCNN library [34]. Specifically, multinomial logistic regression function is optimized using stochastic gradient descent algorithm based on the back propagation method [35]. The batch size and momentum are set to 256 and 0.9, respectively. The training is regularized by weight decay of 0.0005 and dropout operators for the two fully-connected layers (dropout ratio is set to 0.5). The initial learning rate is set to be 0.01. This value is fixed and used to update iteratively the weights. At each iteration, we calculate the classification accuracy of the validation set. When the accuracy stops increasing, we divide the learning rate by 10, and this new value is used to update the weights. The whole process is repeated until convergence. In our experiments, the learning rate reduces 3 times prior to termination (after 370K iterations) and the weights in each layer are initialized from a zero-mean Gaussian distribution with standard deviation σ = 0.01. After the pre-training of source task, the weight parameters learned in the five convolutional layers are then transferred to the target task and kept fixed. For the target task, we only need to fine-tune the last three layers (i.e., two fully-connected layers and output layer). The whole process is demonstrated in Fig. 4. It is worth noting that the source task is pre-trained only once, and the source task along with the target task share the same initial parameters, which means that the learned parameters from the source task are directly transferred to the multiple SPP-nets. For each SPP-net, the parameters of fully-connected layers are fine-tuned by the training samples of satellite images while other parameters remain the same. After training the networks, the multi-scale images are fed into their corresponding networks to extract multi-scale deep features. C. Multiple kernel learning With the extracted multi-scale deep features, the intuitive way of integrating these features is to concatenate them into a vector. This method is based on the assumption that all features have the same contribution to the subsequent classification, which obviously is not true in most cases. Besides, the formed high-dimensional feature space not only increases the computational burden, but also induces the overfitting problem. Multiple kernel learning (MKL) has been proved to be an efficient method to combine different features for remote sensing image classification [36][37][38][39]. In this paper, the extracted multi-scale
9
deep representations can be considered as different features of an image. So we employ MKL to integrate these multi-scale features. Assume the extracted multi-scale features are denoted as X = {x1 , x2 , · · · , xN }, where xi ∈ Rd and N is the number of samples. Then we map the input space to higher space as follows:
φ : Rd → F
x → φ(x),
(1)
where φ is a non-linear mapping function and F is the corresponding mapped feature space. Via this non-linear mapping, the non-separable problem in R is transformed separable in F . Nonetheless, directly computing φ is nontrivial, but we can calculate the dot product in the high-dimensional space via kernel trick, which can be expressed as K(xi , xj ) = hφ(xi ), φ(xj )i, where the operator h·i means inner product, and K(·) denotes kernel function. Before introducing the proposed multiple kernel learning method, we first consider the binary classification problem. Given the labeled training samples {(xi , yi ), i = 1, 2, · · · , N }, where yi ∈ {−1, +1}, support vector machine (SVM) aims at searching for a linear decision function f (x) = hω, φ(x)i + b maximizing the margin. It is well known that minimizing the norm of the parameters 1/2kωk2 under the constraint yi (hω, φ(x)i + b) ≥ 1 maximizes the margin. Such a minimization of the weights provides a naturally regularized solution, which favors smooth models of optimal complexity and avoids overfitting the data. The dual problem of SVM can be written as:
max W (αi , αj ) =
N X i=1
s.t.
N
0 ≤ αi ≤ C, i = 1, 2, · · · , N, N X
N
1 XX αi − αi αj yi yj K(xi , xj ), 2 i=1 j=1 (2)
αi yi = 0,
i=1
where αi and αj are Lagrange multipliers, and if αi is nonzero, the corresponding xi is called support vector, which determines the decision hyperplane.
10
The core idea of multiple kernel learning is to replace the single kernel K in Eq. (2) with a linear combination of M kernels: K(xi , xj ) =
M X
dm Km (xi , xj ),
m=1
s.t.
dm ≥ 0,
M X
(3) dm = 1,
m=1
where M is the number of candidate basis kernels, and dm is the weight for the m-th basis kernel. In this paper, M is particularly set as the number of scales, and each basis kernel exploits the features in one scale. Thus, the objective function can be rewritten as: max W (αi , αj ) =
N X
αi −
i=1
s.t.
N X
N N M X 1 XX dm Km (xi , xj ), αi αj yi yj 2 i=1 j=1 m=1
αi yi = 0, (4)
i=1
0 ≤ αi ≤ C, i = 1, 2, · · · , N, dm ≥ 0,
M X
dm = 1.
m=1
To simultaneously optimize the combining weights dm , αi and αj , we adopt the SimpleMKL algorithm, which was firstly proposed in [40]. Because the objective function in (4) is convex and differentiable, dm is optimized by using gradient ascend method. The gradient equals to the derivatives of W : N
N
∂W 1 XX =− αi αj yi yj Km (xi , xj ), ∂dm 2 i=1 j=1
m = 1, 2, · · · , M.
(5)
Then, dm is updated as follows: dm = dm + γ
∂W , ∂dm
(6)
where γ is the step length. Note that the gradient is updated only when the objective value decreases during the iterative process. This updating procedure is repeated until the stopping criterion is satisfied.
11
(a) airplane
(b) baseball diamond
(c) buildings
(d) dense residential
(e) forest
(f) golf course
(g) harbor
(h) intersection
Fig. 5: Some image examples in 21-Class-Land-Use dataset.
III.
E XPERIMENTS
To evaluate the proposed method, we compare it with several state-of-the-art approaches on two widely used data sets: 21-Class-Land-Use [8] dataset and 19-Class Satellite Scene [6][7] dataset.
A. 21-Class-Land-Use dataset 1) Data description: This dataset was manually extracted from aerial orthoimagery downloaded from the United States Geological Survey (USGS) National Map. It consists of 21 different land use and land cover classes, including agricultural, airplane, baseball diamond, beach, buildings, chaparral, dense residential, forest, freeway, golf course, harbor, intersection, medium density residential, mobile home park, overpass, parking lot, river, runway, sparse residential, storage tanks and tennis courts. Each class contains 100 RGB images with pixel resolution of one foot (i.e., 0.3 m) and image size of 256 × 256 pixels. Fig. 5 shows some image examples from the 21 classes. 2) Experimental setup: In each experiment, besides the original scale, the images are warped into two different scales, including 128×128 and 192×192 pixels. In multiple kernel learning step, one linear kernel is learned in each scale to map the corresponding features. For training and testing, the images in each class are randomly split into two sets. In training stage, we use the training set to fine-tune the SPP-nets and train the linear SVMs, where the SVMs are implemented using the LIBSVM package, and one-against-all
12
TABLE I: OAs (%) and standard deviations of SPP-nets with different layer features under different number of training samples on 21-Class-Land-Use dataset. Scales 128 × 128
192 × 192
256 × 256
Numbers 5 50 80 5 50 80 5 50 80
conv5 62.93 ± 2.55 85.12 ± 0.81 86.81 ± 1.18 67.20 ± 1.81 85.37 ± 0.82 86.81 ± 1.18 57.40 ± 1.92 84.99 ± 0.88 88.17 ± 0.78
conv5+spp 63.96 ± 2.52 87.98 ± 0.50 88.81 ± 0.94 70.27 ± 1.96 89.77 ± 0.79 88.81 ± 0.94 67.89 ± 1.44 89.70 ± 0.52 91.67 ± 1.11
fc6 60.99 ± 2.37 86.79 ± 0.64 85.98 ± 1.65 65.45 ± 1.68 88.66 ± 0.70 89.88 ± 1.16 65.99 ± 1.84 88.35 ± 0.65 90.62 ± 0.89
fc7 60.41 ± 2.20 85.18 ± 0.50 85.98 ± 1.65 65.14 ± 2.02 86.25 ± 0.81 87.64 ± 0.92 64.58 ± 1.64 86.44 ± 0.52 87.95 ± 1.15
strategy is adopted to address the multi-class issue. The performance of classifiers are then evaluated on the testing set. In order to reduce the effect of random selection, we repeat each algorithm on ten different training/testing split of the data set and report means and standard deviations of the obtained accuracies. 3) Each layer performance: To assess which layer is the best for our task, similar to [41], we analyze and compare the results of the last four feature layers. For simplicity, we name them conv5, conv5+spp, fc6 and fc7. Fig. 6 shows the mean overall accuracies (OAs) and standard deviations using features from different layers at three scales versus different number of training samples. From this figure, we can conclude that the OAs are improved as the number of training samples increases. Besides, fc6 is better than conv5 and fc7 in most cases, which is consistent with the conclusion in [41]. However, with the spatial pyramid pooling, conv5+spp improves the performance significantly as compared to conv5, and achieves better results than fc6. Table I demonstrates the detailed quantitative results using 5, 50 and 80 training samples from each class, respectively. The bold fonts indicate the best results with respect to different number of training samples under one scale. In common with Fig. 6, the features from conv5+spp layers achieve the highest accuracies in most of the cases. Thus, we use the features from conv5+spp for the subsequent multi-scale feature fusion via MKL. 4) The efficiency of MKL: To examine the performance of our proposed MKL fusion method, we compare it with the single scale method and the traditional fusion method, i.e., stacking the multi-scale deep features into one vector (SV). Fig. 7 demonstrates the classification results using different number of
0.95
0.95
0.95
0.9
0.9
0.9
0.85
0.85
0.85
0.8
0.8
0.75
0.75
0.7
0.7 fc7 fc6 conv5 conv5+spp
0.65 0.6 0.55 0
0.8 OA
OA
OA
13
0.7 fc7 fc6 conv5 conv5+spp
0.65 0.6 0.55 0
20 40 60 80 Number of labeled images in each class
(a)
0.75
20 40 60 80 Number of labeled images in each class
(b)
fc7 fc6 conv5 conv5+spp
0.65 0.6 0.55 0
20 40 60 80 Number of labeled images in each class
(c)
Fig. 6: OAs and standard deviations of SPP-nets at three different scales under different number of training samples on 21-Class-Land-Use dataset. (a) 128 × 128 scale. (b) 192 × 192 scale. (c) 256 × 256 scale.
TABLE II: The detailed classification results comparison between single scale features and two different multi-scale feature fusion methods on 21-Class-Land-Use dataset. Numbers Conv5+spp-128 Conv5+spp-192 Conv5+spp-256 Conv5+spp+SV Conv5+spp+MKL
5 63.96 ± 2.52 70.27 ± 1.96 67.89 ± 1.44 70.57 ± 2.06 75.33 ± 1.86
50 87.98 ± 0.50 89.77 ± 0.79 89.70 ± 0.52 90.73 ± 0.76 95.72 ± 0.50
80 88.81 ± 0.94 88.81 ± 0.94 91.67 ± 1.11 91.38 ± 0.46 96.38 ± 0.92
training samples with features from conv5+spp layers. From this figure, we can observe that SV method achieves higher classification accuracies than the single scale features, which can be explained that multiscale deep features represent different abstracts of the original images and simultaneously using these complementary information thereby improves the classification results. Another obvious observation is that 1 0.95 0.9
OA
0.85 0.8 0.75 0.7 0.65 0
conv5+spp-128 conv5+spp-192 conv5+spp-256 conv5+spp+SV conv5+spp+MKL 20 40 60 80 Number of labeled images in each class
Fig. 7: OAs and standard deviations of MKL versus SV and the single scales using conv5+spp features under different number of training samples on 21-Class-Land-Use dataset.
14
MKL method significantly boosts the classification results as compared to SV. The reason can be attributed to the fact that MKL automatically learns the optimal combination among multi-scale deep features, while SV simply assumes that the features in all scales play the same role. The quantitative results in Table II support the conclusions in Fig. 7, which further confirms the efficiency of our proposed fusion method. TABLE III: Overall classification accuracy (%) comparison on the 21-Class-Land-Use dataset. Numbers SSEP [42] Partlets-based method [5] SC+Pooling [10] BOVW [8] SPCK++ [8] SPMK [17] MKL [43] UFL [44] SPP-net SPP-net+SV SPP-net+MKL
5 65.34 ± 2.01 − − − − − 64.78 ± 1.62 − 70.27 ± 1.96 70.57 ± 2.06 75.33 ± 1.86
50 − 88.76 ± 0.79 − − − − 88.68 ± 1.10 − 89.77 ± 0.79 90.73 ± 0.76 95.72 ± 0.50
80 − 91.33 ± 1.11 81.67 ± 1.23 71.68 77.38 74.00 91.26 ± 1.17 90.26 ± 1.51 91.67 ± 1.11 91.38 ± 0.46 96.38 ± 0.92
5) Comparison with the state-of-the-arts: To demonstrate the superiority of the proposed method, we compare with several state-of-the-art approaches, including SSEP [42], Partlets-based method [5], SC+Pooling [10], BOVW [8], SPCK++ [8], SPMK [17], MKL [43] and UFL [44]. The classification results with different number of training samples are shown in table III, where ‘−’ denotes there are no experiments. From this table, we can observe that SPP-net with the best single scale feature achieves higher accuracies than all comparison methods. This implies that deep learning method learns more powerful features. Besides, the combination of multi-scale deep features further improves the performance. Specifically, SPP-net+MKL boosts the performance dramatically by 15%, 8% and 6% in comparison with the existing best results when the number of training samples are 5, 50 and 80, respectively. To the best of our knowledge, these results are the best on this data set, which adequately show the superiority of our proposed method. In addition, we also compare SPP-net+MKL with two recently proposed state-of-the-art approaches by evaluating the accuracy in each class, which is shown in Fig. 8. From Fig. 8(a), we observe that SSEP gets a little better performance than SPP-net+MKL in 6 classes. This is because SSEP method takes advantage of sampling
15
technique to indirectly increase the number of training samples while SPP-net+MKL only uses the given training samples. Nevertheless, SPP-net achieves higher accuracies in the rest of 15 classes. Similarly, Fig. 8 (b) demonstrates that SPP-net+MKL obtains higher performance in 19 classes compared to Partlets-based method in [5]. For further analysis of the classification results achieved by SPP-net+MKL, we use confusion matrices shown in Fig. 9 to illustrate one of the results in ten experiments when the number of training samples is 5 and 50, respectively. The ith row and jth column element in confusion matrix denotes the rate of test samples from the ith class classified to the jth class. In the case of 5 training samples as shown in Fig. 9 (a), the most difficult classes to discriminate contain dense residential, Runway, medium residential and storage tanks whose accuracies are all lower than 60%. For instance, as shown in Fig. 10, the dense residential is easily misclassified as mobile home park and medium residential since they share similar building structures. However, when the number of training samples increases to 50, the accuracies of these classes improve significantly. This indicates that the number of training samples is a key factor for SPP-net+MKL. 1 0.8 0.6 0.4 0.2 0 0
5
10
15
SPP-net+MKL SSEP 20 25
15
SPP-net+MKL Partlets-based 20 25
(a) 1 0.8 0.6 0.4 0.2 0 0
5
10
(b)
Fig. 8: Each class accuracy comparison between two methods on 21-Class-Land-Use dataset: (a) SSEP in [42] and SPP-net+MKL using 5 training samples; (b) Partlets-based method in [5] and SPP-net+MKL using 50 training samples.
16
2
3
4
5
6
7
8
9
10
11
12
13
14
15
16
17
18
19
20
21
(a)
1 0.9 0.8 0.7 0.6 0.5 0.4 0.3 0.2 0.1 0
1 2 3 4 5 6 7 8 9 10 11 12 13 14 15 16 17 18 19 20 21
1.00 0.00 0.00 0.00 0.00 0.00 0.00 0.02 0.00 0.00 0.00 0.00 0.00 0.00 0.00 0.00 0.00 0.00 0.00 0.00 0.00
0.00 0.98 0.00 0.00 0.00 0.00 0.00 0.00 0.00 0.00 0.00 0.00 0.00 0.00 0.00 0.00 0.00 0.02 0.00 0.00 0.00
0.00 0.00 0.98 0.00 0.00 0.00 0.00 0.00 0.00 0.00 0.00 0.00 0.00 0.00 0.00 0.00 0.00 0.00 0.00 0.02 0.00
0.00 0.00 0.00 1.00 0.00 0.00 0.00 0.00 0.00 0.00 0.00 0.00 0.00 0.00 0.00 0.00 0.00 0.00 0.00 0.00 0.00
0.00 0.00 0.00 0.00 0.94 0.00 0.02 0.00 0.00 0.00 0.00 0.04 0.00 0.00 0.00 0.00 0.00 0.00 0.00 0.00 0.02
0.00 0.00 0.00 0.00 0.00 1.00 0.00 0.00 0.00 0.00 0.00 0.00 0.00 0.00 0.00 0.00 0.00 0.00 0.00 0.00 0.00
0.00 0.00 0.00 0.00 0.02 0.00 0.84 0.00 0.00 0.00 0.00 0.00 0.06 0.00 0.00 0.00 0.00 0.00 0.00 0.00 0.00
0.00 0.00 0.00 0.00 0.00 0.00 0.00 0.98 0.00 0.00 0.00 0.00 0.02 0.00 0.00 0.00 0.02 0.00 0.00 0.00 0.00
0.00 0.00 0.00 0.00 0.00 0.00 0.00 0.00 1.00 0.00 0.00 0.00 0.00 0.00 0.00 0.00 0.02 0.00 0.00 0.00 0.00
0.00 0.00 0.00 0.00 0.00 0.00 0.00 0.00 0.00 0.98 0.00 0.00 0.00 0.00 0.00 0.00 0.02 0.00 0.04 0.00 0.00
0.00 0.02 0.00 0.00 0.00 0.00 0.00 0.00 0.00 0.00 1.00 0.00 0.00 0.00 0.00 0.00 0.00 0.00 0.00 0.00 0.00
0.00 0.00 0.00 0.00 0.00 0.00 0.00 0.00 0.00 0.00 0.00 0.94 0.00 0.00 0.00 0.00 0.00 0.00 0.00 0.04 0.06
0.00 0.00 0.00 0.00 0.00 0.00 0.08 0.00 0.00 0.00 0.00 0.00 0.90 0.02 0.00 0.00 0.00 0.00 0.02 0.00 0.00
0.00 0.00 0.00 0.00 0.02 0.00 0.00 0.00 0.00 0.00 0.00 0.00 0.00 0.98 0.00 0.00 0.00 0.00 0.00 0.00 0.04
0.00 0.00 0.00 0.00 0.00 0.00 0.00 0.00 0.00 0.00 0.00 0.02 0.02 0.00 1.00 0.00 0.00 0.00 0.00 0.00 0.00
0.00 0.00 0.00 0.00 0.00 0.00 0.00 0.00 0.00 0.00 0.00 0.00 0.00 0.00 0.00 1.00 0.00 0.00 0.00 0.00 0.00
0.00 0.00 0.00 0.00 0.00 0.00 0.00 0.00 0.00 0.00 0.00 0.00 0.00 0.00 0.00 0.00 0.92 0.00 0.00 0.00 0.02
0.00 0.00 0.00 0.00 0.00 0.00 0.00 0.00 0.00 0.00 0.00 0.00 0.00 0.00 0.00 0.00 0.00 0.98 0.00 0.00 0.00
0.00 0.00 0.00 0.00 0.00 0.00 0.02 0.00 0.00 0.00 0.00 0.00 0.00 0.00 0.00 0.00 0.02 0.00 0.94 0.02 0.02
0.00 0.00 0.00 0.00 0.02 0.00 0.00 0.00 0.00 0.02 0.00 0.00 0.00 0.00 0.00 0.00 0.00 0.00 0.00 0.92 0.00
0.00 0.00 0.02 0.00 0.00 0.00 0.04 0.00 0.00 0.00 0.00 0.00 0.00 0.00 0.00 0.00 0.00 0.00 0.00 0.00 0.84 21
0.00 0.00 0.02 0.00 0.02 0.00 0.02 0.00 0.00 0.00 0.00 0.00 0.03 0.00 0.00 0.00 0.00 0.00 0.00 0.01 0.60
20
0.00 0.02 0.03 0.00 0.03 0.00 0.01 0.00 0.03 0.02 0.00 0.00 0.00 0.00 0.07 0.00 0.06 0.00 0.05 0.44 0.01
18
0.00 0.00 0.00 0.00 0.03 0.00 0.02 0.00 0.00 0.01 0.00 0.00 0.06 0.00 0.00 0.00 0.04 0.00 0.73 0.03 0.02
19
0.00 0.00 0.00 0.00 0.02 0.00 0.00 0.00 0.03 0.00 0.00 0.00 0.00 0.00 0.07 0.00 0.00 0.54 0.00 0.00 0.00
16
0.00 0.00 0.00 0.02 0.00 0.00 0.00 0.00 0.00 0.02 0.00 0.00 0.00 0.00 0.00 0.00 0.64 0.00 0.01 0.00 0.02
17
0.00 0.00 0.00 0.00 0.01 0.00 0.00 0.00 0.00 0.00 0.07 0.01 0.00 0.00 0.01 1.00 0.00 0.00 0.00 0.00 0.00
14
0.00 0.00 0.00 0.00 0.01 0.00 0.00 0.00 0.01 0.00 0.00 0.06 0.00 0.00 0.69 0.00 0.00 0.13 0.00 0.02 0.01
15
0.00 0.01 0.00 0.00 0.12 0.00 0.31 0.00 0.00 0.00 0.00 0.02 0.28 0.89 0.00 0.00 0.00 0.00 0.00 0.02 0.06
13
0.00 0.00 0.00 0.00 0.01 0.00 0.17 0.00 0.00 0.01 0.00 0.03 0.44 0.00 0.00 0.00 0.00 0.00 0.01 0.01 0.08
11
0.00 0.01 0.00 0.00 0.00 0.00 0.03 0.00 0.01 0.00 0.00 0.78 0.03 0.00 0.03 0.00 0.00 0.00 0.00 0.06 0.02
12
0.00 0.01 0.00 0.00 0.01 0.00 0.00 0.00 0.00 0.00 0.85 0.00 0.00 0.02 0.00 0.00 0.00 0.00 0.00 0.00 0.00
9
0.00 0.00 0.01 0.00 0.02 0.00 0.00 0.00 0.00 0.60 0.02 0.01 0.01 0.00 0.00 0.00 0.06 0.00 0.06 0.14 0.01
10
0.00 0.00 0.00 0.00 0.00 0.00 0.00 0.00 0.74 0.00 0.00 0.00 0.00 0.00 0.04 0.00 0.02 0.09 0.02 0.00 0.00
8
0.01 0.00 0.00 0.00 0.00 0.00 0.00 1.00 0.00 0.02 0.00 0.00 0.00 0.00 0.00 0.00 0.07 0.00 0.03 0.00 0.00
6
0.00 0.00 0.00 0.00 0.00 0.00 0.25 0.00 0.00 0.00 0.00 0.03 0.06 0.03 0.00 0.00 0.00 0.00 0.00 0.00 0.00
7
0.05 0.00 0.00 0.00 0.00 1.00 0.00 0.00 0.00 0.00 0.00 0.00 0.00 0.00 0.00 0.00 0.04 0.00 0.01 0.00 0.00
5
0.00 0.01 0.00 0.00 0.67 0.00 0.17 0.00 0.16 0.00 0.00 0.05 0.07 0.05 0.07 0.00 0.00 0.01 0.00 0.08 0.11
3
0.03 0.01 0.05 0.98 0.00 0.00 0.00 0.00 0.00 0.20 0.00 0.00 0.00 0.00 0.00 0.00 0.01 0.01 0.00 0.01 0.01
4
0.00 0.00 0.88 0.00 0.00 0.00 0.00 0.00 0.00 0.11 0.00 0.00 0.00 0.00 0.00 0.00 0.04 0.18 0.06 0.11 0.04
2
0.00 0.93 0.00 0.00 0.04 0.00 0.02 0.00 0.01 0.01 0.05 0.00 0.00 0.00 0.00 0.00 0.00 0.04 0.01 0.06 0.00
1
0.91 0.00 0.00 0.00 0.00 0.00 0.00 0.00 0.01 0.00 0.00 0.00 0.00 0.00 0.00 0.00 0.00 0.00 0.00 0.00 0.00 1
1 2 3 4 5 6 7 8 9 10 11 12 13 14 15 16 17 18 19 20 21
1 0.9 0.8 0.7 0.6 0.5 0.4 0.3 0.2 0.1 0
(b)
Fig. 9: Confusion matrix of SPP-net+MKL with conv5+spp features under (a) 5 training samples and (b) 50 training samples in each class on 21-Class Satellite Scene dataset. The rows and columns of the matrix denote actual and predicted classes, respectively. The class labels are assigned as follows: 1 = Agricultural, 2 = Airplane, 3 = Baseball diamond, 4 = Beach, 5 = Buildings, 6 = Chaparral, 7 = Dense residential, 8 = Forest, 9 = Freeway, 10 = Golf course, 11 = Harbor, 12 = Intersection, 13 = Medium residential, 14 = Mobile home park, 15 = Overpass, 16 = Parking lot, 17 = River, 18 = Runway, 19 = Sparse residential, 20 = Storage tanks, and 21 = Tennis court.
Fig. 10: Some misclassified images in 21-Class-Land-Use dataset. Top: Misclassified images in dense residential class. Middle: Some image examples of medium residential. Bottom: Some image examples of mobile home park.
B. 19-Class Satellite Scene dataset 1) Data description and experimental setup: The second dataset is composed of 19 classes of scenes, including airport, beach, bridge, commercial area, desert, farmland, football field, forest, industrial area, meadow, mountain, park, parking, pond, port, railway station, residential area, river and viaduct. Each class has 50 images, with size of 600 × 600 pixels. Such images are extracted from very large satellite
0.95
0.95
0.9
0.9
0.9
0.85
0.85
0.85
0.8 fc7 fc6 conv5 conv5+spp
0.75 0.7 0
5 10 15 20 25 Number of labeled images in each class
OA (%)
0.95
OA (%)
OA (%)
17
0.8 fc7 fc6 conv5 conv5+spp
0.75 0.7 0
30
(a)
5 10 15 20 25 Number of labeled images in each class
0.8 fc7 fc6 conv5 conv5+spp
0.75 0.7 0
30
(b)
5 10 15 20 25 Number of labeled images in each class
30
(c)
Fig. 11: OAs and standard deviations of SPP-nets at three different scales under different number of training samples on 19-Class Satellite Scene dataset. (a) 128 × 128 scale. (b) 192 × 192 scale. (c) 256 × 256 scale. 1 0.95
OA
0.9 0.85 0.8 0.75 0
conv5+spp-128 conv5+spp-192 conv5+spp-256 conv5+spp+SV conv5+spp+MKL 5 10 15 20 25 Number of labeled images in each class
30
Fig. 12: OAs and standard deviations of MKL versus SV and the single scales using conv5+spp features under different number of training samples on 19-Class Satellite Scene dataset.
images on Google Earth. Similar to 21-Class-Land-Use dataset, the original images are warped to three different scales: 128 × 128, 192 × 192 and 256 × 256. We construct two experiments. The first one is randomly choosing 5 images from each class as the training set, and the rest images are used as the testing set, following [9][42][43]. The second experiment randomly chooses 25 images as the training set and the rest as the testing set, following [9]. All experiments are repeated 10 times with different training/testing split to obtain stable results. The final performance is reported as the mean and standard deviation of the results from 10 runs. 2) Each layer performance: Similar to the first dataset, we evaluate the effect of different feature layers on the final performance. Fig. 11 shows the classification results at three different scales using conv5, conv5+spp, fc6 and fc7 features. From this figure, we can observe that conv5+spp achieves the highest OAs
18
TABLE IV: OAs (%) and standard deviations of SPP-nets with different layer features under different number of training samples on 19-Class Satellite Scene dataset. Scales 128 × 128 192 × 192 256 × 256
Numbers 5 25 5 25 5 25
conv5 73.01 ± 1.56 85.22 ± 0.97 75.25 ± 1.10 87.68 ± 1.08 74.80 ± 1.31 87.54 ± 1.25
conv5+spp 76.56 ± 0.92 87.26 ± 1.00 80.34 ± 0.80 90.13 ± 0.90 80.46 ± 1.47 90.27 ± 0.64
fc6 75.82 ± 1.03 87.16 ± 0.89 78.69 ± 0.92 89.66 ± 0.77 78.84 ± 0.80 89.57 ± 0.76
fc7 75.39 ± 1.12 87.16 ± 0.89 77.60 ± 0.85 89.12 ± 0.85 77.53 ± 1.25 88.94 ± 0.78
TABLE V: The detailed classification results comparison between single scale features and two different multi-scale feature fusion methods on 19-Class Satellite Scene dataset. Numbers Conv5+spp-128 Conv5+spp-192 Conv5+spp-256 Conv5+spp+SV Conv5+spp+MKL
5 76.56 ± 0.92 80.34 ± 0.80 80.46 ± 1.47 80.92 ± 1.16 85.22 ± 1.22
25 87.26 ± 1.00 90.13 ± 0.90 90.27 ± 0.64 90.48 ± 0.87 95.07 ± 0.79
as well as in the first dataset compared to the other three features, which is also demonstrated in Table IV. Besides, we observe that the OAs on this dataset are higher than that on the first dataset under the same number of training samples. This is because this dataset is easier to discriminate and the number of testing set is smaller than that in the first dataset. Fig. 12 and Table V compare the performance between single scale conv5+spp features and two multi-scale fusion methods. Obviously, the performance of SV is only a little better than that of 192 × 192 and 256 × 256 scales. However, MKL displays significant improvements in comparison with SV, which confirms the effectiveness of MKL fusion method. TABLE VI: Overall classification accuracy (%) comparison on the 19-Class Satellite Scene dataset. Numbers SSEP [42] SCMF [9] MKL [43] SPP-net SPP-net+SV SPP-net+MKL
5 73.82 ± 1.52 78.32 67.32 ± 2.90 80.46 ± 1.47 80.92 ± 1.16 85.22 ± 1.22
25 − 90.05 − 90.27 ± 0.64 90.48 ± 0.87 95.07 ± 0.79
19 1 0.8 0.6 0.4 0.2 0 0
2
4
6
8
10
12
SPP-net+MKL SSEP 16 18 20
14
Fig. 13: Each class accuracy comparison between SPP-net+MKL and SSEP in [42] using 5 training samples.
1 0.82 0.00 0.02 0.00 0.00 0.00 0.00 0.04 0.00 0.00 0.04 0.00 0.02 0.00 0.00 0.00 0.02 0.00 0.02 2 0.00 0.96 0.00 0.00 0.04 0.00 0.00 0.00 0.00 0.00 0.00 0.00 0.00 0.00 0.00 0.00 0.00 0.00 0.00 3 0.00 0.00 0.80 0.00 0.04 0.07 0.00 0.00 0.00 0.00 0.00 0.00 0.00 0.00 0.00 0.00 0.00 0.02 0.07 4 0.00 0.00 0.00 0.84 0.00 0.00 0.00 0.07 0.00 0.00 0.02 0.00 0.00 0.00 0.07 0.00 0.00 0.00 0.00
1
2 0.00 1.00 0.00 0.00 0.00 0.00 0.00 0.00 0.00 0.00 0.00 0.00 0.00 0.00 0.00 0.00 0.00 0.00 0.00
0.9 0.8
5 0.00 0.00 0.00 0.00 1.00 0.00 0.00 0.00 0.00 0.00 0.00 0.00 0.00 0.00 0.00 0.00 0.00 0.00 0.00 6 0.00 0.00 0.04 0.00 0.02 0.84 0.00 0.00 0.00 0.02 0.00 0.00 0.00 0.00 0.04 0.00 0.00 0.00 0.02
0.7
7 0.00 0.00 0.00 0.00 0.00 0.00 0.98 0.00 0.02 0.00 0.00 0.00 0.00 0.00 0.00 0.00 0.00 0.00 0.00 8 0.04 0.02 0.00 0.02 0.00 0.00 0.00 0.78 0.00 0.00 0.00 0.00 0.00 0.00 0.04 0.00 0.02 0.00 0.07
1 0.88 0.00 0.00 0.00 0.00 0.00 0.00 0.04 0.00 0.00 0.04 0.00 0.00 0.00 0.00 0.00 0.04 0.00 0.00
0.6
3 0.00 0.00 0.96 0.00 0.00 0.04 0.00 0.00 0.00 0.00 0.00 0.00 0.00 0.00 0.00 0.00 0.00 0.00 0.00 4 0.00 0.00 0.00 0.96 0.00 0.00 0.00 0.00 0.00 0.00 0.04 0.00 0.00 0.00 0.00 0.00 0.00 0.00 0.00 6 0.00 0.00 0.00 0.00 0.00 1.00 0.00 0.00 0.00 0.00 0.00 0.00 0.00 0.00 0.00 0.00 0.00 0.00 0.00 8 0.04 0.00 0.00 0.04 0.00 0.00 0.00 0.88 0.00 0.00 0.00 0.00 0.00 0.00 0.00 0.00 0.04 0.00 0.00 9 0.00 0.00 0.00 0.00 0.08 0.00 0.00 0.00 0.88 0.00 0.00 0.00 0.04 0.00 0.00 0.00 0.00 0.00 0.00
10 0.00 0.00 0.00 0.00 0.00 0.00 0.18 0.00 0.00 0.82 0.00 0.00 0.00 0.00 0.00 0.00 0.00 0.00 0.00
0.4 0.3 0.2
14 0.04 0.00 0.00 0.00 0.00 0.00 0.00 0.00 0.00 0.00 0.04 0.00 0.00 0.92 0.00 0.00 0.00 0.00 0.00 16 0.00 0.00 0.00 0.00 0.00 0.00 0.00 0.00 0.00 0.00 0.00 0.00 0.00 0.00 0.00 1.00 0.00 0.00 0.00
0.1
18 0.00 0.00 0.00 0.00 0.00 0.00 0.00 0.00 0.00 0.00 0.00 0.00 0.00 0.00 0.00 0.00 0.00 1.00 0.00 19 0.00 0.00 0.00 0.00 0.00 0.04 0.00 0.04 0.00 0.00 0.00 0.00 0.00 0.00 0.00 0.00 0.04 0.00 0.88
0
0.4 0.3 0.2 0.1 0
19
18
16
17
14
15
12
13
11
9
10
7
8
5
6
3
4
1
2
19
18
17
16
14
15
13
12
11
10
9
8
7
5
6
4
3
2
1
(a)
12 0.00 0.00 0.00 0.00 0.00 0.00 0.00 0.00 0.00 0.00 0.00 0.96 0.00 0.00 0.04 0.00 0.00 0.00 0.00
17 0.00 0.00 0.00 0.00 0.00 0.00 0.00 0.00 0.00 0.00 0.00 0.00 0.00 0.00 0.00 0.00 0.96 0.00 0.04
17 0.07 0.00 0.00 0.00 0.00 0.00 0.00 0.00 0.00 0.02 0.00 0.00 0.00 0.00 0.00 0.00 0.91 0.00 0.00 19 0.02 0.00 0.00 0.00 0.00 0.02 0.00 0.02 0.00 0.00 0.02 0.00 0.00 0.00 0.00 0.00 0.02 0.00 0.89
0.5
15 0.00 0.00 0.00 0.08 0.00 0.00 0.00 0.00 0.00 0.04 0.00 0.00 0.00 0.00 0.88 0.00 0.00 0.00 0.00
15 0.00 0.00 0.00 0.16 0.00 0.00 0.04 0.18 0.00 0.00 0.00 0.00 0.00 0.00 0.62 0.00 0.00 0.00 0.00
18 0.00 0.00 0.00 0.00 0.00 0.00 0.00 0.00 0.00 0.00 0.00 0.00 0.00 0.00 0.00 0.00 0.00 1.00 0.00
0.6
13 0.00 0.00 0.00 0.00 0.00 0.00 0.00 0.00 0.00 0.00 0.00 0.00 0.96 0.04 0.00 0.00 0.00 0.00 0.00
13 0.02 0.00 0.02 0.00 0.00 0.00 0.00 0.00 0.02 0.00 0.00 0.00 0.93 0.00 0.00 0.00 0.00 0.00 0.00
16 0.00 0.00 0.02 0.00 0.00 0.00 0.04 0.00 0.00 0.02 0.02 0.00 0.00 0.00 0.00 0.89 0.00 0.00 0.00
0.7
11 0.00 0.00 0.00 0.04 0.00 0.00 0.00 0.00 0.00 0.00 0.96 0.00 0.00 0.00 0.00 0.00 0.00 0.00 0.00
11 0.00 0.00 0.00 0.13 0.00 0.00 0.02 0.00 0.00 0.00 0.82 0.00 0.00 0.02 0.00 0.00 0.00 0.00 0.00
14 0.02 0.00 0.04 0.09 0.00 0.00 0.00 0.00 0.00 0.00 0.02 0.07 0.04 0.62 0.02 0.02 0.02 0.00 0.02
0.8
7 0.00 0.00 0.00 0.00 0.00 0.00 1.00 0.00 0.00 0.00 0.00 0.00 0.00 0.00 0.00 0.00 0.00 0.00 0.00
10 0.00 0.00 0.00 0.00 0.00 0.00 0.00 0.00 0.00 1.00 0.00 0.00 0.00 0.00 0.00 0.00 0.00 0.00 0.00
12 0.00 0.00 0.00 0.00 0.00 0.00 0.00 0.00 0.00 0.00 0.00 1.00 0.00 0.00 0.00 0.00 0.00 0.00 0.00
0.9
5 0.00 0.00 0.00 0.00 1.00 0.00 0.00 0.00 0.00 0.00 0.00 0.00 0.00 0.00 0.00 0.00 0.00 0.00 0.00
9 0.00 0.00 0.04 0.00 0.04 0.00 0.02 0.00 0.82 0.00 0.00 0.00 0.07 0.00 0.00 0.00 0.00 0.00 0.00 0.5
1
(b)
Fig. 14: Confusion matrix of SPP-net+MKL with conv5+spp features under (a) 5 training samples and (b) 25 training samples in each class on 19-Class Satellite Scene dataset. The rows and columns of the matrix denote actual and predicted classes, respectively. The class labels are assigned as follows: 1 = Airport, 2 = Beach, 3 = Bridge, 4 = Commercial area, 5 = Desert, 6 = Farmland, 7 = Football field, 8 = Forest, 9 = Industrial area, 10 = Meadow, 11 = Mountain, 12 = Park, 13 = Parking, 14 = Pond, 15 = Port, 16 = Railway station, 17 = Residential area, 18 = River, 19 = Viaduct.
3) Comparison with the state-of-the-arts: In order to comprehensively analyze the superiority of the proposed method, we compare it with three state-of-the-art approaches ever tested on this dataset. They are SSEP [42], SCMF [9] and MKL [43]. The comparison results are illustrated in Table VI, from which we can observe that the proposed SPP-net+MKL significantly improves the accuracy from 78.32 to 85.22 and 90.05 to 95.07 when the numbers of training samples are 5 and 25, respectively. Besides, we compare each class accuracy with the latest approach SSEP in [42]. SPP-net achieves higher accuracies in 14 classes as shown in Fig. 13. To further analyze the classification results of SPP-net+MKL, we demonstrate the confusion matrices of one of the results in ten experiments when the number of training samples is 5 and
20
25 in Fig. 14. It is observed that port is easily to be misclassified as forest due to the small number of training samples (i.e., 5). Similar results appear in meadow. Fortunately, as the number of training samples increases to 25, both of the accuracies improve dramatically.
IV.
C ONCLUSION
This paper proposed to automatically extract multi-scale deep features from the satellite images by using SPP-net. This net comprises five convolutional layers and two fully-connected layers where the last convolutional layer is followed by the spatial pyramid pooling operator. It is well known that the performance of deep models heavily depends on the large number of training samples, while only hundreds of samples are available in most of the satellite image classification cases. Therefore, we focused on solving the problem of training multiple effective SPP-nets simultaneously. To this end, we pre-trained the DCNN model by using auxiliary ImageNet dataset, which is different from satellite images, and then transferred the parameters in the five convolutional layers to the SPP-nets. Finally, the fully-connected layers of each SPP-net were fine-tuned by their corresponding training samples. It is of great interest to see that this training approach leads to very promising classification results that outperform the existing best results on the same data sets. Furthermore, a multiple kernel learning method was adopted to fuse the multi-scale deep features. The experiments on two classical satellite datasets have demonstrated that the proposed method dramatically improves the classification results compared with several state-of-the-arts.
R EFERENCES [1]
J´on Atli Benediktsson, J´on Aevar Palmason, and Johannes R Sveinsson, “Classification of hyperspectral data from urban areas based on extended morphological profiles,” IEEE Transactions on Geoscience and Remote Sensing, vol. 43, no. 3, pp. 480–491, 2005.
[2]
Farid Melgani and Lorenzo Bruzzone, “Classification of hyperspectral remote sensing images with support vector machines,” IEEE Transactions on Geoscience and Remote Sensing, vol. 42, no. 8, pp. 1778–1790, 2004.
[3]
Antonio Plaza, Jon Atli Benediktsson, Joseph W Boardman, Jason Brazile, Lorenzo Bruzzone, Gustavo Camps-Valls, Jocelyn Chanussot, Mathieu Fauvel, Paolo Gamba, Anthony Gualtieri, et al., “Recent advances in techniques for hyperspectral image processing,” Remote Sensing of Environment, vol. 113, pp. S110–S122, 2009.
21
[4]
Mathieu Fauvel, Yuliya Tarabalka, Jon Atli Benediktsson, Jocelyn Chanussot, and James C Tilton, “Advances in spectral-spatial classification of hyperspectral images,” Proceedings of the IEEE, vol. 101, no. 3, pp. 652–675, 2013.
[5]
Gong Cheng, Junwei Han, Lei Guo, Zhenbao Liu, Shuhui Bu, and Jinchang Ren, “Effective and efficient midlevel visual elementsoriented land-use classification using vhr remote sensing images,” IEEE Transactions on Geoscience and Remote Sensing, vol. 53, no. 8, pp. 4238–4249, 2015.
[6]
Dengxin Dai and Wen Yang, “Satellite image classification via two-layer sparse coding with biased image representation,” IEEE Geoscience and Remote Sensing Letters, vol. 8, no. 1, pp. 173–176, 2011.
[7]
Gui-Song Xia, Wen Yang, Julie Delon, Yann Gousseau, Hong Sun, and Henri Maˆıtre, “Structural high-resolution satellite image indexing,” in ISPRS TC VII Symposium-100 Years, 2010, vol. 38, pp. 298–303.
[8]
Yi Yang and Shawn Newsam, “Spatial pyramid co-occurrence for image classification,” in Proc. IEEE Int. Conf. Comput. Vis., 2011, pp. 1465–1472.
[9]
Guofeng Sheng, Wen Yang, Tao Xu, and Hong Sun, “High-resolution satellite scene classification using a sparse coding based multiple feature combination,” International Journal of Remote Sensing, vol. 33, no. 8, pp. 2395–2412, 2012.
[10]
Anil M Cheriyadat, “Unsupervised feature learning for aerial scene classification,” IEEE Transactions on Geoscience and Remote Sensing, vol. 52, no. 1, pp. 439–451, 2014.
[11]
Josef Sivic and Andrew Zisserman, “Video google: A text retrieval approach to object matching in videos,” in Proc. IEEE Int. Conf. Comput. Vis. Pattern Recog., 2003, pp. 1470–1477.
[12]
Gabriella Csurka, Christopher Dance, Lixin Fan, Jutta Willamowski, and C´edric Bray, “Visual categorization with bags of keypoints,” in Proc. Eur. Conf. Comput. Vis., 2004, vol. 1, pp. 1–2.
[13]
Li Fei-Fei and Pietro Perona, “A bayesian hierarchical model for learning natural scene categories,” in Proc. IEEE Int. Conf. Comput. Vis. Pattern Recog., 2005, vol. 2, pp. 524–531.
[14]
David G Lowe, “Distinctive image features from scale-invariant keypoints,” International Journal of Computer Vision, vol. 60, no. 2, pp. 91–110, 2004.
[15]
Navneet Dalal and Bill Triggs, “Histograms of oriented gradients for human detection,” in Proc. IEEE Int. Conf. Comput. Vis. Pattern Recog., 2005, vol. 1, pp. 886–893.
[16]
Yi Yang and Shawn Newsam, “Comparing sift descriptors and gabor texture features for classification of remote sensed imagery,” in Proc. IEEE Int. Conf. Image Process., 2008, pp. 1852–1855.
[17]
Svetlana Lazebnik, Cordelia Schmid, and Jean Ponce, “Beyond bags of features: Spatial pyramid matching for recognizing natural scene categories,” in Proc. IEEE Int. Conf. Comput. Vis. Pattern Recog., 2006, vol. 2, pp. 2169–2178.
[18]
Yuning Jiang, Junsong Yuan, and Gang Yu, “Randomized spatial partition for scene recognition,” in Proc. Eur. Conf. Comput. Vis., pp. 730–743. Springer, 2012.
22
[19]
John Wright, Yi Ma, Julien Mairal, Guillermo Sapiro, Thomas S Huang, and Shuicheng Yan, “Sparse representation for computer vision and pattern recognition,” Proceedings of the IEEE, vol. 98, no. 6, pp. 1031–1044, 2010.
[20]
Y-Lan Boureau, Francis Bach, Yann LeCun, and Jean Ponce, “Learning mid-level features for recognition,” in Proc. IEEE Int. Conf. Comput. Vis. Pattern Recog., 2010, pp. 2559–2566.
[21]
Kai Yu, Yuanqing Lin, and John Lafferty, “Learning image representations from the pixel level via hierarchical sparse coding,” in Proc. IEEE Int. Conf. Comput. Vis. Pattern Recog., 2011, pp. 1713–1720.
[22]
Yoshua Bengio, Aaron Courville, and Pierre Vincent, “Representation learning: A review and new perspectives,” IEEE Transactions on Pattern Analysis and Machine Intelligence, vol. 35, no. 8, pp. 1798–1828, 2013.
[23]
Li Deng, “A tutorial survey of architectures, algorithms, and applications for deep learning,” APSIPA Transactions on Signal and Information Processing, vol. 3, pp. e2, 2014.
[24]
Alex Krizhevsky, Ilya Sutskever, and Geoffrey E Hinton, “Imagenet classification with deep convolutional neural networks,” in Proc. Conf. Adv. Neural Inf. Process. Syst., 2012, pp. 1097–1105.
[25]
Pierre Sermanet, David Eigen, Xiang Zhang, Micha¨el Mathieu, Rob Fergus, and Yann LeCun, “Overfeat: Integrated recognition, localization and detection using convolutional networks,” in International Conference on Learning Representations (ICLR), 2014.
[26]
Andrew G Howard,
“Some improvements on deep convolutional neural network based image classification,”
arXiv preprint
arXiv:1312.5402, 2013. [27]
Matthew D Zeiler and Rob Fergus, “Visualizing and understanding convolutional networks,” in Proc. Eur. Conf. Comput. Vis., pp. 818–833. 2014.
[28]
Ken Chatfield, Karen Simonyan, Andrea Vedaldi, and Andrew Zisserman, “Return of the devil in the details: Delving deep into convolutional nets,” arXiv preprint arXiv:1405.3531, 2014.
[29]
Karen Simonyan and Andrew Zisserman, “Very deep convolutional networks for large-scale image recognition,” arXiv preprint arXiv:1409.1556, 2014.
[30]
Kaiming He, Xiangyu Zhang, Shaoqing Ren, and Jian Sun, “Spatial pyramid pooling in deep convolutional networks for visual recognition,” in Proc. Eur. Conf. Comput. Vis., pp. 346–361. 2014.
[31]
Jun Yue, Wenzhi Zhao, Shanjun Mao, and Hui Liu, “Spectral–spatial classification of hyperspectral images using deep convolutional neural networks,” Remote Sensing Letters, vol. 6, no. 6, pp. 468–477, 2015.
[32]
Kaiming He, Xiangyu Zhang, Shaoqing Ren, and Jian Sun, “Spatial pyramid pooling in deep convolutional networks for visual recognition,” IEEE Transactions on Pattern Analysis and Machine Intelligence, vol. 37, no. 9, pp. 1904–1916, 2015.
[33]
Maxime Oquab, Leon Bottou, Ivan Laptev, and Josef Sivic, “Learning and transferring mid-level image representations using convolutional neural networks,” in Proc. IEEE Int. Conf. Comput. Vis. Pattern Recog., 2014, pp. 1717–1724.
[34]
Yangqing Jia, Evan Shelhamer, Jeff Donahue, Sergey Karayev, Jonathan Long, Ross Girshick, Sergio Guadarrama, and Trevor Darrell,
23
“Caffe: Convolutional architecture for fast feature embedding,” in Proceedings of the ACM International Conference on Multimedia, 2014, pp. 675–678. [35]
Yann LeCun, Bernhard Boser, John S Denker, Donnie Henderson, Richard E Howard, Wayne Hubbard, and Lawrence D Jackel, “Backpropagation applied to handwritten zip code recognition,” Neural computation, vol. 1, no. 4, pp. 541–551, 1989.
[36]
Gustavo Camps-Valls, Luis Gomez-Chova, Jordi Mu˜noz-Mar´ı, Joan Vila-Franc´es, and Javier Calpe-Maravilla, “Composite kernels for hyperspectral image classification,” IEEE Geoscience and Remote Sensing Letters, vol. 3, no. 1, pp. 93–97, 2006.
[37]
´ Gustavo Camps-Valls, Luis G´omez-Chova, Jordi Mu˜noz-Mar´ı, Jos´e Luis Rojo-Alvarez, and Manel Mart´ınez-Ram´on, “Kernel-based framework for multitemporal and multisource remote sensing data classification and change detection,” IEEE Transactions on Geoscience and Remote Sensing, vol. 46, no. 6, pp. 1822–1835, 2008.
[38]
Yanfeng Gu, Chen Wang, Di You, Yuhang Zhang, Shizhe Wang, and Ye Zhang, “Representative multiple kernel learning for classification in hyperspectral imagery,” IEEE Transactions on Geoscience and Remote Sensing, vol. 50, no. 7, pp. 2852–2865, 2012.
[39]
Yanfeng Gu, Qingwang Wang, Xiuping Jia, and Jon Atli Benediktsson, “A novel mkl model of integrating lidar data and msi for urban area classification,” IEEE Transactions on Geoscience and Remote Sensing, vol. 53, no. 10, pp. 5312–5326, 2015.
[40]
Alain Rakotomamonjy, Francis Bach, St´ephane Canu, and Yves Grandvalet, “Simplemkl,” Journal of Machine Learning Research, vol. 9, pp. 2491–2521, 2008.
[41]
Ross Girshick, Jeff Donahue, Trevor Darrell, and Jagannath Malik, “Rich feature hierarchies for accurate object detection and semantic segmentation,” in Proc. IEEE Int. Conf. Comput. Vis. Pattern Recog., 2014, pp. 580–587.
[42]
Wen Yang, Xiaoshuang Yin, and Gui-Song Xia, “Learning high-level features for satellite image classification with limited labeled samples,” IEEE Transactions on Geoscience and Remote Sensing, vol. 53, no. 8, pp. 4472–4482, 2015.
[43]
Claudio Cusano, Paolo Napoletano, and Raimondo Schettini, “Remote sensing image classification exploiting multiple kernel learning,” arXiv preprint arXiv:1410.5358, 2014.
[44]
Fan Hu, Gui-Song Xia, Zifeng Wang, Liangpei Zhang, and Hong Sun, “Unsupervised feature coding on local patch manifold for satellite image scene classification,” in Proc. IEEE Int. Geosci. Remote Sens. Symp. (IGARSS), 2014, pp. 1273–1276.