Storage Layout and I/O Performance in Data Warehouses Matthias Nicola1, Haider Rizvi2 1IBM Silicon Valley Lab
[email protected]
2IBM Toronto Lab
[email protected]
Abstract. Defining data placement and allocation in the disk subsystem can have a significant impact on data warehouse performance. However, our experiences with data warehouse implementations show that the database storage layout is often subject to vague or even invalid assumptions about I/O performance trade-offs. Clear guidelines for the assignment of database objects to disks are a very common request from data warehouse DBAs and consultants. We review best practices suggested by storage and database vendors, and present two sets of performance measurements that compare storage layout alternatives and their implications. The first set used a TPC-H benchmark workload with DB2 UDB, the other a star schema/star join scenario with IBM Red Brick Data Warehouse.
1 Introduction Designing performance into a data warehouse begins with proper logical schema design and a reasonable selection of indexes and possibly materialized views. The best storage layout and I/O tuning cannot compensate for poor performance due to inadequate schema or indexes. However, eventually tables and indexes are mapped to a set of database files which have to be allocated in the disk subsystem. This asks for proper data placement to assign database files to disks or striped volumes with the goal to maximize I/O throughput, minimize I/O waits, support parallel query processing, and to ensure acceptable fault tolerance and recoverability from disk failures. Designing a database allocation that meets these goals is not trivial and raises questions like: Which tables or indexes should or should not share the same disks? How many disks should be dedicated to a given table or index? For example, should the fact table and its indexes be separated on disjoint (nonoverlapping) sets of disks to avoid I/O contention between them? Or should we distribute fact table and indexes together over all available disks to maximize I/O parallelism for both? In discussions with data warehouse experts we found advocates for either of these two (simplified) approaches, and yet hardly anybody felt comfortable predicting which combination of storage parameters would provide best performance. We also find that often practices from OLTP systems are adopted, e.g. separating different tables from each other or separating tables from indexes and placing them on separate sets of disks is commonly believed to improve I/O performance in data warehouses. However, the optimal data placement scheme is workload dependent.
7-2 Matthias Nicola and Haider Rizvi Yet it is often difficult to predict the query workload or too time consuming to monitor and analyze it. Also, workloads can change over time. Even if the query workload was known, translating it into sequences of physical I/Os to table and indexes is very difficult and dependent on dynamic factors such as caching. Thus, data allocation based on workload analysis is theoretically interesting but in reality almost always infeasible. The goal of this article is to evaluate simple and pragmatic solutions to the data allocation problem in data warehouses. In section 2 we briefly discuss related work and vendor recommendations for the data placement problem. Then we present measurements that compare storage layout alternatives for data warehouses. In section 3 we report experiments on a 1 terabyte TPC-H benchmark with DB2 UDB and in section 4 a star schema in IBM Red Brick Data Warehouse [8].
2 Related Work and Vendor Recommendations There has been research on data placement in traditional OLTP databases and sharednothing parallel database systems in particular [6]. A data allocation methodology for star schemas is proposed in [10], based on partitioning the fact table by foreign key values and a matching fragmentation of each bitmap in every foreign key bitmap index. While this approach is not immediately applicable in current data warehouse installations, disk striping is often deployed for distribution of database files over disks [1]. Storage and database vendors usually either promote distributing all database objects over all disks [4] or separating database objects using disjoint sets of disks. (Database objects are tables, indexes, temp space, logs, database catalog, materialized views, etc.). Storage layout options for DB2 UDB on the IBM Enterprise Storage System (Shark) are compared in [7]. The recommendation is to spread and intermix all tables, indexes, and temp space evenly across all disk arrays of the ESS to avoid an unbalanced I/O load. “SAME” (Stripe And Mirror Everything) suggests that independently from the workload all database objects should be striped over all available disks (“extreme striping”) with mirroring for reliability [5]. In practice, striping over too few disks is a bigger problem than any I/O interference between index and table access or between log writes and table I/O [5]. Others claim that low I/O contention between database objects is more important than maximizing I/O parallelism. Thus, typical separation guidelines include placing the recovery log on disks separate from data and indexes, separating tables from their indexes, separating tables from each other if they are joined frequently, and separation of sequential from random access data [2],[12]. When disk striping is deployed, recommendations for the stripe unit size range from 64k [11] through 1MB [5] and 5MB for large systems [3]. A large stripe unit size is argued to provide a good ratio of transfer time to seek time. Research indicates that a smaller stripe unit size provides good response times for a light I/O load, but that larger stripe unit sizes provide better throughput and higher overall performance
Storage Layout and I/O Performance in Data Warehouses 7-3 under medium to heavy workloads [9]. For a more related work and fault tolerance considerations see [8],[6],[9].
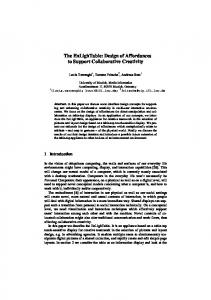
3 TPC-H with IBM DB2 Universal Database The different recommendations for storage layouts motivate dedicated measurements to verify and compare them. We evaluated three alternative storage configurations for a 1 TB TPC-H benchmark with DB2 UDB 7.1. The measurements were made on the RS/6000 SP, using 32 Power3-II wide nodes. Each node had 4 CPUs of 375 MHz, 4GB memory, 32 disks per node. The disk subsystem was IBM’s Serial Storage Architecture (SSA) and totaled 9.32TB in 1,024 drives. The ratio of eight disks per CPU is usually a minimum for optimal performance in a balanced system. Three tablespace container layouts were compared to determine the optimum data placement strategy. The horizontal partitioning and uniform distribution of the data across the 32 nodes was identical each time. The allocation of data across the 32 disks at a node was varied and investigated. For each of the three alternatives the storage layout is identical at every node. During updates I/O-traffic to the log was very little, so we ignore log placement here. Layout #1 Six disks comprised a RAID-5 array to store flat files of the raw data to reload the database tables. Of the remaining 26 disks per node, two were reserved as hot spares and 24 were used for tablespace containers. The tablespaces for data, indexes and temp space were physically represented by 24 containers each, one per disk (Figure 1). DB2 stripes data across the containers of a tablespace in a RAID-0 fashion, using the extent size as the stripe unit size (we used 256k extents for tables, 512k extents for indexes). During peak I/O periods each disk produced ~4.3 MB/s, for a maximum aggregate throughput of ~103 MB/s per node. This compares to a hardware limit of ~7 MB/s per disk and ~90 MB/s per SSA adapter (180 MB/s per node using 2 adapters). Analysis showed that I/O was constrained by intense head movement because containers for all tables and indexes shared all disks. The query execution plans indicated that head movement could be reduced by separating the two largest tables, Lineitem and Orders, from each other and from their indexes. This led to Layout #2. Layout #2 The 24 disks used for data, index and temporary space were divided into 2 groups. 14 disks were used for Lineitem data and Orders indexes, 10 for Orders data and Lineitem indexes. Data and indexes from the smaller tables and temporary space were still spread across all 24 disks. This reduced head movement and increased per-disk throughput from 4.3 MB/s/disk to 6.4 MB/s/disk, but the lower number of disks per tablespace resulted in a loss of aggregate throughput from 103 MB/s/node to about 90 MB/s/node, and a corresponding loss in overall TPC-H performance. This is an important finding: separating the main tables and indexes reduces I/O contention and seek time per disk, but results in lower I/O throughput and lower overall performance.
7-4 Matthias Nicola and Haider Rizvi
all data, indexes, and temp space striped across 24 disks
2 hot spares
Layout #1 1 2 3 4 5 6 7 8 9 10 11 12 13 14 15 16 17 18 19 20 21 22 23 24 25 26 27 28 29 30 31 32
Raid5, flat files
Orders data, Lineitem indexes (10 disks) Other table data & indexes, temp space
Lineitem data, Orders indexes (14 disks)
2 hot spares
Layout #2 1 2 3 4 5 6 7 8 9 10 11 12 13 14 15 16 17 18 19 20 21 22 23 24 25 26 27 28 29 30 31 32
Raid5, flat files
all data, indexes, temp space and flat files striped across 31 disks
1 spare
Layout #3 1 2 3 4 5 6 7 8 9 10 11 12 13 14 15 16 17 18 19 20 21 22 23 24 25 26 27 28 29 30 31 32
Figure 1: Alternative storage layouts using 32 disks per node
Layout #3 Understanding the importance of I/O throughput, layout #3 uses the maximum number of disks. Of the 32 disks per node, one was a hot spare and the RAID5 array was removed. The remaining 31 disks were used to stripe all tablespaces and the flat files. To reduce seek times, data objects frequently accessed concurrently (e.g. Orders data and Orders indexes) were placed in adjacent physical disk partitions in the center of the disk (as opposed to the inner and outer edge of the disk platters). As a result, the disk heads remained within the central 38% of the disk during normal query operation. This reduced seek times and increased the per-disk throughput to 5.6 MB/sec, an increase of ~30% over layout #1. At the same time, the larger number of disks increased the aggregate throughput to ~175 MB/s/node (~1.75 times that of layout #1). This led to an overall improvement in TPC-H performance of ~32%. In summary, separating specific tables and indexes was found to hurt TPC-H performance because achieving high I/O throughput is more critical then minimizing I/O contention and seek time per disk. This can be different in OLTP systems where the required I/O throughput is often much lower. However, data allocation practices for OLTP systems are not necessarily good for data warehouses.
4 Star Schema Scenario with IBM Red Brick Data Warehouse Here we used a simple star schema with one fact table and 5 dimensions as shown in Figure 2. The total database size is ~50GB which is small but big enough to analyze the performance impact of different storage layouts. Each entry in the period table corresponds to one calendar day (637 days, 91 weeks). The fact table and both star indexes are range partitioned by value of the period foreign key. One partition (“seg-
Storage Layout and I/O Performance in Data Warehouses 7-5 (“segment”) holds one week Promotion Period worth of data, spanning 7 (35) (637) period keys. Thus, the fact Legend: table and both star indexes are Table Name comprised of 91 segments (# rows) Fact Table: Customer each. All fact table and star DailySales Fact table has index segments are stored in (1,000,000) (~295 M) 2 multi-column 22 data files (containers) star indexes each. Unlike DB2, Red Brick Product Store does not stripe data across (63) (19,450) containers. We ran the measurements on a Sun E6500 Figure 2: Star Schema server with Solaris 5.8 (64bit) and IBM Red Brick 6.11. The disk subsystem was a Sun A5200 with 22 disks managed by Veritas Volume Manager which allows striping if desired.
4.1 Storage Layout Alternatives We designed 5 different storage layouts focusing on 4 main parts of the database: the fact table, the fact table indexes, the dimension table and indexes, and the temp space. Layout #1: “Manual-22” This layout does not use striping but assigns the 22 containers of each fact table and star index segment “manually” to the 22 disks, i.e. each segment is distributed over all disks (Figure 3). Even queries which access only one segment enjoy maximum I/O parallelism. We also create temp space directories on all 22 disks. Since the dimension tables and indexes are too small to partition, we place each of them on a different disk. Only the customer table and index are stored in 10 containers on 10 different disks each. Layout #2: “Manual-14/8” This is similar to layout #1 except that we separate fact table and star indexes on disjoint sets of disks. We assign the containers of the fact table segments round-robin to disks 1 through 14 and star index containers over the remaining 8 disks. The decision to use 14 disks for the fact table and only 8 for the indexes is merely an intuitive one since the star indexes are smaller than the table. Layout #3: “Stripe22” In layouts #1 and #2 queries which scan only part of a segment may bottleneck on a small number of disks because Red Brick does not stripe data across the containers of a segment. Therefore, layouts #3 to #5 use Veritas RAID-0 volumes. Layout #3 deploys “extreme striping” [5] with one large striped volume over all 22 disks to store all database containers. We compare stripe unit sizes of 8k, 64k, and 1MB.
7-6 Matthias Nicola and Haider Rizvi Layout #4: “Stripe12/4/4/2” Using four disjoint RAID-0 volumes with a stripe unit size of 64k we separate and minimize I/O contention between fact table, star indexes, temp space, and dimensions. The fact table is striped over 12 disks, the star indexes and temp space over 4 disks each, and the dimensions over 2 disks. Layout #5: “Stripe8/8/4/2” One could argue that star index I/O is as crucial for star join performance as fact table I/O. Thus, the 8/8/4/2 layout assigns an equal number of disks to star indexes and the fact table (8 disks each).
Dimensions
Stripe 12/4/4/2
Temp space
1 2 3 4 5 6 7 8 9 10 11 12 13 14 15 16 17 18 19 20 21 22
Fact Indexes
S P A C E T E MP
Fact Table
Fact Indexes
S P A C E
Fact Indexes
1 2 3 4 5 6 7 8 9 10 11 12 13 14 15 16 17 18 19 20 21 22
Fact Table
Stripe 22
Manual 14/8
T E MP
Fact Table
Manual 22 1 2 3 4 5 6 7 8 9 10 11 12 13 14 15 16 17 18 19 20 21 22
1 2 3 4 5 6 7 8 9 10 11 12 13 14 15 16 17 18 19 20 21 22
Fact table
Fact Indexes Temp Space Dimensions
Stripe 8/8/4/2 1 2 3 4 5 6 7 8 9 10 11 12 13 14 15 16 17 18 19 20 21 22
Fact table
Fact Indexes
Temp Space Dimensions
Figure 3: Five Storage Layout Alternatives
4.2 Measurement Results We use 26 queries for performance comparison representing a typical workload for star schema data warehouses. The queries include tightly vs. moderately constrained star joins, a small number of table scan based queries, several queries with large sorts, etc. Figure 4 shows the relative elapsed time of sequentially running all 26 queries (single-user) as a percentage of the best performing layout. Figure 5 shows the multiuser result where the mixed set of queries was executed in each of 20 concurrent streams. For other workloads and results see [8]. Although the higher I/O intensity in the multi-user workload amplifies some of the relative performance differences, the key conclusions are similar for both tests. Striping “everything over all disks” with a medium to large stripe unit size provides best performance. Separating fact table from star index I/O in non-overlapping striped volumes leads to unbalanced and sub-optimal disk utilization. In layouts 12/4/4/2 and 8/8/4/2 the fact table volume was “hotter” than the star index volume (in terms of I/O wait time, queue length). Since the fact table I/O is heavier, performance improves as more disks are devoted to it, in the order of 8/8, 12/4, 14/8, and 22 (Figure 5). With increasing I/O intensity, a small stripe unit size is less suitable to provide high I/O transfer rates. Using 8k stripes, the seek-time to transfer-time ratio is too
Storage Layout and I/O Performance in Data Warehouses 7-7 high which leads to excessive queueing and poor overall performance. Using a 64k or 1MB stripe unit size greatly relieves this problem. This is consistent with research results which predict that under a heavy load a small stripe unit size limits throughput so that response times deteriorate [9]. Table scans which benefit from sequential I/O of contiguously allocated data files (Manual-22) perform similarly well on striped volumes. Note that sequential I/O is not equal to reading an entire file without intermediate disk seeks. Sequential I/O is when the seek time is a small percentage of the transfer time, e.g. 10 random reads of 10MB each are about as efficient as a single scan of 100MB. Thus, a large stripe unit size provides an approximation of sequential I/O while balancing the I/O load evenly across all disks.
Single user, mixed set of queries 127%
Stripe8/8/4/2 (64k) 111%
Stripe12/4/4/2 (64k)
104%
Stripe22 (64k)
100%
Stripe22 (1M)
123%
Stripe22 (8k)
125%
14/8manual
116%
22 manual 0%
20%
40%
60%
80%
100%
120%
140%
Elapsed Time as % of the Shortest Run
Figure 4: Single user performance
In the multi-user test, “Manual-22” performs reasonably well because it does not separate different database objects, does not use a small stripe unit, and provides some approximation to spreading the I/O load over all disks. However, the administration effort is large, and so is the danger of inadvertently introducing data skew and unbalanced I/O load. Both ease of administration and performance recommend striping rather than manual data file placement. We confirmed that the results are not dominated by any single type of query, such as table scans. Removing any specific class of queries from the workload did not change the general conclusions from the test.
7-8 Matthias Nicola and Haider Rizvi
Multi user (20 concurrent users) 162%
Stripe8/8/4/2 (64k) 130%
Stripe12/4/4/2 (64k) Stripe22 (64k)
102%
Stripe22 (1M)
100% 223%
Stripe22 (8k) 126%
14/8manual
118%
22 manual 0%
50%
100%
150%
200%
250%
Elapsed Time as % of the Shortest Run
Figure 5: Multi user performance
5 Summary and Conclusion In this paper we examined the data placement problem in data warehouses and compared alternative storage layouts. We presented measurements in two different scenarios and database systems: a TPC-H benchmark in DB2 and a star join scenario in IBM Red Brick. The results show that for a data warehouse, the easiest and usually the best-performing physical layout is to stripe all data evenly across all disks. Specifically, the separation of different tables or tables from their indexes can adversely affect performance. A medium to large stripe unit size is beneficial to provide high I/O throughput. We believe that these guidelines are a good choice for most data warehouses. However, an unusual workload, specific fault tolerance requirements, or a particular storage system may require additional I/O considerations.
References [1] P.M.Chen, E.K.Lee, G.A.Gibson, R.H.Katz, D.A.Patterson: RAID: High Performance, Reliable Secondary Storage, ACM Computing Surveys, Vol.26(2), pp.145-185, June 1994. [2] Compaq, Configuring Compaq RAID Technology for Database Servers, White Paper, May 1998. [3] A.Holdsworth: Data Warehouse Performance Management Techniques, Oracle White Paper, 1996.
Storage Layout and I/O Performance in Data Warehouses 7-9 [4] Bob Larson: Wide Thin Disk Striping, Sun Microsystems, White Paper, October 2000. [5] Juan Loaiza: Optimal Storage Configuration Made Easy, Oracle White Paper. [6] M.Mehta, D.DeWitt: Data Placement in shared-nothing parallel database systems, VLDB Journal, Vol. 6, pp.53-72, 1997. [7] B.Mellish, J.Aschoff, B.Cox, D.Seymour: IBM ESS and IBM DB2 UDB Working Together, IBM Red Book, http://www.redbooks.ibm.com/pubs/pdfs/redbooks/sg246262.pdf, October 2001. [8] Matthias Nicola: Storage Layout and I/O Performance Tuning for IBM Red Brick Data Warehouse, IBM Developer Domain, , October 2002, http://www7b.software.ibm.com/ dmdd/zones/informix/library/techarticle/0210nicola/0210nicola.html. [9] Peter Scheuermann, Gerhard Weikum, Peter Zabback: Data partitioning and load balancing in parallel disk systems, VLDB Journal, (7)48-66, 1998. [10] T.Stöhr, H.Märtens, E.Rahm: Multi-Dimensional Database Allocation for Parallel Data Warehouses, 26th VLDB Conference, September 2000. [11] VERITAS Software, Configuring and Tuning Oracle Storage with VERITAS Database Edition for Oracle, White Paper, 2001. [12] Edward Whalen, Leah Schoeb: Using RAID Technology in Database Environments, Dell Computer Magazine, Issue 3, 1999.