inadequacy may cause serious information loss and inaccuracy in analysis with ... complex to understand by probabilistic method. ... In order to simplify the combination calculus in IOSM, Huang and Moraga [9] .... The obvious feature of SRM is the ... A more advanced and effective form of cartographical representation of.
Cartographic Representation of the Uncertainty related to Natural Disaster risk: Overview and State of the Art:
Junxiang Zhang 1,2, Chongfu Huang 1,2 1
College of Resources Science & Technology, Beijing Normal University, No.19 Xinjiekouwai Street, Beijing 100875, China 2 Key Laboratory of Environmental Change and Natural Disaster, Ministry of Education of China, Beijing Normal University, Beijing 100875, China {zhangjx,nortzw}@ires.cn
Abstract. There is no believable risk map because of the tremendous imprecision of the risk assessment due to the incomplete-data set. To improve the probability estimation, the fuzzy set methodology was introduced into the area of risk assessment with respect to natural disasters. A fuzzy risk represented by a possibility-probability distribution, which is calculated by employing the interior-outer-set model, can represent the imprecision of risk assessments with a small sample. Thus, by using the fuzzy set methodology, we can provide a soft risk map which can accommodate the imprecision of risk assessment. Soft risk map can be adopted as a useful tool for the representation and reasoning of uncertainty of risk assessments due to incompleteness in real-world applications . . .
1 Introduction Natural disaster risk assessment is a typical issue with imprecision, uncertainty and partial truth. The two basic forms of uncertainty related to natural disaster risk assessment are randomness caused by inherent stochastic variability and fuzziness due to macroscopic grad and incomplete knowledge sample [1]. In many literatures, risk is regarded as a product of severity of loss and likelihood of loss and the likelihood is measured by probability [2]. In fact, the probabilistic method effectively ignores fuzziness of risk assessment with incomplete data sets. As a result, it is impossible to accurately estimate the risks of natural disasters within a specified error range. That is, any risk assessment from a small sample must be imprecise. Consequently, currently used methods for cartographical portrayal of natural disaster risks by using the technique of probabilistic risk maps [3] are inadequate and this inadequacy may cause serious information loss and inaccuracy in analysis with Project supported by National Natural Science Foundation of China, No. 40371002.
adverse consequences in the decision-making process. To overcome this, a possible means for improving the expressive ability of risk maps is to use an alternative concept in which fuzzy imprecision can be accommodated. The fuzzy risk theory and techniques [1] based fuzzy set theory [4] provides an alternative. More importantly it provides flexibility in the way risk information is conveyed Our interest here is to find a more effective way for expressing the vagueness and imprecision of natural disaster risk assessments and to find an acceptable way for communicating these imprecision to map users. In the case of that the data set used to assess risk is incomplete, fuzzy probabilities would be used to represent fuzzy risks and give a new risk map called soft risk map, which can accommodate imprecision of natural disaster risk assessments
2 Uncertainty Due to An Incomplete-Data Set When we study a natural disaster risk system, we sometimes meet small sample problems [5], where the data is too scanty to make a decision in any classical approach. For example, destructive earthquakes are infrequent events with very small probability of occurrence. Therefore, the size of a sample observed in a seismic zone must be insufficient. Therefore, it is difficult to avoid the so-called incompleteness [6] when we study a natural disaster risk system. If we study an incomplete sample, we cannot avoid its fuzziness. In general, uncertainty feature of risk is concerned with both of randomness and fuzziness. For example, the occurrence of earthquake is a random event, however, the earthquake intensity is a fuzzy concept. In the process of risk evaluation, the randomness is due to a large amount of unknown factors existing, and the fuzziness has concern with the fuzzy information that is associated with an incomplete data set with respect to scarcity. This kind of fuzzy information is called mass-body fuzzy information [1]. The feature of mass-body fuzzy information is that each of the data may be crisp but its aggregation or collective, as a whole, has uncertainty different from randomness and carries fuzziness when we employ them to recognize a relation. The main task of processing the mass-body fuzzy information is to unearth (or mine) fuzzy information, which is buried in an incomplete data set. In many cases, extra information is useful for us to effectively study a fuzzy system. If we cut a fuzzy object to be crisp, the extra information will disappear. In general, risk is considered as the possibilities of the occurrence of adverse events. The probability is usually employed to measure the possibility. In many cases, it is impossible to precisely estimate the probability with respect to natural disaster risk. In fact, the probabilistic method is an extremely effective tool to study risk only in the case when a great amount of data can be collected. In other words, the probabilistic method effectively ignores fuzziness of risk assessment with incomplete data sets. Taking into account that natural disaster risk assessments are concerned with both of randomness and fuzziness, obviously, we know that, a risk system is too complex to understand by probabilistic method. Probability and fuzziness are related but different concepts. Fuzziness is a type of deterministic uncertainty. Fuzziness measures the degree to which an event occurs, not whether it occurs. Probability arouses from the question whether or not an event occurs. Moreover, it assumes that
the event class is crisply defined and that the law of non-contradiction holds. That is, A∩Ac = Ø [1]. One day, scientists might be able to find the best models for more accurate risk predictions, however, they never eliminate the imprecision of the risk estimates within a specified error range. In this case, an alternative is to find a more effective way of expressing the vagueness and imprecision of natural disaster risk assessments and to find an acceptable way of communicating these imprecision to users. With current science and technology, a natural way to improve risk estimate is to introduce concept of fuzzy risk represented by a possibility-probability-distribution (PPD) [7] to overcome uncertainty resulting from small-sample problem.
3 Fuzzy Risk Represented by A Possibility-Probability Distribution Scientists have used many systems engineering concepts and methods in addressing the challenges of natural disaster risk. Due to the complexity of natural disaster system, it is impossible to accurately estimate the risks of natural disasters within a specified error range. For showing the imprecision of risk assessment in terms of probabilities under the conditions of small samples, in this section we briefly introduce the concept of fuzzy risk represented by a PPD. Definition 1. Let M = {m} be the space of adverse events, P = {p} be the universe of discourse of probability, and πm(p) be possibility that probability of m occurring is p.
Π M , P = {π M ( p ) | m ∈ M , p ∈ P} .
(1)
is called a possibility-probability distribution (PPD) with respect to risk. In 1998, Huang [7] first proposed the interior-outer-set model (IOSM) derived from the method of information distribution to calculate a PPD with a small sample. In 2001, Huang, Moraga and Yuan [8] proved that IOSM could replace experts to give fuzzy probabilities for the reason that the calculation results and the subjective assessment are almost same in terms of fuzzy expected value and standard deviation. In order to simplify the combination calculus in IOSM, Huang and Moraga [9] transform the calculus into a matrix algorithm which consists of a MOVINGsubalgorithm and a INDEX-subalgorithm. In 2003, Moraga [10] introduced a new version of the model with complexity in the O (n log n) class instead of complexity O (n2). Example 1. Suppose there is a batch of natural disaster records, the number of which is 6. The sample is too small to precisely estimate probability-risk of this disaster. We calculate a PPD with the data to replace a probability-risk. Table 1 can show the fuzzy risk represented by a PPD of the natural disaster. From Table 1, we can see that one obvious characteristic with a fuzzy risk is that fuzzy risk is a fuzzy number which based on the universe of discourse of probability if we
employ incomplete data set to estimate it. For example, for I1, we denote the corresponding fuzzy number as following, Table 1. The PPD of a natural disaster
∏I(p) I1 I2 I3 I4
p0 0.17 0.17 0.17 0.5
p1 0.33 0.5 1 1
Π M ,P =
p2 1 1 0.5 0.17
p3 0.5 0.33 0 0
p4 0 0.17 0 0
p5 0 0 0 0
p6 0 0 0 0
017 0.33 1 0.5 . + + + 0 0.17 0.33 0.5
(2)
where, for a/b, a is membership, b is probability. Therefore, Fuzzy risk represented by a PPD can be employed to show the imprecision of probability estimation in risk analysis. In the practical case of risk map, it is quite difficult to interpret the often vague, imprecise, and qualitative information by probability methods. In this situation fuzzy logic is a viable alternative [11]. The question is basically how to incorporate fuzzy logic into risk mapping.
4
Challenges of Uncertainty
Cartographical
representation
of
Of growing interest in the cartographic community, the portrayal of uncertainty has lately been the subject of much research in the cartographic community. This brings us to the challenge of visualizing uncertainty due to incomplete-data set related to natural disaster risk assessments. However, existing methods of the display of uncertainty information related to natural disaster risk assessment has centered on the randomness in a form of exceeding-probability-risk map. For example, a popular method to make an earthquake-probability-risk map is to indicate earthquake ground motions with 10% probability of exceedence in 50 years [12]. Currently, however, the maps are used only by insurance agents to rate insurance and by parish and local governments in regulating development. There are quite a few businessmen actually do regard the risk maps as information sources and use them to support local businesses. One of the reasons is that there is no believable risk map because of the tremendous imprecision of the risk assessment. The probabilities of exceedence in a probability-risk map do not relate to any confidence in the estimate of a probabilityrisk, which ignores the fuzziness of natural disaster risk. Such a representation inevitably leads to inaccuracy in representing natural disaster risk. A possible means for improving the expressive ability of risk maps is to use an alternative concept in which fuzzy imprecision can be accommodated. However, efforts to the fuzziness of risk estimates have been rare. A critical issue for this research is how to incorporate fuzziness into a risk map.
A method of expression should be well suited to the nature of the information it represents. Expressive inadequacy may lead to loss of valuable information and reduce accuracy of analysis. Hence, it is crucial to find a perfect way of transforms fuzzy risks represented by PPDs into risk map, because this is of great importance on the output of the model. Taking into account that a fuzzy risk is a fuzzy number, the fuzzy α-cut technique will be used to transform fuzzy risks into risk maps.
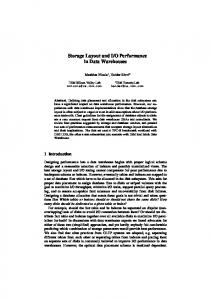
Fig. 1. Possibility-probability distribution with respect to IJ and its α-cut.
The fuzzy α-cut technique is based on fuzzy logic and fuzzy set theory (introduced by Zadeh, 1965), which is widely used in representing uncertain knowledge. Fig. 1 shows the possibility-probability distribution with respect to Ij represented as a bellshaped fuzzy number with support of A0. The wider the support of the membership function, the higher the uncertainty. The fuzzy set that contains all elements with a membership of α ∈]0, 1] and above is called the α-cut of the membership function. At a resolution level of α, it will have support of Aα. The higher the value of α, the higher the confidence in the probability. The membership function is cut horizontally at a finite number of α-levels between 0 and 1. For each α-level of the output, the model is run to determine the minimum and maximum possible values of the probabilities with respect to Ij. This information is then directly used to construct the corresponding fuzziness (membership function) of the output that is used as a measure of uncertainty. Corresponding to a non-empty α-cut, we can obtain a series of minimum probabilities and maximum probabilities with respect Ij. By using the α-cut method, we can obtain series of probability-risk πα(m), α ∈]0, 1]. Then, with a classical method to make a probability-risk map, we can provide a series of risk maps. For these maps, a fuzzy risk represents the imprecision. A α-cut represents some confidence in the estimate. When α= 1, the corresponding soft risk map ought to be the same as one resulted from a classical probability method. The case means that we believe the estimated probabilities.
This kind of risk maps can represent imprecision of risk estimate and information provided by the maps is typically available as ’soft’ information. Therefore, this kind of risk maps are called soft risk maps (SRM). The obvious feature of SRM is the incorporation of fuzzy information due to incomplete-data set into cartographical expression of natural disaster risks. This is a novel approach in view of the traditional method of a probabilistic representation of uncertainties. Due to the ability to represent imprecision of risk estimations that would be thrown away by probabilityrisk map, soft risk map can provide more information. In many cases, extra information is useful for us to effectively study a fuzzy system. If we ignore the fuzziness due to incomplete-data set in risk analysis of natural disasters, the extra information will disappear.
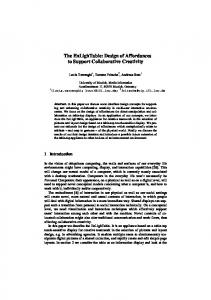
Fig. 2. Conservative risk map with ~ = 0.25 with respect to earthquakes in a region.
Such a map is presented in Fig. 2 and Fig. 3. It shows that soft risk map can be adopted as a useful tool for representation and reasoning of uncertainty of risk assessments in real-world applications. Soft risk map is a kind of risk map in which each area is assigned two risk values. The double risk values represent the imprecision. The 0.25-cut represents some confidence in the estimate. More
importantly it provides flexibility in the way this information is conveyed. Soft risk map can provide a better representation for risk information leading to more satisfying results. In this respect, soft risk map do meet the demands of risk map users. The author’s efforts to accomplish this prompted an exploration of non-traditional forms of cartographic representation of natural disaster risks.
Fig. 3. Risky risk map with ~ = 0.25 with respect to earthquakes in a region.
5 Conclusion and discussion Taking to account that natural disaster risk assessment is concerned with both randomness and fuzziness due to incomplete-data set, the method of probability risk map is inadequate for the representation of uncertainty related to natural disaster risk. A more advanced and effective form of cartographical representation of natural disaster risk can be achieved by incorporating fuzzy logic methodologies into risk map. Soft risk map is a possible means for improving the expressive ability of risk
maps which can accommodate fuzzy imprecision. More importantly it provides flexibility in the way risk information is conveyed. Soft risk map is the potential developing direction of spatially representing natural disaster risk. Future research in this area is an extensive theoretical and experimental study on the choice of the appropriate form of transforming a fuzzy risk represented by a PPD into cartographical form for the application domain of risk map with fuzzy set methodologies incorporated in both the representation and analysis of uncertainty due to incompleteness with respect to natural disaster risk assessment.
References 1. Huang, C.F., Shi, Y.: Towards efficient fuzzy information processing — Using the principle of information diffusion, Physica-Verlag (Springer), Heidelberg, Germany (2002) 2. Huang, C.F., Shi,P.J.: Fuzzy risk and calculation, Proceedings of 18th International Conference of the North American Fuzzy Information Processing Society, New York (1999) 90-94 3. Mays, M.D., Bogardi, I., Bardossy, A.: Fuzzy logic and risk-based interpretations. Geoderma, vol. 77. (1997) 299–315 4. Zadeh, L.A.: Fuzzy sets, Information and control, Vol. 8. (1965) 338 5. Huang, C.F.: Informaion diffusion techniques and small-sample problem. International Journal of Information technology & Decision Making, Vol. 1, 2 (2002) 229–249 6. Huang, C.F., Bai, H.L.: Calculation fuzzy risk with incomplete data. Calculation fuzzy risk with incomplete data. In:Ruan, D., Abderrahim,H.A., et al.(eds.): Proceedings of the 4th International FLINS Conference, World Scientific, Singapore (2000) 180-187 7. Huang, C.F.: Concepts and methods of fuzzy risk analysis. Risk Research and Management in Asian Perspective, Beijing Normal University and et al., International Academic Publishers, Beijing (1998) 12-23. 8. Huang, C.F., Moraga, C., Yuan X.G.: Calculation vs. subjective assessment with respect to fuzzy probability. Reusch, B.(ed.): Computational Intelligence—Theory and Applications. Spinger, Heidelberg, Germany (2001) 393–411 9. Huang, C.F., Moraga, C.: A fuzzy risk model and its matrix algorithm. International Journal of Uncertainty, Fuzziness and Knowledge-Based Systems, Vol. 10,4 (2002) 347–362 10. Moraga, C., Huang, C.F.: Learning subjectvie probabilities from a small data set. Proceedings of 33rd International Symposium on Multiple-Valuee Logic, IEEE Computer Society, Los Alamitos, California (2003) 355–360 11. Koskl, B., Iaska, I.:Fuzzy logic. Sci. Am. Vol.269 (1993) 76-81 12. Wesson, R.L., Frankel, A.D. and et al.: Probabilistic seismic hazard maps of Alaska. USGS Open-File Report 99-36 (1999)