LESSONS FOR THE DESIGN OF POLYGON OVERLAY PROCESSING FROM THE ODYSSEY WHIRLPOOL ALGORITHM appeared in Proceedings 5th SDH, Charleston SC 1992, vol. 2 p.401-410. Nicholas R. Chrisman, James A. Dougenik, and Denis White Department of Geography DP-10 University of Washington Seattle WA 98195 USA
[email protected] Abstract The ODYSSEY system included a processor to perform polygon overlay and related functions of planar enforcement. The existence of this algorithm was reported in a number of publications as the work progressed (White, 1978; Chrisman, 1979; Dougenik, 1979; Lab for Computer Graphics, 1983), but the details of the actual algorithm and data structures were not reported for institutional reasons (Chrisman, 1988). The original authors of the WHIRLPOOL algorithm here present the polygon overlay algorithm used by WHIRLPOOL, in greater detail than presented before. ODYSSEY is not being presented as the most current software system, yet its polygon overlay processor offers important lessons for current research. Background: A Brief History of Polygon Overlay Software Polygon overlay has been a key problem to be addressed in software for handling spatial data. The most convincing evidence for the importance of polygon overlay is to study the evolution of software over the past twenty years. Polygon overlay became a viable proposition when new algorithms found a way around the high costs of computational complexity. The older generation, up to MOSS, compared every polygon with every polygon. These programs might claim the "efficiency" of first inspecting the minimum bounding rectangle around the polygons before checking each pair of segments, but the asymptotic complexity would still be of O(n2 ). The ODYSSEY system included an processor to perform polygon overlay and related functions of planar enforcement. The existence of this algorithm was reported in a number of publications as the work progressed (White, 1978; Chrisman, 1979; Dougenik, 1979; Lab for Computer Graphics, 1983), but the details of the actual algorithm and data structures were not reported for a variety of mostly institutional reasons (Chrisman, 1988). Subsequent work may not have had access to the ODYSSEY research. The time has come to remedy this lack of information. WHIRLPOOL algorithm The basic algorithm of WHIRLPOOL is based on a form of divide and conquer termed a "local processor" (Chrisman, 1976) by the design team. It adopted the sorted band sweep computing paradigm that was developed at the time (Shamos and Bentley,
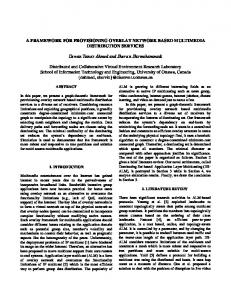
1978; Fowler, 1978; Bentley, 1980). This approach remains common in GIS software (van Roessel, 1990). Inside the general paradigm there are some critical decisions. The ODYSSEY system operates in a file environment using sequential access, not a database environment using random access. As described at the time, it was not presented as a GIS, but a geographic information processing system (Chrisman, 1979). WHIRLPOOL often requires a sorting phase to precede each processing step. The sort/merge used was an implementation of polyphase sort merge as described by Knuth (1973). Preprocessing: Monotonic sections sorted Prior to sorting, WHIRLPOOL creates "monotonic sections" – groups of line segments that retain the same signs of delta X, delta Y, following Burton (1977). These sections have useful properties, such as not being able to intersect twice. Other systems have opted for the simpler (fixed length) structure of segments because monotonic sections are variable length. Statistics from typical applications show that monotonic sections reduce the number of segments to process by a significant factor for commonly processed textures of data. These differences alter the meaning of the term n commonly used to describe complexity. After the monotonic sections are formed, the output is passed to the sorter. The band sweep is operated on the minimum Y coordinate of each section. HADES / CIRCE The heart of the WHIRLPOOL algorithm involves two broad phases, first to find intersections and create nodes, then to detect and name polygons. The second phase (called NAMER) is a relatively straightforward vector implementation of Rosenfeld's two pass algorithm (van Roessel, 1990; 1991) so it will not be discussed in great depth. The first process of detecting intersections is operated by a coroutine between a geometric intersection manager (HADES) and a topological cluster manager (CIRCE). This interaction uses a complex set of data structures to ensure rapid operation. Detecting intersections (HADES) HADES manages the chains. Its primary responsibility is to detect intersections and to create the new chains that result from splitting. The primary data structure for these chains is a tree (implemented using a height-balanced AVL tree (Adelson-Velskii and Landis as quoted in Knuth, 1973, p. 453) using the X minimum of the chain as the key. Since the chains at this point are monotonic sections, this value is the X coordinate of one of the nodes. The purpose of the tree is to limit searches for potential intersections. Each input chain is checked to detect all intersections that it generates. Its X extent can be located in the tree [O(log n)], then the tree can be traversed to detect chains with overlapping X extents. The process need only concern itself with X, because the band sweep ensures that resident chains overlap in Y. Not all chains go into the tree. Chains beyond some length cover enough of the X axis that they must be checked against everything. Figure 1 shows the contents of the tree and the long list.
Direction of sweep
Lowest chain not yet read in "Band" Highest chain flushed out
Balanced Tree Long List
Holds chains over some X extent, scanned sequentially Key: X min. Height balanced AVL
Figure 1: Two structures store chains in the current band (Only the bold chains are currently in residence.) Code fragment for general control of intersection detection for one input chain: locate chain whose Xmin is the largest < Input_chain.Xmax+epsilon REPEAT until Xmin < Input_chain.Xmin–epsilon–Xlong IF (chain windows overlap) find_intersections (old.chain, Input.chain) next chain by walking tree structure FOR each chain in LongList IF (chain windows overlap) find_intersections (old.chain,Input.chain) next chain by walking list structure This method offers advantages over scanning all resident chains or Rtrees – alternatives in common use. In a typical overlay run with over 100,000 polygons, the brute force technique using only resident chains would check 19 million pairs of chains. The tree structure above reduces this to 2 million. At the detailed level, the calculations of intersections seem to attract continued attention, although the topic has been fairly fully studied. HADES developed a version of CROSS based on Douglas (1972) with some extensions required for the topological processing of an overlay program. One small, but highly important, feature is that the calculations of intersections are not calculated in the coordinate system of the whole map. One of the points is selected as a new origin, thus reducing the number of significant
digits (Dougenik, 1979; Chrisman, 1983) HADES introduces the concept of a fuzzy tolerance, expanding the number of basic potential intersection cases to 91 (9X9). Some authors continue to publish their discoveries of these basic cases without the clarity of Douglas's presentation. Dougenik's reformulation for fuzzy intersection is based on ternary logic. Each point is judged with respect to the other line to be on one side or the other or too 'close' to call. This ternary judgement is repeated with two meanings of 'close'; one is 'exact' – to the machine precision, and the other is controlled by the fuzzy tolerance ε. The four determinations are considered together; one point on one side and the other on the other means that the two lines intersect, at least when extended. Such cases are reasonably straightforward, it is the coincident points and 'splits' (where one point comes close to a segment) that involve more inspection. Fuzzy intersections and cluster handling One major issue in WHIRLPOOL is the calculation of intersections with a fuzzy tolerance (reported by Dougenik, 1979). During the development of this software, the first approach attempted to resolve tolerance relationships as they were detected. Trial applications uncovered cases requiring special treatment of clusters - those points found within a tolerance of each other. Any algorithm which attempts to solve tolerance relationships "on the fly" will confront the same problems, with detrimental consequences for the quality of the resulting files. A brief discussion of this issue has been published in a paper on scale changing (Chrisman, 1983). The CIRCE solution collects clusters while intersections are detected, then processes them once all the intersections are known. Clusters are resolved into nodes by moving the cloud of points to certain selected points in the cluster. No point can be moved more than the tolerance and no selected points will be within tolerance of each other. The issue of cluster handling has particular importance since certain current software packages have ignored the evidence presented in summary form earlier. A number of systems resolve tolerance relationships interactively or "on the fly". Some papers suggest that a new point be calculated to best represent a portion of a cluster. WHIRLPOOL research provides counterexamples to that approach. Some recent papers have proposed methods for treatment of multiple tolerances (Zhang and Tulip, 1990; Pullar, 1991), an idea anticipated in the design of WHIRLPOOL. The method proposed by Pullar (1991) involves calculating a mean location, an operation fraught with peril in such a processor. Revealing the details of the WHIRLPOOL implementation should assist in this important area of research. The basic idea of CIRCE is to ensure the basic conditions specified above. The first part of the process is a searching problem. Each point on the input stream and each point created by intersection must determine if any other point fall within a specified tolerance (called epsilon [ε] here after the usage of Julian Perkal), see Figure 1.
ε
Basic issue: any point must discover all other points within ε.
Figure 2: Basic search radius Range searches, such as finding all points within epsilon, require sophisticated data structures. Most spatial index methods provide an approximate solutions (such as placing data in rough boxes) then require post-processing to determine exact relationships. Some examples include EXCELL, range trees, quad trees and related structures. The common approximate solution might have been used for WHIRLPOOL, but it would have had some difficulties. Points from unrelated objects might be thrown into one bucket, and it is still possible that elements of one eventual cluster to occur in many buckets. The CIRCE strategy begins by constructing a virtual "box space", a grid of square cells (called boxes here) where the diagonal of the cell is ε long (see Figure 3). This ensures that any points inside one box belong in the same cluster.
ε
Boxes constructed with diagonal of ε, arranged as grid Figure 3: Construction of box space
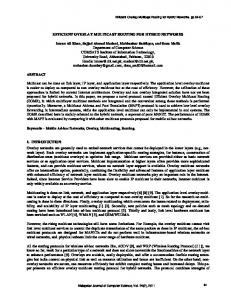
By using a relatively small box, a number of adjacent boxes will have to be examined. Although the box occurs in a cellular tesselation, it was not represented in a raster structure. Due to the divide and conquer, only a small portion (O(n0.5)) of the chains are resident at one time. A raster at the level of coordinate resolution would be punishing in size. For instance, a one meter ε might be quite reasonable for an assessor's parcel coverage, so the potential number of cells in a township (10km X 10 km) would require 100,000,000 elements, almost all of them empty. A typical parcel coverage in Dane County only had 10,000 coordinates, and only a few hundred would be resident at any one cycle of the HADES process described above. In the place of a raster representation, a hashing scheme was used to permute the integer coordinates of the box into a hash key. Hashing is particularly adapted to searching for items most of which are not in the table. CIRCE examines adjacent boxes to determine if there are any points within ε. Since the diagonal of the box is the search radius, the eight adjacent boxes can contain points within tolerance from almost anywhere within a particular box. There are exceptions near the diagonals, but it was decided to simplify and always examine these eight (shown
in dark grey in Figure 4 B). In the center of the box, these eight are the only potential boxes within tolerance. Each point is classified into one of the nine portions of the box shown in Figure 4A. The separating lines are 0.415ε and 0.585ε respectively. In the corners, as many as fourteen boxes must be searched, as shown in Figure 4B for the case of the southwest corner. B: cells searched shown in grey, basic 8 in dark grey
A: Enlargement of central box, showing number of cells searched 14
11
14
11
8
11
14
11
14
.415 .585
ε Internal divisions of box given as proportion of ε
A typical search shown from southwest portion of box.
Figure 4: Boxes searched depending on location within box The hash function relies mostly on the X coordinate with only the low order digits coming from the Y axis taken modulo 5. The choice of 5 is based on the width of the local region searched as shown in Figure 4B. Hashing, when applied in sparsely filled tables, can provide essentially constant average cost of search, although the official worst case analysis is horrible [O(n) for each search] (Knuth, 1973 p. 506). The form of hashing selected for CIRCE was a primary hash modulo the length of the table (chosen to be prime) with a secondary hash based on another prime number. The drawback of using a secondary hash is that a deleted mark must be placed when removing an entry, since some other entry might have wanted that slot and been relocated by the secondary hash. The constant nature of the search cost in CIRCE is assured by "rehashing" (wiping the table clean and reinserting all boxes) whenever the number of secondary searches exceeds some factor of the primary searches. While this tuning parameter can be reset, the value of 1 seems to operate smoothly. This means that a search is never more than two table lookups. It is difficult to create any tree structure with such behavior for large amount of data. The box space is one one of the data structures used in CIRCE. Figure 5 shows the general scheme of the interaction required to make CIRCE operate. The general scheme is hierarchical. Boxes collect all the chain ends (called members) that occur in the box. A linked list is used. Boxes are in turn grouped into 'clusters' if any two members fall within tolerance of each other. Clusters consist primarily of a linked list of boxes, but there is an additional function. CIRCE controls the deletion of information as it is completed. Each cluster records the maximum Y coordinate of its members. This figure is updated as new members are added or clusters are merged. A form of 'heap' is used as an index to the lowest Ymax. This heap is a binary tree where element i is less than both 2i and 2i+1. Ther is no particular relationship between 2i and 2i+1, so it does not sort the list in a complete sense. Insertions into such a list (and deletions from the list) are O(log m) where m is the number of elements.
Chain entries
^Cluster (from,to)
Chain entries (balanced tree & long list)
Chain Nubs (variable sized memory blocks)
Chains
^Nub
Members ^entry ^member ^entry ^member
^Nub
^entry ^member
^Nub
Hash table
^entry ^member
^Cluster (from,to)
^entry ^member
Clusters
Boxes ^box ^member IX IY
^box Ymax ^box ^member IX IY ^Cluster (from,to)
(free list)
Heap ^box ^member IX IY
^box Ymax
^box Ymax
^box ^member IX IY
Figure 5: Data structure diagram for CIRCE As in many data structures, the overall structure is circular. The members refer to the chain entry – the only pointer to the actual location of the chain. [WHIRLPOOL operates in a dynamic memory context, so chain may be moved.] The chains (managed by HADES) contain a reference to the cluster at each end of the chain. This pointer is eventually replaced when a cluster is completed with an output node identifier. When both ends contain nodes, the chain is complete and is written to the output stream. As input occurs through the intersection procedures of HADES, the CIRCE process does not modify anything. Clusters accumulate all the coordinates without judging them. Only when all the intersection activity has moved past a cluster does it begin to prune them down. The problem of selecting points from a cluster to become the output nodes offers some interesting problems. Clusters can become relatively large and often more stringlike than compact. In some routine overlay problems, the largest clusters can contain well over thirty members. When performing deliberate coarsening, the maximum can increase further. The CIRCE algorithm was designed to provide for different procedures to select the points to retain as nodes. Unfortunately, there have not been many alternatives implemented in code. In the early design, it was decided that an optimal solution
(minimizing the number of points selected or minimizing the distance of aggregate movement) was a clear specification of the 'set covering problem', a member of the NP Complete family (Bruckner, 1978). Attempting to solve an NP Complete problem on a set of size thirty might take substantially more computing than the intersections of thousands of chains. The basic method developed adopted a greedy heuristic. First, the upper half of a matrix of squared distances is constructed. All points are marked as unreachable. Then, the point adjacent to the most unreachable points is selected to become a node. Adjacency is determined by ε, the tolerance, not by the topology of the linework. Points within ε are judged adjacent (perhaps this simplification may be the cause of some crudeness in the results and the possible source of some failures where the topology of the resulting linework is non-planar). Under these rules, a cluster that contains one central point within tolerance of all the other members will be pulled into that central node. Clusters longer than ε will have to have multiple nodes. The procedure is deliberately done in two phases. The determination of 'reachable' points is not the final choice of which points move to which nodes. Once the set of nodes has been selected, points are assigned to the nearest node, not necessarily the one which reached it first. Moving to the nearest node is done without regard to the topology of the lines, an issue that might bear reexamination if multiple tolerances are ever implemented. Under the basic rule, if there are a number of points with the same number of adjacencies there is no predicting which is chosen. When operating this program for cleaning spaghetti input, it would often chose the point at the end of a short overshoot, creating wobble in lines digitized as straight. To correct this problem, additional logic was inserted to count the number of times a point was referenced. A one reference point (overshoot) would not be selected when a four valent point had the same adjacency. While this correct a problem for that situation, there are many other custom logics to develop. Multiple tolerances deserve attention, and were considered during the ODYSSEY design phase. We felt it was more important to get a single tolerance engine to operate first. Multiple tolerance issues create the need for a much more sophisticated analysis. After the decisions on point movement are made, there are some topological consequences. Some endpoints of short chains become collapsed into the same node. These 'vacuous' chains are simply deleted. In some cases, a whole node is vacuous and no output lines are produced. These could be converted to 'point features', but in the areaoriented attribute world of ODYSSEY, they were deleted. In another case, the ends of two colinear chains could become identical (as in simplifying a double line road to a single line. In such a case, there is a need for a topological examination of the attributes attached to the chains. This 'congruence' analysis counts the number of times that an area reference (left/right) is made, corrected for chain orientation. Left references count negative and right as positive. At the end of the analysis, all area references should cancel except the two outermost areas that survive to become the left and right of the single chain produced.
Conclusion As conclusion, the design goals of ODYSSEY, in creating a robust, efficient polygon overlay processor, can be shown to have been achieved. WHIRLPOOL has deficiencies that are discussed to strengthen current research. Operating statistics show that the processor can be compute–bound despite massive data throughput. This approach, based on pipleines of sequential files, deserves a second glance even in a period of rather different computing costs.
Acknowledgements The research reported in this paper was partially supported by National Science Foundation grant MCS 74-14437 (long ago). The authors were research associates at the Laboratory for Computer Graphics and Spatial Analysis, Harvard University. Others involved in the ODYSSEY project, including Scott Morehouse, Randolph Franklin, Allan Schmidt, Geoffrey Dutton, participated in discussions related to the algorithm reported here. References Bentley, Jon Louis 1980 Multidimensional divide and conquer, Communications ACM, vol. 23, 214-229. Blackwell, Bruce, 1987, The use of range-tree spatial indexing to speed GIS retrieval, Proceedings AUTO-CARTO 8, 195-200. Brucker, P. 1978: On the complexity of clustering problems, p. 45-54 in Henn Korte, and Olletti eds. Optimierung und Operations Research, Springer-Verlag. Burton, Warren 1977: Representation of many-sided polygons and polygonal lines for rapid processing, Communications ACM, vol. 20, no.3. Chrisman, N.R. 1976 Local versus global: The scope of memory required for geographic information processing, H. LCGSA Internal Report 76-14, 11 pp. Chrisman, N.R. 1979 A many dimensional projection of ODYSSEY, unpublished paper, Harvard Laboratory for Computer Graphics, 30 pp. Chrisman, N.R. 1983 Epsilon filtering: A technique for automated scale changing, Proc. ACSM Annual Meeting, p. 322-331 Chrisman, N.R. 1988 The risks of software innovation: a case study of the Harvard Lab, The American Cartographer, 15 291-300. Dougenik, James A. 1979 WHIRLPOOL: A geometric processor for polygon coverage data, Proc. AUTO-CARTO 4, 304-311 Douglas, David 1972 It makes me so CROSS, Harvard Laboratory for Computer Graphics, reprinted in 1990 Introductory Readings in GIS, Peuquet and Marble editors, Taylor and Francis. Fowler, Robert 1978 Approaches to multi dimensional searching, Harvard Papers on GIS, vol. 6, Addison Wesley. Herring, John R., 1987, TIGRIS: topologically integrated geographic information system, Proceedings AUTO-CARTO 8, 282-291.
Knuth, Donald 1973: Sorting and Searching, vol 3 of The Art of Computer Programming, Addison Wesley. Lab for Computer Graphics 1983 ODYSSEY system summary, unpublished paper, Harvard University, 15 pp. Pullar, David 1991 Spatial overlay with inexact numerical data, Proc. AUTO-CARTO 10, p. 313-329. Shamos, Michael and Bentley, J.L. 1978 Optimal algoritms for structuring geographic data, Harvard Papers on GIS, vol. 6, Addison Wesley. van Roessel, Jan 1991 Attribute propogation and line segment classification in planesweep overlay, Proc. 4th International Spatial Data Handling, 127-140. van Roessel, Jan 1990 A new approach to plane-sweep overlay: topological structuring and line segment classification, Cartography and GIS, 18, 49-67. White Denis 1978 A design for polygon overlay, Harvard Papers on GIS, vol. 6, Addison Wesley. Zhang, G. and Tulip, J. 1990 An algorithm for the avoidance of sliver polygons and clusters of points in spatial overlay, Proc. 4th International Spatial Data Handling, 141-150.
Pseudo code for HADES / CIRCE appropriate initialization (set epsilon, open Red and Blue files - sorted chains) Procedure SOUSA [the band manager] preload keys (Y min) from both files (large value if not present) REPEAT until (both files exhausted) select lower of two keys, set Y level (SCUM := key – epsilon) request CIRCE processor SPIN to clear clusters below SCUM create "New chain" invoke HADES (New chain) reload key for file that contribute new chain SPIN (big number) to purge last chains) Procedure HADES (Input.chain) set intersection records to null; create temporary "entry" for chain; set X min locate chain whose Xmin is the largest less than Input_chain.Xmax+epsilon REPEAT until Xmin < Input_chain.Xmin–epsilon–Xlong IF (chain windows overlap) SHADES (old.chain, Input.chain, tree) next chain by walking tree structure FOR each chain in LongList IF (chain windows overlap) SHADES (old.chain,Input.chain, LongList) next chain by walking list structure SHADES (Input.chain, self, new) FOR each remaining intersection record construct pseudo "chain" for points introduced along old chains perform all above steps as if this were an input chain Procedure SHADES (old.chain, new.chain, flag) [flag values: tree, long, new] if (flag ≠ new) INTERS (old.chain, new.chain, CROSS) if (no intersection records generated) EXIT BLDSRT HYDRA CHARON TWIST [inform CIRCE of new chain ends to manage (or new location of old data)]