Line Integral Convolution for Real-Time Illustration of. Molecular Surface Shape and Salient Regions. Kai Lawonn1, Michael Krone2, Thomas Ertl2, Bernhard ...
Volume 33 (2014), Number 3
Eurographics Conference on Visualization (EuroVis) 2014 H. Carr, P. Rheingans, and H. Schumann (Guest Editors)
Line Integral Convolution for Real-Time Illustration of Molecular Surface Shape and Salient Regions Kai Lawonn1 , Michael Krone2 , Thomas Ertl2 , Bernhard Preim1 1 Department
of Simulation and Graphics, University of Magdeburg, Germany Research Center (VISUS), University of Stuttgart, Germany
2 Visualization
Abstract We present a novel line drawing algorithm that illustrates surfaces in real-time to convey their shape. We use line integral convolution (LIC) and employ ambient occlusion for illustrative surface rendering. Furthermore, our method depicts salient regions based on the illumination gradient. Our method works on animated surfaces in a frame-coherent manner. Therefore, it yields an illustrative representation of time-dependent surfaces as no preprocessing step is needed. In this paper, the method is used to highlight the structure of molecular surfaces and to illustrate important surface features like cavities, channels, and pockets. The benefit of our method was evaluated with domain experts. We also demonstrate the applicability of our method to medical visualization. This is the authors preprint. http://onlinelibrary.wiley.com/
The
definitive
1. Introduction Illustrative visualization methods aim at conveying relevant information about shape and spatial relations. Salient regions are emphasized and the surface complexity may be reduced. The simplified representation is often preferred in medical atlases and in repair manuals. Furthermore, illustrative surface rendering is used for focus-and-context visualization by adapting rendering parameters and thus the level of detail. In molecular visualization, illustrative rendering is also beneficial to highlight the three-dimensional shape and structure. Especially for biomolecules like proteins, the structure of the surface is essential for understanding function. Furthermore, molecular visualization is important for analyzing (bio-)molecular simulations. An introduction to the most common types of biomolecules, how they work and what effect they have in a living cell can be found in [Goo09]. All molecular representations arise from different model definitions that depict distinct aspects of the atomic structure. The molecular models range from simple depictions of the atoms and chemical bonds to abstracted representations and molecular surfaces. There is a large variety of illustrative visualization techniques, which are for example commonly applied to volume rendering [Vio05]. In our work, we focus on line drawc 2014 The Author(s)
c 2014 The Eurographics Association and John Computer Graphics Forum Wiley & Sons Ltd. Published by John Wiley & Sons Ltd.
version
is
available
at
http://diglib.eg.org/
and
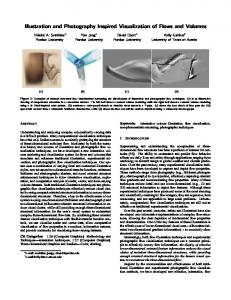
ing methods. Line drawings can be classified into feature lines and hatching methods. Feature lines are used to depict salient regions with separate lines. Most of these techniques use higher order derivatives of a scalar field for the determination of the lines. However, even slight noise on the surface yields visual clutter and makes preprocessing like subdivision and smoothing necessary to gain proper results. In contrast, hatching tries to convey the shape by illustrating the surface with a multitude of lines. Instead of specific regions, the whole surface is covered with lines of different opacity. The opacity mostly depends on the shading of the surface. As the whole surface is covered with lines, relevant features may not be distinguished from unimportant ones. The recently presented ConFIS method [LMP13] tries to solve these issues. However, this method strongly depends on the underlying tessellation and the feature detection is based on the mean curvature. In this paper, we present a novel illustrative visualization method that combines the advantages of feature lines and hatching and apply it to molecular surface renderings as shown in Figure 1. The molecular surface exhibits structures (e.g. cavities, channels, and pockets) that affect the function of the protein. Therefore, an interactive visualization of the raw molecular data that highlights these structures is important for analyzing molecular dynamics. Illustrative tech-
Lawonn et al. / LIC for Illustration of Molecular Surface Shape
niques have been shown to effectively accentuate the protein structure [TCM06]. Figure 1(a) shows a protein surface illustrated using our method, whereas in Figure 1(b), it is applied selectively to emphasize a compartment of an ATPase. In order to be useful for time-dependent molecular simulation data, an illustrative visualization technique has to fulfill several requirements. It should illustrate deformable surfaces, since the protein surface changes constantly due to conformation changes and the thermal vibration of the atoms. The molecular surface shows the boundary of a protein with respect to a certain type of solvent molecule [Ric77]. Consequently, the surface can also change during analysis due to user input, e.g., if the user selects the surface for another type of solvent. Therefore, an interactive performance is necessary without time-consuming preprocessing for every animation step. Finally, for visual exploration, we have to provide frame-coherence during the interaction as well as during the time-dependent deformation. Our method uses line integral convolution (LIC) to assess the shape of the surface [CL93]. LIC is often used for the depiction of vector fields on a 2D domain or on arbitrary surfaces. Previously, the LIC concept was employed to illustrate a vector field itself [FW08], or to visualize vector fields on surfaces. In this work, however, we use LIC to generate a hatching-like visualization for conveying the surface’s shape. The illustration of the surface structure is based on the illumination gradient. Furthermore, we use a 2D lookup table (LUT) to map additional information to the surface at the respective regions. The LUT is encoded in a 2D texture that is used for color-coding (see Figure 1). Using LIC, we obtain results that are comparable to the ConFIS method mentioned above. However, our method avoids the extensive memory usage and computationally heavy preprocessing needed by ConFIS. Therefore, our method can be used in real-time on deforming surfaces. Disabling the LIC method, we gain results which are similar to feature line techniques. In summary, we make the following contributions: • A novel view-dependent and frame-coherent illustrative visualization method. • Line drawing illustration based on a 2D lookup table. • LIC is applied to salient regions in real-time. • A method that acts on animated deforming surfaces. 2. Related Work In the following, we will focus on molecular visualization and on line drawing techniques (feature lines and hatching). M OLECULAR V ISUALIZATION . Illustrative representations have a long tradition in molecular graphics. Goodsell and Olson [GO92] explained different techniques to illustrate molecular surfaces using hatching. More recently, Tarini et al. [TCM06] used ambient occlusion, which was first introduced by Zhukov et al. [ZIK98], and edge cueing for molecular visualization. They enhanced the per-
(a) Molecular surface structure (Isomerase I)
(b) Focus-and-Context (ATPase)
Figure 1: Our method applied to two molecular surfaces: (a) illustration of the surface structure of an isomerase protein and (b) focus-and-context visualization for an ATPase. The 2D LUT shown in (b) was used for both renderings.
ception of the molecules in employing precomputed ambient occlusion, depth-dependent contours, and halos. Contour lines were also used by Sigg et al. [SWBG06] and Lampe et al. [LVRH07] to illustrate atomistic data. Weber generated interactive pen-and-ink renderings of the socalled cartoon model (an abstracted representation of the internal protein structure) [Web09]. Krone et al. [KBE09] used a GPU ray casting technique for the visualization of the smooth molecular surface of proteins. Their approach yields interactive frame rates for large data sets. Following Tarini et al. [TCM06], they enhanced shape perception by applying contour lines and depth darkening [LCD06], which renders depth-dependent halos to mimic screen-space ambient occlusion. Van der Zwan et al. [vdZLBI11] introduced a method for the continuous abstraction of proteins that comc 2014 The Author(s)
c 2014 The Eurographics Association and John Wiley & Sons Ltd. Computer Graphics Forum
Lawonn et al. / LIC for Illustration of Molecular Surface Shape
putes a transition between an atomistic model and the cartoon model. They use illustrative rendering styles (cel shading with ambient occlusion, hatching). Falk et al. [FKE13] provided an atomistic visualization method for data sets comprising billions of atoms. They also employ methods to enhance the shape and depth perception. The latter two visualization techniques resemble the artistic renderings of Goodsell [Goo09] used for the “Molecule of the Month” presented by the Protein Data Bank [BWF∗ 00]. These renderings use cel shading and stylized ambient occlusion to obtain a clear and comprehensive, yet visually pleasing, depiction of proteins. An overview of modern molecular visualization techniques is given in [OGF∗ 10, CLK∗ 11, LLC∗ 12].
F EATURE L INES . Feature lines can be divided in objectbased and image-spaced methods. For image-based methods, we refer to comprehensive overviews [MR11, SR09]. For object-based methods, a 3D model is used as input. The goal of feature lines is to depict salient regions of the surface with a single line. We refer to Rusinkiewicz et al. [RCDF08] for an extensive list of line drawing techniques. The contour is an important cue in conveying shapes, but cannot depict all relevant features. Interrante et al. [IFP95] proposed ridges and valleys, which are curvature-based features, to enhance the surface visualization. Motivated by artists, who draw different feature lines from one perspective to another, a demand for view-dependent feature lines exists. Hence, DeCarlo et al. [DFRS03] proposed suggestive contours, a viewdependent approach. Judd et al. [JDA07] presented apparent ridges. They tried to overcome the limitations of ridges and valleys and suggestive contours by combining them. Xie et al. [XHT∗ 07] introduced PELs, which adapts the idea of Canny edges [Can86] to the surface. Zhang et al. [ZHX∗ 11] presented Laplacian lines, which applies the Laplacian for Gaussian edge detector to 3D surfaces.
H ATCHING . The goal of hatching is to enhance the spatial impression of a surface by generating a wealth of lines over the whole surface. Hertzmann and Zorin [HZ00] presented a method that hatches the surface in order to convey surface shape. They used the principal curvature direction (PCD) fields and the corresponding integral lines. Praun et al. [PHWF01] proposed a real-time hatching that projects textures onto the surface. Zander et al. [ZISS04] used the PCDs to draw the hatching lines. They also used different line styles to vary the number and the distance between neighboring hatching lines. Lee et al. [LKL06] used different techniques for contour and interior shading to simulate a pencil drawing style. Kim et al. [KYYL08] presented an algorithm for hatching dynamic and specular surfaces. They used a real-time PCD estimation algorithm for calculations of the line stroke directions. Lawonn et al. [LMP13] provided the ConFIS method. It combines the advantages of hatching and feature lines. c 2014 The Author(s)
c 2014 The Eurographics Association and John Wiley & Sons Ltd. Computer Graphics Forum
3. Method In the field of molecular surface visualization, important structures, e.g., bumps and dents need to be enhanced. Therefore, we determine these salient regions and depict them using a feature field, which is represented by a scalar field. This scalar field is determined using an illuminationbased vector field. The illumination-based vector field is well-suited for conveying discontinuities in visibility and illumination. Finally, we use this vector field for calculating LIC. Therefore, our approach is divided into three steps: 1. Feature vector field: We provide an illumination-based vector field. 2. Feature region: We determine a scalar field that represents salient regions based on the feature vector field. Optionally: We determine a second scalar field. 3. Line integral convolution: We adapt the LIC to the salient regions along the vector field of step 1. The following notation is used in the remainder of this paper. Let M ⊂ R3 be a triangular mesh representing, e.g., a molecular surface. The mesh consists of vertices V with associated positions pi ∈ R3 , edges E = {(i, j) | i, j ∈ V } and triangles T = {(i, j, k) | (i, j), ( j, k), (k, i) ∈ E}. The normal of a vertex i is denoted as ni ∈ R3 . 3.1. Feature Vector Field The illumination gradient is used for the feature vector field. First, the diffuse illumination li of every vertex i is determined: li = hni , vi i. Here h., .i denotes the dot product and vi denotes the normalized view vector from pi to the camera. Afterwards, the illumination gradient per triangle 4 = (i, j, k) is calculated by: ∇l4 = (l j − li )
(p j − pi )⊥ (pi − pk )⊥ + (lk − li ) , 2A4 2A4
(1)
where A4 denotes the area of the triangle and ⊥ stands for a counterclockwise rotation by 90◦ in the triangle plane, see [BKP∗ 10]. Afterwards, we compute the gradient ∇li per vertex i by rotating the gradients of the adjacent triangles to the tangent space first, and then weighting them by their Voronoi area [MDSB02]. The feature field is used for feature region detection and for LIC generation. 3.2. Feature Region A LUT is used to encode information on the surface. This is inspired by transfer functions where scalar values are assigned to colors. The LUT, like the example in (b), was manually created and loaded as an image. Every vertex is assigned to one (optionally two) scalar values and this vertex obtains the color which corresponds to a certain position in the LUT. Therefore, we determine two scalar fields. The first scalar field ϕ represents salient regions on molecular surfaces, whereas the second scalar field τ is used to depict the depth perception of the shape.
Lawonn et al. / LIC for Illustration of Molecular Surface Shape
(a) RV
(b) SC
(c) AR
(d) PEL
(e) Our
Figure 2: A lipase model with different feature lines methods. We have ridge and valleys (RV), suggestive contours (SC), apparent ridges (AR), photic extremum line (PEL), and our approach. Note that our method marks salient region whereas feature lines depict salient details using lines.
The illustration of salient regions was focused by feature line methods. Due to the underlying atomistic data, the molecular surface is very uneven, i.e. it exhibits many bumps and valleys. In molecular visualization, it is essential to depict regions of high saliency such as the transition of concave and convex regions. Kolomenkin et al. [KST08] tried to depict the transition by determining the isolines where the change of the curvature is maximal. As this calculation needs higher order derivatives, it is sensitive to noise and, therefore, not well-suited for noisy meshes. Thus, we focus on a view-dependent approach based on the suggestive contours, which illustrates the transition as well. The computation of our feature regions is based on the previously determined illumination gradient per vertex. The first scalar field ϕ is determined by: ϕi = Dwi li = h∇li , wi i,
(2)
where D is the directional derivative and wi denotes the projected view vector onto the tangent plane of pi , see [LGP13] for an application of this scalar field. We assign the ydimension of the LUT by applying y = 1 − α · |ϕ|, where α is a user-defined value, which controls the feature intensity margin. The higher α, the larger feature region. The scalar field y = 1 − α · |ϕ| emphasizes the shape and enhances bumps and dents and is, thus, ideally suited for atomistic data depiction. Figure 2 shows a comparison of the feature region in comparison with feature line methods. A second scalar field τ is used for the x-dimension of the LUT. We chose ambient occlusion since we wanted to emphasize the geometric shape of the molecular surface. Therefore, an ambient occlusion value for supporting the depth perception of the shape is needed. That is, τ is an ambient occlusion value in [0, 1]. Ambient occlusion can be described as follows: For each point p in the scene, the ambient occlusion value A p is determined by the amount of ambient light that is blocked by surrounding geometry. A p can be computed by integrating over the visible hemisphere hS using equation 3:
ZZ
Ap =
ρ (L (p, x)) cos α dx,
(3)
x∈hS2
where ρ (L (p, x)) gives the amount of blocked incoming light energy from direction x for point p. L(p, x) is the distance to the nearest object in the direction of x. Note that ρ(L) only takes distances into account that are within a certain interval, that is, only a local neighborhood affects A p . α is the angle between direction x and the surface normal n p , that is, cos α = n p · x represents the incoming light. There are several methods to approximate ambient occlusion in real time. For arbitrary, complex scenes there is a variety of fast image-space methods, which are often referred to as screen space ambient occlusion. The basic idea is to sample neighboring fragments and determine the ambient occlusion based on their depth values. We use the screen space ambient occlusion method presented by Kajalin [Kaj09] for general data. As shown by [TCM06], ambient occlusion facilitates the perception of atomistic data. Thus, we employ this technique to illustrate dents and for supporting biochemists to distinguish between dents and bumps. Finally, we used both scalar fields that yield the coordinates of a two-dimensional LUT represented by a texture. In Figure 3, we clamped the coordinates of (τi , 1 − α · |ϕi |) to the interval [0, 1]2 for the LUT. 3.3. Line Integral Convolution Line integral convolution (LIC) was first proposed by Cabral and Leedom [CL93] to visualize 2D vector fields. The method was improved by Stalling and Hege [SH95]. They employed box filter kernels that reduce the total number of streamlines and make them independent from the resolution of the vector field. Instead of visualizing the vector field, we utilize the LIC to illustrate surfaces. Illustrating the surface by streamlines enhances the spatial impression and supports the perception of shape. We employ the method by Huang et al. [HPW∗ 12], which guarantees a robust and frame-coherent LIC visualization by using customized noise c 2014 The Author(s)
c 2014 The Eurographics Association and John Wiley & Sons Ltd. Computer Graphics Forum
Lawonn et al. / LIC for Illustration of Molecular Surface Shape
(a) HQ
Figure 3: Illustration of the Isomerase I data set. Every vertex i is assigned to (τi , 1 − α · |ϕi |). The values correspond to the x- and y-component of the texture (right).
Figure 4: The first eight textures of a noise texture pyramid. The first texture has size 1 × 1.
textures. In the following, we will briefly recap their algorithm. It is divided into three parts: Generating noise textures, texture projection, and creating LIC. Generating noise textures. A sequence of mipmap textures are used to ensure a consistent LIC on the surface. The texture pyramid is build iteratively and starts with a texture I0 of size 1 × 1 to a texture In of size 2n × 2n . Let η ∈ [0, 0.5], ∆x, ∆y ∈ {0, 1}, and γ∆x,∆y be a random number uniformly distributed in [0, 1]. In0 is defined as In0 := (1 − 2η)In + η. The texture pyramid can be iteratively determined by: � � 1 − I 0 (x, y) , (4) In+1 (2x + ∆x, 2y + ∆y) = pow γ∆x,∆y , 0 n In (x, y) with pow(n, m) := nm . Figure 4 shows the resulting textures. Texture projection. First, every triangle is randomly assigned a 2D texture coordinate, which will not change during interaction. During runtime, every triangle is projected onto the noise texture regarding their assigned texture coordinate such that the map is an isometry. This ensures a consistent noise map output during the interaction. Next, the textured fragments are multiplied with the corresponding diffuse illumination to enhance the spatial impression. Creating LIC. The illumination gradient (IG) on the surface mesh is first projected to screen space. Thus, the normalized view direction v and the normalized up-vector u of the corresponding camera are used. A 2D screen space is built with the basis (u, u × v). Afterwards, the IG k is projected to the screen space: (Id −vvT )k, where Id is the identity matrix and v is the normal vector of the screen space. Next, the projected IG is expressed in the basis (u, u × v), is normalized, and stored in a texture (as a 2D vector). The front and back faces are used and, thus, two textures are obtained. When calling the fragment shader, we use the textures for LIC genc 2014 The Author(s)
c 2014 The Eurographics Association and John Wiley & Sons Ltd. Computer Graphics Forum
(b) ConFIS
(c) Our
Figure 6: An example of the lipase model with high-quality hatching (HQ), ConFIS, and our approach.
eration. For LIC propagation we use an Euler method with a fixed number of iterations. The number of iterations is a second user-defined value. As a standard parameter, we suggest 10 iterations. Using significantly less iterations would reveal the noise textures and using more iterations would lead to blurred results. All images are taken with this setting. LICs that are close to the contour will be propagated around the surface by using the projected IG of the front faces and of the back faces. 3.4. Algorithm and GPU Implementation Our algorithm can be summarized with the scheme in Figure 5. The algorithm is entirely executed on the GPU with OpenGL shaders in a multipass rendering. First, the neighbors for every vertex are needed. Based on the neighbor structure, one can determine the scalar field ϕ in the vertex shader. In the fragment shader, we project the triangles onto the noise texture. Therefore, each fragment has an assigned portion of the noise texture. Furthermore, using the two scalar fields ϕ and τ, we assign a color to the current fragment according to its (τ, 1 − α · |ϕ|) position in the LUT. Finally, we combine both textures via multiplication. The combined texture as well as the projected IGs are stored using Frame Buffer Objects (FBO). Thus, we obtain two textures, one for the front face and one for the back face of the surface. In the second rendering pass, we use these textures to generate the LIC on the image space. 4. Informal Feedback We performed an informal study to assess the usability of our illustrative visualization technique. The informal feedback was conducted in three steps with 12 researchers who are familiar with illustrative visualization techniques (8 men, 4 women, age of 27–37) and 3 researchers working in biochemistry (3 men, age 30–54): 1. We showed the participants different shaded models. They could explore the model and gain a 3D impression. Afterwards, different feature line methods and our feature region detection algorithm were applied to the mesh. 2. We compared our method with the high-quality hatching and ConFIS. We introduced the different line drawing
Lawonn et al. / LIC for Illustration of Molecular Surface Shape SSAO Final Texture Mesh
IG
Shading
Combine
Noise
Figure 5: From a given mesh, the screen-based ambient occlusion (SSAO) term and the illumination gradient (IG) is determined. These values correspond to the RGB-values of the texture. The assigned color values are combined with the shading and the noise. Finally, LIC is applied to obtain the result.
techniques and asked the participants to adjust the parameters to obtain a visual pleasing result. 3. We provided the participants with different scenes and objects visualized using our illustrative technique. We used it as an independent illustrative visualization technique as well as for focus-and-context visualization. Assessment of the quality. The goal of the first task was to assess the quality of our feature detection method, see Figure 2. The participants were asked if our method can depict salient regions. Four domain experts explicitly noted that they think that our method provides the same information as the feature line methods. Most participants were satisfied with the region detection, but realized that small features were detected only by conventional feature line methods unless the α parameter were adjusted to a high value. In summary, the participants stated that the feature detection method is able to detect the most prominent salient regions. Comparison with other line drawing techniques. The second task was about a comparison with established line drawing techniques shown in Figure 6. The goal was to figure out if the new approach can keep up with the high-quality hatching [ZISS04] and ConFIS [LMP13]. All participants stated that all three line drawing techniques were able to give a spatial impression of the model. Most researchers were satisfied with the new approach. We also showed them a low resolution mesh (see Figure 8) and the participants argued that ConFIS generates too few lines to gain a substantial impression. Furthermore, all participants liked the idea of illustrating the ambient occlusion with darker lines and therefore preferred our new method as it decodes additional informa-
tion. Finally, all participants stated that the new approach can keep up with the compared techniques. Use as a focus-and-context rendering technique. The third task was about figuring out if our new method can be used as an alternative for focus-and-context visualization (e.g. Figures 1(b) and 7(b)) as well as a standalone illustration. Please note that we did not explain the method beforehand as in task two. The users were able to intuitively figure out the meaning on their own. Here, we noticed that the biochemists found the method more intuitive and useful than the visualization experts, since they are already acquainted with molecular data sets in general. Regarding comprehensibility, the experts first familiarized with the user-defined threshold α, which controls the feature intensity. Usually, they set it to zero and slowly increased this value until they got an impression of the surface. One visualization expert suggested combining our line drawing with toon-shading to emphasize the surface. This would also allow to color-code biochemical information (e.g. hydrophobicity or atom charge) on the surface, which one of the biochemists was missing. The focus-and-context visualization was rated as especially useful by the biochemistry experts. One of them told us that they would like to have the method in a molecular visualization software, since it would enhance the analyses. In contrast to classical methods that use different colors or transparency, our illustration emphasizes salient features of the surface. The participants agreed that illustrative rendering styles support the perception and reduce the distraction by unimportant parts. As our method detects salient regions and illustrates them with LIC, one participant suggested to illustrate the other regions with stippling. We plan to investigate this idea and the coloring in future work. c 2014 The Author(s)
c 2014 The Eurographics Association and John Wiley & Sons Ltd. Computer Graphics Forum
Lawonn et al. / LIC for Illustration of Molecular Surface Shape
(a) Peptide
(b) Rhodobacter porin
(c) Potassium Channel
Figure 7: Different molecules illustrated with our approach: (a) shows a small peptide as VDW surface; (b) is a focus-andcontext rendering of a porin, where a smooth molecular surface and a secondary structure (cartoon) representation are combined; (c) illustrates the solvent excluded surface of a potassium channel. The LUT shown in Figure 3 was used for all images.
(a) Wireframe
(b) ConFIS
(c) Our
(d) Wireframe
(e) ConFIS
(f) Our
Figure 8: The DNA model with 65.634 ((a) – (c)) and 3.280 ((d) – (f)) triangles. Our method shows robust result regarding the tessellation compared with the ConFIS method. We used the texture in Figure 1(b).
5. Results & Discussion We tested our method using various protein data sets from the Protein Data Bank [BWF∗ 00] and molecular simulations provided by our project partners. The meshes were created using VMD [HDS96]. In particular, we used the Van der Waals (VDW) surface, the Solvent Excluded Surface (MSMS [SOS96]), and the QuickSurf molecular surface [KSES12]. The experiments were conducted on a midrange desktop computer with an Intel Xeon CPU (3GHz), 8GB RAM, and an NVidia GeForce GTX 460. All models, numbers of triangles, and frame rates are listed in Table 1. For all models, our method can be executed in real-time. Our method uses two different scalar fields to encode different information. In our examples, we use ambient occlusion as a second information (τ). Furthermore, an arbitrary LUT represented by an image can be employed and our method will illustrate the surface based on their scalar field. c 2014 The Author(s)
c 2014 The Eurographics Association and John Wiley & Sons Ltd. Computer Graphics Forum
Lawonn et al. [LMP13] showed that the ConFIS method is able to provide illustrations that combine the advantages of feature lines and hatching methods. Therefore, we will list the advantages of our method in comparison to ConFIS. Our first claim is that our method is more tessellationindependent, see Figure 8. While the ConFIS method has less streamlines, our method has a consistent margin where the features are depicted. This is due to the fact, that we propagate the streamlines in image-space, whereas ConFIS uses the barycenter of specific triangles. Hence, less streamlines are generated when the resolution is decreased. The second advantage is that our method can handle deformation and depict it in real-time, see Figure 9. ConFIS determines the streamlines on the surface and stores them in a preprocessing step. During runtime, feature regions are determined and the streamlines were activated on these regions. Thus, a certain portion of the buffer is needed for streamline information storage. Furthermore, when changing the underlying vector
Lawonn et al. / LIC for Illustration of Molecular Surface Shape
field, e.g. due to mesh deformation, the ConFIS method has to recompute the streamlines, which is time-consuming. For our method, we do not need the same amount of buffers, as we illustrate the LIC in real-time. Thus, our method is more tessellation-independent, yields reasonable results, and can handle deformations in real-time, see Table 1. As mentioned in Section 2, illustrative rendering has been shown to effectively support the visual analysis of molecular surface data. In most cases, however, only simple methods like contour lines or ambient occlusion are used. Our goal was to illustrate complex models like molecular surfaces, which is important to analyze protein function. More specifically, we wanted to illustrate the shape of the molecular surface and highlight salient features, like indentations and gaps, in the outer surface (so-called cavities or pockets). These features are often an indicator for binding sites, which are crucial to protein functions like enzymatic reactions. As our surface visualization uses not only the illumination gradient, but also a second parameter, it can bring out different criteria. For molecular surfaces, ambient occlusion serves well, since it provides evidence of indented surface parts. Using an appropriate LUT, we can either illustrate the two parameters individually (cf. Figure 3) or combined (cf. Figure 1(a)). Besides illustrating the shape of the surface, a second intended use case for our method was focus-and-context visualization. Often, users want to see a combination of two molecular models when analyzing protein data, because they highlight different aspects of the protein. For example, the molecular surface shows the interface to other molecules while the cartoon representation shows the functional (secondary) structure of the protein. Usually, the surface is rendered semi-transparently around the other model. Since the molecular surface is generally very uneven, this results in a lot of visual clutter, which makes it hard to identify interesting features in both of the models. Figure 7(b) shows a combined visualization where our illustrative method was applied to the molecular surface in order to provide the context for the internal cartoon representation. Similar methods have been used successfully in medical visualization [TIP05]. Focus-and-context is also essential for visualizing molecular complexes that consist of several identical subunits. Subunits that are in focus can be visualized using classical shading while the others are rendered using our illustrative method in order to provide context as shown in Figure 1(b). As described in Section 4, the initial feedback of our project partners from biochemistry was overall very positive. They liked the visual appearance of our method and believed that it would be beneficial for visual data analysis.
Table 1: Rendering performance of our approach in frames per second (Our). We also provide the frame rate of pure Phong shading as a reference (Phong). Model
#∆
Rhodobacter porin (Fig. 7(b)) Peptide (Fig. 7(a)) Left ventricle (Fig. 10(b)) DNA (Fig. 8) Hydrogel (lower row, Fig. 9) Isomerase II (1st step, Fig. 9) Isomerase I (Fig. 1(a)) Aneurysm (Fig. 10(a)) Lipase (Fig. 6(c)) Potassium Channel (Fig. 7(c)) ATPase (Fig. 1(b))
(a) Cerebral aneurysm
Although we designed our method for the illustration of molecular data, it is a general technique for illustrative rendering. In this section, we show its applicability to medical visualization.
Phong
Our
191 137 145 131 130 127 110 101 83 52 79
120 78 81 75 73 61 73 61 23 19 15
(b) Left ventricle
Figure 10: (a) Qualitative exploration of the hemodynamics (aneurysm); (b) Focus-and-context visualization with the left ventricle and their interior infarction scar.
Exploration of blood flow. In case of cerebral aneurysms – a special kind of vascular disease – the medical researcher is interested in the qualitative exploration of near-wall hemodynamics. Neugebauer et al. [NLB∗ 13] presented a framework for this investigation. They detected regions of interest on an aneurysm using the shape index to examine the underlying blood flow. Afterwards, they visualized the underlying streamlines on a 2D widget. We propose to use the shape index as the scalar field y = ϕ and use the vector field on the surface as the projection of the underlying blood flow data. Thus, we set ϕ as the shape index: ϕ=
6. Applicability for Medical Datasets
30,732 51,200 61,192 65,634 71,702 78,672 83,616 98,970 122,867 207,429 558,640
FPS
κ1 + κ2 1 1 − tan−1 2 π κ1 − κ2
(5)
with κ1 ≥ κ2 as the principal curvatures. ϕ ranges from 0 (cup) to 1 (cap). Thus, we obtain images which can be used for the qualitative exploration. We obtain the streamlines on the surface. Thus, our method can convey both information (shape index and streamlines) in a single 3D scene. c 2014 The Author(s)
c 2014 The Eurographics Association and John Wiley & Sons Ltd. Computer Graphics Forum
Lawonn et al. / LIC for Illustration of Molecular Surface Shape
Figure 9: The Isomerase II (upper row) and hydrogel model in different animation steps with the LUT in 1(b). The upper row shows a gradual change of the surface parameter. The lower row shows different time steps from a simulation trajectory.
Myocardial functional data. In the field of focus-andcontext visualization, we use our method to illustrate a surrounding object in order to distinguish it from the interior objects. We employ our techniques to the left ventricle and shade the infarction scar, resulting from a heart attack, in red. Additionally, we can encode ϕ as the wall thickening of the ventricle. The clinical experts evaluate the heart muscles wall thickening to assess the severity of a heart disease. Our visualization technique is appropriate for this application, since it is able to depict the contraction of the ventricle. Therefore, the domain expert is able to observe the left ventricle during the deformation and can still gain information from wall thickening from our method. Figure 10 shows two examples for the discussed application areas where our method can be used for focus-and-context visualization.
approach provides a frame-coherent illustration and is more tessellation-independent in comparison to ConFIS [LMP13]. For future work, we would like to consider different light positions. When using different kinds of light or different light positions, we have to ensure that the streamlines will have a length which depends on the illumination. In dark regions, the contrast as well as the length of the streamlines must be higher. Another aspect is to transfer our method to topology-varying shape models, so that it can be used for surfaces with varying number of triangles and vertices. Furthermore, we want to investigate the suggestions we got from the initial expert feedback and we plan to integrate our method into a molecular visualization software. Acknowledgments: This work was partially funded by German Research Foundation (DFG) as subproject D.4 of the collaborative research center SFB 716.
7. Conclusion and Future Work We presented a novel illustrative visualization technique for molecular structures. The method detects salient regions and illustrates them using LIC. Hence, the user gets a spatial impression of the surface. The LIC is used to gain an enhanced impression of the curvy surface. Salient region detection is based on the illumination gradient. Furthermore, we use a 2D lookup table (LUT) to encode regions of interest as well as to color code different properties on the surface. Therefore, we propose to compute two scalar fields on the surface and use their values to assign the color of the LUT in their corresponding coordinates. One advantage of the described method is that it can handle animated surfaces and illustrate them in real-time. This work is motivated by molecular visualization, but not restricted to it. Furthermore, our c 2014 The Author(s)
c 2014 The Eurographics Association and John Wiley & Sons Ltd. Computer Graphics Forum
References [BKP∗ 10] B OTSCH M., KOBBELT L., PAULY M., A LLIEZ P., UNO L EVY B.: Polygon Mesh Processing. AK Peters, 2010. 3 [BWF∗ 00] B ERMAN H. M., W ESTBROOK J., F ENG Z., G ILLILAND G., B HAT T. N., W EISSIG H., S HINDYALOV I. N., B OURNE P. E.: The protein data bank. Nucleic Acids Res 28 (2000), 235–242. URL: http://www.pdb.org. 3, 7 [Can86] C ANNY J.: A computational approach to edge detection. IEEE Trans. Pattern Anal. Mach. Intell. 8, 6 (June 1986), 679– 698. 3 [CL93] C ABRAL B., L EEDOM L. C.: Imaging vector fields using line integral convolution. In Proc. of SIGGRAPH (1993), pp. 263–270. 2, 4 [CLK∗ 11] C HAVENT M., L ÉVY B., K RONE M., B IDMON K., N OMINÉ J.-P., E RTL T., BAADEN M.: GPU-powered tools
Lawonn et al. / LIC for Illustration of Molecular Surface Shape boost molecular visualization. Brief. Bioinform. 12, 6 (2011), 689–701. 3 [DFRS03] D E C ARLO D., F INKELSTEIN A., RUSINKIEWICZ S., S ANTELLA A.: Suggestive contours for conveying shape. Proc. of SIGGRAPH (2003), 848–855. 3 [FKE13] FALK M., K RONE M., E RTL T.: Atomistic visualization of mesoscopic whole-cell simulations using ray-casted instancing. Comp. Graph. Forum 32, 8 (2013), 195–206. 3 [FW08] FALK M., W EISKOPF D.: Output-sensitive 3d line integral convolution. IEEE TVCG 14, 4 (2008), 820–834. 2 [GO92] G OODSELL D. S., O LSON A. J.: Molecular illustration in black and white. J Mol Graph 10 (1992), 235–240. 2 [Goo09] G OODSELL D.: The Machinery of Life. Biomedical and Life Sciences. Copernicus Books, 2009. 1, 3
[MDSB02] M EYER M., D ESBRUN M., S CHRÖDER P., BARR A. H.: Discrete differential-geometry operators for triangulated 2-manifolds. In Proc. VisMath (2002), pp. 35–57. 3 [MR11] M UTHUKRISHNAN R., R ADHA M.: Edge detection techniques for image segmentation. IJCSIT 3, 6 (2011). 3 [NLB∗ 13] N EUGEBAUER M., L AWONN K., B EUING O., B ERG P., JANIGA G., P REIM B.: AmniVis - A System for Qualitative Exploration of Near-Wall Hemodynamics in Cerebral Aneurysms. Comp. Graph. Forum 32(3) (2013), 251–260. 8 [OGF∗ 10] O’D ONOGHUE S. I., G OODSELL D. S., F RANGAKIS A. S., J OSSINET F., L ASKOWSKI R. A., N ILGES M., S AIBIL H. R., S CHAFFERHANS A., WADE R. C., W ESTHOF E., O L SON A. J.: Visualization of macromolecular structures. Nature methods 7, 3 Suppl (2010). 3
[HDS96] H UMPHREY W., DALKE A., S CHULTEN K.: VMD – Visual Molecular Dynamics. J Mol Graph 14 (1996), 33–38. 7
[PHWF01] P RAUN E., H OPPE H., W EBB M., F INKELSTEIN A.: Real-time hatching. In Proc. of SIGGRAPH (2001), pp. 579–584. 3
[HPW∗ 12] H UANG J., P EI W., W EN C., C HEN G., C HEN W., BAO H.: Output-coherent image-space lic for surface flow visualization. IEEE PacificVIS (2012), 137–144. 4
[RCDF08] RUSINKIEWICZ S., C OLE F., D E C ARLO D., F INKELSTEIN A.: Line drawings from 3d models. In ACM SIGGRAPH classes (July 2008), pp. 39:1–39:356. 3
[HZ00] H ERTZMANN A., Z ORIN D.: Illustrating smooth surfaces. In Proc. of SIGGRAPH (2000), pp. 517–526. 3
[Ric77] R ICHARDS F. M.: Areas, volumes, packing, and protein structure. Annu. Rev Biophys. Bio. 6, 1 (1977), 151–176. 2
[IFP95] I NTERRANTE V., F UCHS H., P IZER S.: Enhancing transparent skin surfaces with ridge and valley lines. In Proc. of IEEE Visualization (1995), pp. 52–59. 3 [JDA07] J UDD T., D URAND F., A DELSON E.: Apparent ridges for line drawing. In Proc. of SIGGRAPH (2007), p. 19. 3 [Kaj09] K AJALIN V.: Screen-Space Ambient Occlusion. ShaderX7 . Charles River Media, 2009, pp. 413–424. 4
In
[KBE09] K RONE M., B IDMON K., E RTL T.: Interactive visualization of molecular surface dynamics. IEEE TVCG 15, 6 (2009), 1391–1398. 2 [KSES12] K RONE M., S TONE J. E., E RTL T., S CHULTEN K.: Fast visualization of gaussian density surfaces for molecular dynamics and particle system trajectories. In EG EuroVis 2012 Short Papers (2012), vol. 1, pp. 67–71. 7 [KST08] KOLOMENKIN M., S HIMSHONI I., TAL A.: Demarcating curves for shape illustration. In Proc. of SIGGRAPH Asia (2008), pp. 157:1–157:9. 4 [KYYL08] K IM Y., Y U J., Y U X., L EE S.: Line-art illustration of dynamic and specular surfaces. vol. 27, pp. 156:1–156:10. 3 [LCD06] L UFT T., C OLDITZ C., D EUSSEN O.: Image enhancement by unsharp masking the depth buffer. ACM Transactions on Graphics 25, 3 (2006), 1206–1213. 2 [LGP13] L AWONN K., G ASTEIGER R., P REIM B.: Adaptive Surface Visualization of Vessels with Embedded Blood Flow Based on the Suggestive Contour Measure. In Proc. of VMV (2013), pp. 113–120. 4 [LKL06] L EE H., K WON S., L EE S.: Real-time pencil rendering. In Proc. of the symposium on Non-photorealistic animation and rendering (2006), NPAR, ACM, pp. 37–45. 3 [LLC∗ 12] L IPSA D. R., L ARAMEE R. S., C OX S. J., ROBERTS J. C., WALKER R., B ORKIN M., P FISTER H.: Visualization for the physical sciences. Comp. Graph. Forum 31, 8 (2012), 2317– 2347. 3
[SH95] S TALLING D., H EGE H.-C.: Fast and resolution independent line integral convolution. In Proc. of SIGGRAPH (1995), pp. 249–256. 4 [SOS96] S ANNER M. F., O LSON A. J., S PEHNER J.-C.: Reduced Surface: An efficient way to compute molecular surfaces. Biopolymers 38, 3 (1996), 305–320. 7 [SR09] S ENTHILKUMARAN N., R AJESH R.: Edge detection techniques for image segmentation – a survey of soft computing approaches. IJRTE 1, 2 (2009). 3 [SWBG06] S IGG C., W EYRICH T., B OTSCH M., G ROSS M.: GPU-based ray-casting of quadratic surfaces. In Eurographics Symposium on Point-Based Graphics (2006), pp. 59–65. 2 [TCM06] TARINI M., C IGNONI P., M ONTANI C.: Ambient occlusion and edge cueing for enhancing real time molecular visualization. IEEE TVCG 12, 5 (2006), 1237–1244. 2, 4 [TIP05] T IETJEN C., I SENBERG T., P REIM B.: Combining silhouettes, surface, and volume rendering for surgery education and planning. In EuroVis (2005), pp. 303–310. 8 [vdZLBI11] VAN DER Z WAN M., L UEKS W., B EKKER H., I SENBERG T.: Illustrative molecular visualization with continuous abstraction. Comp. Graph. Forum 30, 3 (2011), 683–690. 2 [Vio05] V IOLA I.: Importance-Driven Expressive Visualization. PhD thesis, Institute of Computer Graphics and Algorithms, Vienna University of Technology, June 2005. 1 [Web09] W EBER J. R.: Proteinshader: illustrative rendering of macromolecules. BMC Structural Biology 9:19 (5 2009). 2 [XHT∗ 07] X IE X., H E Y., T IAN F., S EAH H.-S., G U X., Q IN H.: An effective illustrative visualization framework based on photic extremum lines. IEEE TVCG 13 (2007), 1328–1335. 3 [ZHX∗ 11] Z HANG L., H E Y., X IA J., X IE X., C HEN W.: Realtime shape illustration using laplacian lines. IEEE TVCG 17 (2011), 993–1006. 3
[LMP13] L AWONN K., M ÖNCH T., P REIM B.: Streamlines for Illustrative Real-time Rendering. Comp. Graph. Forum 32(3) (2013), 321–330. 1, 3, 6, 7, 9
[ZIK98] Z HUKOV S., I ONES A., K RONIN G.: An Ambient Light Illumination Model. In Proc. of Eurographics Rendering Workshop (1998), pp. 45–56. 2
[LVRH07] L AMPE O. D., V IOLA I., R EUTER N., H AUSER H.: Two-level approach to efficient visualization of protein dynamics. IEEE TVCG 13, 6 (2007), 1616–1623. 2
[ZISS04] Z ANDER J., I SENBERG T., S CHLECHTWEG S., S TROTHOTTE T.: High quality hatching. Comp. Graph. Forum 23, 3 (2004), 421–430. 3, 6
c 2014 The Author(s)
c 2014 The Eurographics Association and John Wiley & Sons Ltd. Computer Graphics Forum