Dec 30, 2017 - as well as validation of the model. The last section provides ..... of intangible assets in total assets and total debt over total assets. Also, a higher.
631
Croatian Operational Research Review CRORR 8(2017), 631–652
Logistic regression modelling: procedures and pitfalls in developing and interpreting prediction models Nataša Šarlija1, Ana Bilandžić1 and Marina Stanić1,† 1
Faculty of Economics in Osijek, J.J. Strossmayer University of Osijek, Trg Ljudevita Gaja 7, 31000 Osijek, Croatia E-mail: 〈{natasa, anag, marina}@efos.hr 〉
Abstract. This study sheds light on the most common issues related to applying logistic regression in prediction models for company growth. The purpose of the paper is 1) to provide a detailed demonstration of the steps in developing a growth prediction model based on logistic regression analysis, 2) to discuss common pitfalls and methodological errors in developing a model, and 3) to provide solutions and possible ways of overcoming these issues. Special attention is devoted to the question of satisfying logistic regression assumptions, selecting and defining dependent and independent variables, using classification tables and ROC curves, for reporting model strength, interpreting odds ratios as effect measures and evaluating performance of the prediction model. Development of a logistic regression model in this paper focuses on a prediction model of company growth. The analysis is based on predominantly financial data from a sample of 1471 small and medium-sized Croatian companies active between 2009 and 2014. The financial data is presented in the form of financial ratios divided into nine main groups depicting following areas of business: liquidity, leverage, activity, profitability, research and development, investing and export. The growth prediction model indicates aspects of a business critical for achieving high growth. In that respect, the contribution of this paper is twofold. First, methodological, in terms of pointing out pitfalls and potential solutions in logistic regression modelling, and secondly, theoretical, in terms of identifying factors responsible for high growth of small and medium-sized companies. Keywords: logistic regression, prediction, firm growth, financial ratios Received: June 06, 2017; accepted: December 21, 2017; available online: December 30, 2017 DOI: 10.17535/crorr.2017.0041
1. Introduction Small and medium sized companies with high growth have been recognized as important drivers of employment (Henrekson and Johansson, 2009), as well as drivers of economic and structural change (Hölzl, 2009). High-growth companies †
Corresponding author
http://www.hdoi.hr/crorr-journal
©2017 Croatian Operational Research Society
632
Nataša Šarlija, Ana Bilandžić and Marina Stanić
are those with annualized growth (in sales, employees or assets) greater than 20% a year over a three-year period (OECD, 2010). The topic of predicting company growth has received considerable attention from both researchers in economics and entrepreneurship (Davidsson et al, 2010; Delmar, 2006). Aside from the academic world, policy makers and financial institutions are also interested in company growth as it results in the emergence and growth of new value-adding and job-creating businesses (Davidsson and Wiklund, 2000). Finally, growth-oriented managers and entrepreneurs can use these models to evaluate and modify their business activities and strategies. Company growth is complex and can be observed from multiple perspectives: at the entrepreneur/manager level, company level and environmental level. Theoretically, a plethora of factors are potentially predictors of company growth. On the one hand, these numerous valuable predictors leave space for researchers to test theoretical hypotheses and, without too much difficulty, to develop a prediction model with good predictive power. On the other hand, the complexity of company growth calls for systematic research strongly founded in theory. Otherwise, comparability and interpretability of the model is significantly reduced. Inconsistencies in growth prediction methodologies have led to mixed results, with a lack of understanding of specific methodological differences that potentially hinder theory development (Davidsson and Wiklund, 2000; Weinzimmer, 1998). The general aim of this study is conduct an empirical investigation of the most common issues concerning prediction modelling of company growth. This paper presents a detailed demonstration of the steps necessary for developing and testing a high-growth prediction model. Furthermore, special attention is directed to common pitfalls and methodological errors in developing the model and suggestions on how to overcome these issues are given. Our research hypothesis is that if company high-growth modelling is done with good theoretical knowledge of growth and statistical methodology with taking care of multicolinearity, overfitting and underfitting on a large data set where error conditions are independent then high-growth model has good performance quality. The structure of the paper proceeds as follows. The following section provides an overview of previous research on growth prediction. Section 3 is a theoretical and empirical explanation of the logistic regression and focuses on common pitfalls and mistakes, particularly in regard to defining dependent variables, using logistic regression in predicting, the underlying assumptions of logistic regression, variable inclusion, as well as selection and multicollinearity. This section also includes an interpretation of the results of growth prediction model for companies in Croatia, as well as validation of the model. The last section provides a discussion, conclusions and implications for further research.
Logistic regression modelling: procedures and pitfalls
633
2. Previous research on growth prediction Most studies in the field of company growth are oriented toward making theoreticcal progress. In that context, factors influencing growth potential are usually identified at three levels: the entrepreneur, the company and the environment. With respect to entrepreneur’s characteristics, previous studies have singled out a willingness to become involved in situations with uncertain outcomes, midmanagement experience, education and the entrepreneur’s aspiration to grow to be relevant growth factors (Cassia et al., 2009; Kolvereid and Bullvag, 1996). From a company perspective, a positive relationship exists between the growth potential of a company and R&D investments, innovation capacity and productivity. Additionally, strategical orientation, financial structure, age and size of a company are significant factors in the potential for growth (Mateev and Aatanasov, 2010; Barringer et al., 2005; Freel and Robson, 2004). Finally, the macroeconomic environment and its stakeholders play an important role in facilitating or obstructing the growth of SMEs. Studies that focus on the methodological aspect of assessing a company’s growth are primarily concerned with defining and measuring dependent variables (Shepherd et al., 2009; Janssen, 2009; Weinzimmer, 1998). Conceptualization of the growth variable may be the most frequently discussed topic among scholars. Researchers tend to omit the theoretical justification for selecting a particular method for measuring growth, and interchangeably use different dependent variables (Janssen, 2009). This approach may hinder the process of theory development and lead to inconsistencies in findings and implications for both scholars and policy makers. From a research standpoint, operationalization of measuring growth can vary based on 1) its conceptualized (growth measured as an increase in revenue, assets, employment, capital, added value or market share), 2) the way it is computed, and 3) its complexity (one dimension or composite index). The most frequently used measures of growth relate to increase in sales (revenues), employment and assets. Each measure has its strengths and downsides. Sales seems to be a weak measure in the very early stage of a venture development when assets and employment may very well grow before the actual company starts generating revenue from selling products or services. On the other hand, sales have a high generality as sales increases usually precede an increase in assets and employment, and sales driven by increased demand for a company’s products or services reflects the company’s level of efficiency and effectiveness (Davidsson et al., 2006). Changes in the number of employees seems to be the best fit for a dependent variable when analyzing company growth from an economics perspective, and the study aims to provide recommendations for policy makers. Employment is not a good measure of company growth when focusing on small and micro businesses given that when such businesses hire an additional single employee it can represent a high percentage increase in employment.
634
Nataša Šarlija, Ana Bilandžić and Marina Stanić
Finally, growth measures related to changes in assets are contentious when studying service industries. Moreover, multicollinearity is a special challenge when modelling asset growth based on financial data. Furthermore, previous studies warn that the practice of using solely absolute measures for growth, such as (tft0) and (tf-t0)/n (where tf and t0, represent company size during the initial and final period of observation, and n represents the number of periods of observation) can be misleading (Delmar, 2006). These give a distorted picture of real growth as it benefits large companies as opposed to the relative measures, such as (tf-t0)/ t0, that favor more small companies when calculating growth rates (Weinzimmer et al., 1998). Regarding the methodology used for modelling company growth, the most frequently used methods are discriminant analysis, logit and probit regressions. Delmar et al. (2003) used correlations and regression analysis to model company growth. Geroski (2005) used static and dynamic optimizing models of company output choice, production functions for modelling corporate learning, models for R&D competition and diversification, and examined their influence on corporate growth rates. Moreno and Casillas (2007) used discriminant analysis to find discriminating variables between high growth and non-high-growth companies. Almus (2002) used probit regression in analyzing factors that influence the probability that a company will achieve fast growth. Probit regression was also used by Arrighetti and Lasagni (2013) in investigating determinants of high growth and calculating the probability of achieving high growth. Sampagnaro and Lavadera (2013) used quantile regression and TOBIT analysis to distinguish between high growth and non-high-growth companies. Mateev and Anastasov (2010) used panel regression analysis in their research in determinants of fast growing SMEs. Heimonen (2012) used logistic regression in his study to identify factors that discriminate between growing innovative SMEs and their noninnovative counterparts.
3. Logistic regression for growth prediction The method to predict growth depends on the data available and characteristics of the variables used in the modelling process. The main motivation for using logistic regression for growth prediction is the fact that it predicts the probability of a company achieving high growth. It gives insight into variables that are important in predicting growth. Positive and negative values of the estimated coefficients from logistic regression reveal whether a particular variable increases or decreases the probability of high growth. Moreover, interpretation of the odds ratio provides additional information on the degree of impact by the variable. In general, regression for 𝑟 independent variables 𝑥 , 𝑥 , … 𝑥 is used to obtain 𝑟 ∈ ℕ coefficients. In logistic regression a dependent variable is binary. In modelling growth prediction, 1 denotes a high-growth company and 0 otherwise. Logistic re-
635
Logistic regression modelling: procedures and pitfalls
gression is used to predicts the probability of a company achieving high growth. Since the dependent variable is binary variable, the relationship between the dependent and independent variables is non-linear. The logistic function, which describes this relationship, is of the form: ⋯
𝑝=
(1)
⋯
where 𝑝 is the probability that the dependent variable is equivalent to 1, meaning high growth. Regression coefficients 𝛽 , 𝑖 = 1,2, … . , 𝑟, are unknown parameters that need to be estimated. The usual approach to estimating them is logistic transformation: 𝑙𝑜𝑔𝑖𝑡(𝑦) = ln
⋯
= ln 𝑒
= 𝛽 + 𝛽 𝑥 + 𝛽 𝑥 + ⋯ + 𝛽 𝑥 = 𝑔(𝑥)
(2) where
is called odds and its logarithm is called log odds. This transformation
provides a linear function, 𝑔(𝑥). It too needs to be estimated. Since the assumptions of linear regression such as normality and homoscedasticity are not met, the least square estimation should be avoided. By denoting 𝑦 to be a realization of the dependent variable, and 𝑥 ′ = (1, 𝑥 , , … , 𝑥 , ) as observed corresponding to r explanatory variables, where 𝑖 = 1, … 𝑛 and 𝑛 being the sample size, where 𝑝 = is (Jobson,2012):
(𝒙𝒊 )
(𝒙 )
, the entire sample likelihood function conditional on 𝒙𝒊
𝐿(𝛽|𝒚) = ∏
(3)
𝑝 (1 − 𝑝 )
where 𝛽 = (𝛽 , 𝛽 , … , 𝛽 ). The logarithm is used to obtain a more manageable form: ln 𝐿(𝛽|𝒚) = ln ∏ 𝑝 (1 − 𝑝 ) (1 − 𝑦 ) ln(1 − 𝑝 )]
=∑
ln 𝑝 (1 − 𝑝 )
=∑
[𝑦 ln 𝑝 + (4)
To estimate 𝛽, (4) is maximized through partial differentiation. The solution is obtained using iterative processes (Czepiel, 2002). Growth modelling has its own specificity, no matter which method is used for developing the model. First, there are lots of variables that can be used as predictors of high growth. This is due to the fact that growth is a complex
636
Nataša Šarlija, Ana Bilandžić and Marina Stanić
phenomenon. There are a multitude of theoretical frameworks focused on explaining growth stages, determinants and future prospects (Davidsson, Wiklund, 2013). It is widely accepted that the growth of a company is most likely nonlinear, temporal and related to the variety of factors that reflect the individual, company, organizational, industry or environmental determinants relating to growth. Second, predictors are often mutually related which means there is a high correlation between them. This is especially true for financial variables. Growth prediction models may also include a range of financial indicators such as lag determinants of a company’s performance extracted from the national register of financial statements. Third, the relationship between particular predictors and measure of growth is inconsistent, i.e., the same predictor relating positively to one growth measure may have a negative impact on a different measure of growth. Some studies have confirmed that growth prediction models based on different measures of growth have different set of predictors (Šarlija et al, 2016; Weinzimmer, 1998). Fourth, it can happen that the sample size in relation to the number of candidate variables is not large enough. An example of such a variable is an industry sector which can be shredded. Fifth, the presence of outliers in data. This is quite often the case when financial variables are included in a data set. Sixth, the presence of missing data. This paper will focus on the more important and common pitfalls and mistakes that can appear when applying logistic regression to model growth prediction. These are: (i) assumptions of logistic regression; (ii) multicollinearity and variable selection; (iii) definition of dependent variable; (iv) interpretation of the results; and (v) use of the receiver operating characteristic curves, so called ROC curve and confusion matrix.
3.1. Assumptions of logistic regression Logistic regression has much more leeway for method assumptions compared to linear regression. It can handle all sorts of relationships because it applies a nonlinear log transformation to the predicted odds ratio. However, there are some assumptions concerning logistic regression that are particularly important in modelling growth (Garson, 2014 ): (I) Avoid over fitting and under fitting: Developing a meaningful logistic regression model for growth prediction requires good theoretical knowledge of growth and statistical methodologies. They both go hand in hand. (II) The error conditions must be independent: Logistic regression requires that each observation be independent. In modelling growth this means that each company should be independently selected in the sample. (III) The model should have no multicollinearity, meaning that the independent variables should be independent from each other. This is quite a challenge when modelling growth. It will be described in more detail further on.
Logistic regression modelling: procedures and pitfalls
637
(IV) Logistic regression requires a large sample size. In modelling growth, there are cases when it is necessary to predict growth for certain data groups, for example, an industry group. For some industry groups, the sample size can be very small and in such cases researchers must be cautious. If the sample size is not large enough, prediction will be biased and it becomes impossible to test the model with standard accuracy measures such as ROC, KS (Kolmogorov–Smirnov statistic) statistics, or t the confusion matrix. Besides an adequate sample size, an adequate count in each cell based on factors should also be satisfied. The presence of small or empty cells may cause the logistic model to be unstable, thus reporting implausibly large b coefficients and odds ratios for independent variables.
3.2. Multicollinearity and selection of variables Multicollinearity exists when there are correlations between independent variables in the regression model. In growth modelling, researchers always have to handle the multicollinearity problem, especially if interested more in interpretability rather than predictability. Datasets for growth modelling are usually composed of many variables arranged into three main categories that influence growth potential: entrepreneur, company and strategy (Storey, 1994). Variables between groups are usually less correlated than variables in each of the groups. This is particularly noticeable between financial variables. Some financial ratios among predictors have identical numerators, some identical denominators, whereas for others ratios, numerators in ratio are identical to denominators in another ratio. It is obvious that multicollinearity is present in such datasets. When present, it may divert and limit research results and conclusions. Multicollinearity may seriously distort the interpretation of a model. Some of the pitfalls that may appear are (Kutner et al, 2004): (I) The estimated regression coefficient of one variable depends on other predictors included in the model. Removing or adding just one variable that correlates with other variables may change the significance as well as the sign of regression coefficients. (II) The precision of the estimated regression coefficients decreases as more predictors are added to the model. (III) The marginal contribution of one predictor variable in reducing the error sum of squares depends on which other predictors are already in the model. (IV) Hypothesis tests for βk = 0 may yield different conclusions, depending on which predictors are in the model (Mason et al., 1991). Regression coefficients biased by collinearity might lead to variables that demonstrate no significant relationship with the outcome when considered in isolation. However, they do become highly significant in conjunction with collinear variables, yielding an elevated risk of false-positive results (Type I error). Alternatively, multiple
638
Nataša Šarlija, Ana Bilandžić and Marina Stanić
regression coefficients might show no statistical significance due to incorrectly estimated wide confidence intervals, yielding an elevated risk of false-negative results (Type II error) (Tu, 2005). Multicollinearity is directly related to variable inclusion and selection, which might be the most important issue when modelling growth. There are lots of variables relating to an individual, company, organizational, industry and environmental determinants of growth. A major problem when building a logistic model for growth prediction is which variable to select and include. There are several modelling strategies that can be used. First, collect as many variables as possible and then insert all of them into the modelling procedure to find something that has significance. This is not a good approach for growth modelling as there can be many variables, and in such cases either fraudulent result may appear or results that cannot be interpreted and not related to growth theory. Second, start from growth theory and combine it with different selection procedures available in statistical software. For example, this approach begins by selecting all the important variables available in the dataset, and then drops them out one by one, preferably the less significant ones. This can be done manually by the researcher or using computer-assisted selection procedures. It starts with putting all variables into the model, and leaving out the one with the highest p-value. This step is repeated until the desired number of variables remains in the model (Bursac at al., 2008). There is another procedure similar to the previous, but it starts with choosing one variable with the lowest p-value and adding it the model. Variables are added one by one, each with the lowest p-value, until the desired number of variables is reached (Bursac at al., 2008). When there is a limited sample size in relation to the number of candidate variables, a pre-selection should be performed. One way to do this is by developing models with just one explanatory variable at a time, and afterwards include in the multivariate model all variables that exhibit a relaxed p-value (for instance, p ≤ 0.25). This relaxed p-value criterion allows reducing the initial number of variables in the model, thus reducing the risk of missing important variables (Sperandei, 2014). In our research, the independent variables consisted of financial ratios and control variables as well as variables related to R&D, investment and export which is especially important for high-growth companies. To get the financial variables, in cooperation with the Financial Agency (FINA) in Croatia, we collected financial statements (balance sheets and income statements) of all micro, small and medium companies in Croatia over the period 2009-2014. In all, 36 variables were placed into 9 groups: (i) R&D; (ii) investment; (iii) liquidity; (iv) export; (v) productivity; (vi) capital structure; (vii) profitability; (viii) turnover ratios, (ix) control variables. According to Croatian regulations, a micro company has less than 10 employees, with annual sales and total annual balance sheet not exceeding 2 million EUR. A small company is defined as a legal entity which employs from
639
Logistic regression modelling: procedures and pitfalls
11 to 50 employees annually, with total annual income and total annual balance sheet not exceeding 10 million EUR. Finally, the category of medium-sized enterprises is made up of legal entities which employ from 51 to 250 persons annually, with annual sales not exceeding 50 million EUR and total annual balance sheet not exceeding 43 million EUR. Data set for our research consisted of 1471 small and medium-sized Croatian companies active between 2009 and 2014. The sample size used for development and validation purposes is shown in Table 1. As it can be seen, in both subsets the ratio of high growth vs non-high growth companies is 50:50. Total number of companies that were active was 56596 and the total number of companies with the high growth in sales was 800. The same number of non high-growth companies are randomly selected. The numbers in the subsamples were reduced to 745 and 726 after controlling for outliers. Sampling was done with R Revolution, using its function sample(). The ratio of dividing the total sample into development and validation subsets is 80:20. Development subset of the sample Sample
High growth
Nonhigh growth
Total in the development sample
SMEs
616
632
1248
Validation subset of the sample Total in NonHigh the high growth validation growth sample 113 110 223
Table 1: Sample sizes for development and validation
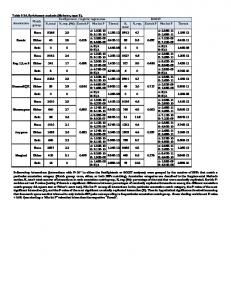
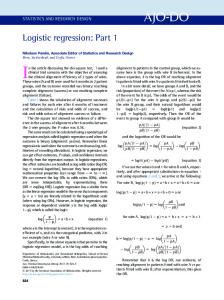
Descriptive statistics for the developing dataset for high-growth and non-highgrowth companies can be found in the Table 2 and Table 3.
Variable code
Description of variable
Research and development intangible assets/total NematImovina** assets ExpdnTA CPLTA
R&D/total assets concessions, patents, licenses, trademarks, software /total assets
Mean (st.dev.)
Non-high growth Mean (st.dev.)
0.0079 (0.0281) 0.00002 (0.0004)
0.0054 (0.0199) 0.00001 (0.0003)
0.0046 (0.0259)
0.0053 (0.0255)
High-growth
640
GWTA Investments InvLATA InvLATE Liquidity ratios Kimovkobv*** Lubrl*** Lkiui crenl Export
Nataša Šarlija, Ana Bilandžić and Marina Stanić
goodwill/ total assets investment in long-term assets/ total assets investment in long-term assets / total expenditures current assets/current liabilities (current assetsinventory)/current liabilities current assets/total assets cash/current liabilities
prihosal
domestic sales/ total sales
prihlsal
export/ total sales
implata
import/ total assets
implate Productivity Pprihzapos*** Turnover ratios Aukupni Adug** Akrat**
0.0005 (0.0156)
0.00006 (0.0015)
0.0135 (0.0355)
0.0142 (0.0343)
0.0147 (0.040)
0.0154 (0.0405)
1.4292 (1.6159)
1.824 (1.7830)
1.2081 (1.6324)
1.4998 (1.7321)
0.6376 (0.3210) 0.3038 (0.5718)
0.644 (0.3194) 0.3441 (0.5777)
import/ total expenditures
0.9217 (0.2377) 0.0144 (0.0620) 0.0055 (0.0241) 0.0053 (0.0239)
0.9448 (0.1980) 0.0109 (0.0477) 0.0051 (0.02083) 0.0064 (0.0249)
sales/number of employees
305453.66 (257511.05)
420584.51 (358858.12)
total revenue/total assets total revenue /fixed assets total revenue /current assets
1.4259 (1.5781) 5.0838 (5.9609) 2.6471 (3.7385) 1.3754 (1.5497) 0.6561 (7.4561)
1.5918 (1.7126) 5.8549 (5.3089) 3.1312 (3.0614) 1.5210 (1.9597) 1.2349 (7.3279)
Asalta
sales/total assets
Asalwc
sales/net working capital
641
Logistic regression modelling: procedures and pitfalls
Anap1* Akrdob Capital structure
365/receivables turnover 365/payables turnover
Zkz***
total debt/total assets
Zdk**
total debt/equity
Blta***
bank loan/total assets
Lclnw*
current liabilities/equity
Prearnta zlongdca Profitability ratios Rosd pnmdg pnroadg pnroed
retained earnings/total assets long-term liabilities/short-term assets net income/sales (net income or loss/ total revenue)*100 (%) (net income or loss/ total assets) *100 net income/equity (%)
* statistically significant at 10% ** statistically significant at 5% *** statistically significant at 1%
92.96 (88.70) 96.06 (89.50)
83.46 (107.70) 88.46 (100.87)
1.3792 (3.0533) 2.1929 (8.7848) 0.0570 (0.1257) 1.6047 (5.8024) -0.3622 (1.4885)
0.86328 (1.7419) 1.2257 (8.4439) 0.0818 (0.1510) 1.0739 (5.5984) -0.0431 (0.8453)
0.7236 (2.3307)
0.5429 (1.7401)
0.1031 (0.4028) 2.4592 (12.7822) 1.5879 (14.734) 6.7937 (12.6929)
0.0687 (0.1375) 3.2453 (12.4058) 3.2516 (13.0139) 7.6172 (11.7660)
Table 2: Descriptive statistics and t-test for differences in means for independent variables
As it can be noticed from Table 2, high-growth companies compared to non highgrowth companies have higher mean values of intangible assets and leverage while lower value is present in current and quick ratios, turnover of fixed and short term assets as well as in ratio of bank loans to total assets and productivity.
642
Nataša Šarlija, Ana Bilandžić and Marina Stanić
Variable code
Age*** Size*** High tech
IND*
Description of variable Control variables >= 7 years old