International Conference on Applied Internet and Information Technologies, 2013 - Regular Papers
Machine Learning Approach for Performance Based Cloud Pricing Model Monika Simjanoska, Sasko Ristov and Marjan Gusev Ss. Cyril and Methodius University, Faculty of Computer Science and Engineering, Skopje, Macedonia
[email protected],
[email protected],
[email protected]
TABLE I
Abstract – The current pricing model that cloud service providers offer, charges the customers according to the amount of rented resources. Cloud service providers assure some quality of the pay-per-use model to the customers through defining service level agreements. However, high performance is almost never guaranteed. Therefore, in this paper, we propose a new cloud service provider pricing model that aims to charge the customers according to their performance demands, instead of charging them by acquired resources. Our model is based on machine learning analysis, which aims to perform accurate decisions when offering both performance and cost-effective configurations in the cloud. Hereupon, customers will gain maximum performance with minimum price, and providers will use resources more efficiently.
VIRTUAL MACHINE (VM) INSTANCE TYPES AND PRICE SIMULATION FOR WINDOWS PLATFORM
Type Windows Azure Google Compute Amazon EC2 Scaling factor
1VM 0,180 0,290 0,182 2
3VM 0,360 0,580 0,364 4
4VM 0,720 1,160 0,728 8
TABLE II VM INSTANCE TYPES AND PRICE SIMULATION FOR LINUX PLATFORM
Type Windows Azure Google Compute Amazon EC2 Scaling factor
I. INTRODUCTION Cloud computing is a new paradigm that enables ubiquitous, convenient, on demand network access to a shared pool of configurable computing resources that can be rapidly provisioned and released with minimal management effort or cloud service provider interaction [1]. The illusion of infinite computing resources available on demand and the ability to pay per use of computing resources on a short-term basis as needed [2], offers several advantages, as reduced costs, ability to scale up as the customer requires, etc. [3]. Computing services need to be highly reliable, scalable, and autonomic to support ubiquitous access. In particular, consumers can determine the required service level through Quality of Service (QoS) parameters and service level agreements [4]. The cloud service provider is required to execute service requests from a customer within negotiated quality of service requirements for a given price [5]. Even though service level agreements provide some level of guarantee of how much of the time the server, platform, or application will be available, the performance is almost never discussed [6]. To fulfill the customer’s expectations of proportionality between the performance and the amount paid for resources, we believe that cloud service providers must confront the challenge of configuring their offers in maximum performance – minimum cost manner. The first step towards the maximum performance – minimum cost concept, was to discuss the performance, i.e., to inspect if the current cloud service providers’ business model is beneficial for the consumers. Therefore, in our previous research, we used the current linear pricing offers of the most common cloud service providers: Windows Azure [7], Google Compute [8] and Amazon EC2 [9], to investigate if the performance gain scales to the consumer’s monetary costs for
1VM 0,090 0,145 0,091 1
1VM 0,060 0,145 0,060 1
1VM 0,120 0,290 0,120 2
3VM 0,240 0,580 0,240 4
4VM 0,480 1,160 0,480 8
rented resources. Following the configurations presented in tables I and II, which only differ in price depending on the platform, we created our testing environments. Hereafter, we tested web services with different demands in each of the cloud configurations we defined. The response time analyses of the different web services showed that the costperformance relation depends on the web services’ characteristics. The overall results showed that for a less demanding web service the customer will gain maximum performance for the particular investment, but when adding more characteristics to the web service this performance gain decreases. However, generally the performance gain stays positive [10]. After we proved that the performance scales to the price well enough, we continued our research to inspect the performance impact when sharing the same infrastructure resources among multiple tenants. As we obtained the response time from the testing, we came up with the idea to test its ability to distinguish between different multi-tenant cloud configurations in combination with other metrics as: transactions per second, bytes and bytes per seconds. Using a machine learning approach, we achieved satisfying overall response of 0.904 value of correlation between the outputs and the targets [11]. Hereupon, in this paper we propose performance based pricing model that aims to follow pay-per-performance manner instead of the current pay-per-use pricing scheme. Our approach is machine learning based and allows the cloud service providers to classify and map the customer’s input load
Page 74
International Conference on Applied Internet and Information Technologies, 2013 - Regular Papers into specific cloud configuration. Thus, it uses previous web services analysis in different cloud environments to model the configurations. Once the model is made, the cloud service provider is ready to offer the consumer a maximum performance- minimum cost configuration based on the customer’s particular input load. The rest of the paper is organized as follows. Section II presents recent work related to machine learning in the cloud. The new methodology based on machine learning is presented in Section III. In Section IV we present a case study and the experiments from the methodology implementation. Finally, in Section V we derive overall conclusion and we present our plans for a future improvement.
II. RELATED WORK This section presents an overview of the recent related work to the use of different cloud behaviors in terms of performance for various resource allocations and several machine learning techniques used in the cloud. In our recent research, we analyzed several different scenarios of web service performance while scaling the resources in the cloud, by varying the client load for different types of applications. For example, the customers can achieve better performance if they utilize smaller VMs rather than by releasing a smaller VM and renting a greater VM, using the same total amount of resources [12]. The cloud achieves even greater performance than the scaled resources for CPU intensive algorithms [13]. The average CPU utilization also varies while scaling the resources and using the same amount of resources, which are allocated in different number of VMs [14]. Both customers and cloud service providers can benefit from intelligent virtualized resources. For example, SmartSLA is a machine learning powered solution for intelligent virtualized resources management [15]. Ganapathi et al. present a statistical driven modeling and its application to data intensive workloads is presented by [16]. By using the statistics, they predict the resource requirements for cloud computing application. This will allow the customers to implement job scheduling, resource allocation, and workload management in their applications. Bodik et al. [17] predict the performance of the system for future configurations and workloads with machine learning approach. Their control policy minimizes resource usage while maintaining the performance. Cloud computing is often hosted on energy consuming data centers. Therefore, energy consumption optimization is another cloud computing and data center issue. Chen et al. [18] adopted machine learning methods for data center workload, thermal distribution and cooling facilities management. The prediction of the performance is also very important research challenge. For example, CloudProphet [19] predicts the response time of an on-premise web application that migrates to a cloud. Another example, CloudGuide [20] explores
a cloud configuration that meets the performance requirements.
III. THE MACHINE LEARNING APPROACH In this section we present a methodology using machine learning, which is based on our infant proposal in [21]. A. Input Data Classification We present a statistical procedure that suggests the best VM configuration for a particular input (load). To obtain a reliable suggestion, cloud service providers must ensure a realistic heterogeneous environment. Thus, an appropriate surrounding would be the one with various cloud settings, hosting web services with different characteristics, loading the servers with a variable load, and a tool to measure the performance in terms of response time and CPU. According to the existing offers and pricing models on the market, the most common cloud service providers offer their resources organized in a VM with different amount of CPUs, RAM and storage space. Therefore, we propose to create the classes according to the VMs that the cloud service provider offers. Their cloud resources are elastic and scalable. Upgrade option after releasing the existing ”smaller” VM can be realized in two ways, either by renting a new ”bigger” VM with more resources, or, by renting ”smaller” VMs and balancing the load among them. Downgrade options are realized in opposite way, by releasing the more powerful VM and renting a less powerful VM, or, by decreasing the number of smaller VMs that configure a parallel organization of their solution. These two approaches to use one VM or more VMs lead to a proposal of two classifications: Single-VM Scaling and Multi-VM Scaling Allocation classes. 1) Single-VM Scaling Class: - used if a customer wants to scale the resources by releasing the existing VM and instantiating a new more powerful VM. We classify the input data as Ci, where i denotes the number of scaled resources within a single VM. For example, according to the current market offer of VMs and the number of processor cores in each VM, the classes will be C1, C2, C4 and C8; and 2) Multi-VM Scaling Allocation Class: - used if a customer wants to scale the resources by instantiating smaller number of VMs instead of the existing number of used VMs. We assume that the customer is using a load balancing technique to activate (instantiate) or deactivate an appropriate VM. The input data should be classified as Cji, where denotes the number of scaled VMs and denotes the number of scaled resources within each scaled VM. For example, according to the current VMs on the market, the classes will be Cj1, Cj2, Cj4 and Cj8, where is the number of required VMs.
Page 75
International Conference on Applied Internet and Information Technologies, 2013 - Regular Papers
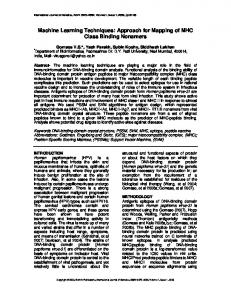
Fig. 1. Cloud testing environment
B. Classification Parameters
In this section we present a simple case study according to our defined methodology in Section IV, which also can be adopted for all most common cloud service providers.
the cloud testing environments we consider a single user case and followed cloud service providers’ pricing schemes presented in tables I and II. Therefore, we defined three different cloud environments, i.e., three classes, to simulate realistic occasions when a customer rents different amount of resources: Class 1 - - VM instance with 1 CPU (core); Class 2 - - VM instance with 2 CPUs (cores); and Class 3 - - VM instance with 4 CPUs (cores). In order to test various web services, we used two document style Java web services. The first web service is a memory demanding web service and returns the concatenation of two strings (Concat web service - CWS). The second accepts two strings and returns their concatenation, but sorted alphabetically (Sort web service - SWS). It is computation intensive, besides the memory demanding feature. Each testing environment hosts the two web services. The generation of variable server load was performed using the SoapUI [23] software. Each VM instance is loaded with messages with parameter size of KB each. The range of parameters and is selected such that the web servers in VM instances work in a normal mode, without replying error messages and avoiding saturation. The web services are loaded with 12, 100, 500, 752, 1000, 1252, 1500, 1752 and 2000 requests per second for each message { } KB. The whole cloud testing parameter size environment is depicted in Figure 1. Once we collect enough data from the various test cases, we can proceed to the preprocessing part and produce applicable data for machine learning analysis.
A. Input Load Simulation
B. Data Pre-processing
As an appropriate testing environment we choose to use a client-server architecture deployed in the open source cloud platform OpenStack [22] using KVM hypervisor to instantiate VM instances. The client and server nodes are installed with Linux Ubuntu Server 12.04 operating system. Hardware computing resources consist of Intel(R) Xeon(R) CPU X5647 @ 2.93GHz with 4 cores and 8GB RAM. The VM instances consist of Linux Ubuntu Server 12.04 operating system and Apache Tomcat 6 as the application server. While preparing
The data obtained from the testing environment is raw and inclined to noise. The source of noise can be either the phenomenon that the same VM does not always achieve the same performance using the same hardware at different times among the other active VMs [24], or, due to some other causes as network latency, or, network throughput. To remove any unexpected variability and picks, the raw data needs to be preprocessed. Preprocessing is essential for transforming the parameter values into a new space of variables suitable for
In order to compare the classification capabilities of the different metrics for performance evaluation, a customer and cloud service providers should define classification parameters. The classification parameters can be: average response time, throughput in bytes per second, throughput in messages per second, the customer’s cost for leasing the resources, the cloud service provider’s cost, server’s CPU utilization, memory utilization and so on. We must note that some of these classification parameters will be the same since both customers and the cloud service providers are concerned, while other classification parameters will be used only by one side. For example, response time will be a common classification parameter, while the CPU utilization for a certain load will be mostly a parameter analyzed only by the cloud service provider. Let’s denote the customer’s classification parameters with and the cloud service providers’ with . Classification parameters match if for a certain value of and . If there is no match for any value of and , then the classification parameters differ, either exist only for the customer, or, for the cloud service provider.
IV. CASE STUDY
Page 76
International Conference on Applied Internet and Information Technologies, 2013 - Regular Papers classification. Each web service testing produced different results. Therefore, we organized the data in matrices for each test case specified in Section IV-A by merging the measurements for both web services according to the message parameter size and the number of requests . Furthermore, in order to compare the classification capabilities of the different metrics for performance evaluation, we defined three classification cases: Classification case 1 - The performance measured in terms of the Response Time; Classification case 2 - The performance measured in terms of the CPU utilization; Classification case 3 - The performance measured in terms of Cost. We choose these classification cases such that to have a common classification case (classification case 1), and at least one that concerns either the cloud service provider (classification case 2), or, the customer (classification case 3). The response time is actually the average response time, measured with the SoapUI tool. The CPU measurements were captured using a top utility tool running on the server side. In order to calculate the cost, in (1) we use the average response time , and the total number of processors used, . (1) Once the matrices are constructed according to defined classification cases, we need to normalize the values in a particular interval. When selecting an appropriate normalization method, we take into account that the parameters are measured for different web services. Thus, we need a method which will normalize the values, but still preserve all the relationships in the data. Considering the response time matrix, we normalized the data by mapping the rows values to mean 0 and standard derivation to 1, whereas to normalize the CPU and cost data. We mapped the rows minimum and maximum values to . Even though our problem does not handle hundreds of parameters, we believe that the principal component analysis may be advantage. Principal component analysis (PCA) is a multivariate technique that intents to extract the important information from the matrix, to represent it as a set of new orthogonal variables and to display the pattern of similarity of the observations [25]. After using the PCA, some message sizes have been removed as unnecessary parameters. Once the raw data is preprocessed, it is prepared for the classification process. C. Using the Machine Learning Since the data is labeled and we know the desired output for each input vector, we can use supervised machine learning techniques. When using a supervised learning technique, the classifier learns from a training data. The training data needs to be carefully selected so that the overfitting classification issue must be avoided. If overfitting occurs, then the classifier is biased to the training data, and the classifier’s accuracy decreases when new unknown data arrives. To prevent overfitting, we used a specially designed function in Matlab that randomly divides the input data into three non-overlapping sets according to specified ratio values. The training set was
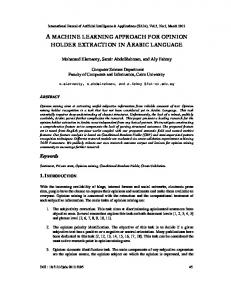
used to train the classifier, the validation set was used to adapt the classifier, and finally the testing set was used to test the classifier’s ability to discriminate between the three classes. When choosing appropriate classification technique, we must be aware of the multiclass problem. Kotsiantis et al. [26] state that neural networks tend to perform well with multidimensions and continuous features. Therefore, we decided to use a probabilistic neural network (PNN), as a kind of radial basis network suitable for classification problems. After the classifier is trained, it is ready to classify new and unknown load inputs. F. The Experiments In this section we present the conducted experiments. We analyzed the web services’ performance in the three cloud environments defined in Section IV-A in terms of CPU and response time. In order to measure each metric’s capability of distinguishing the three cloud environments, we decided to use both of them independently in the classification process. Additionally, in order to make economy model of the classes, we calculated the cost using the response time for all three test cases with different number of VM instances. All input data was normalized according to the normalization methods discussed in Section IV-B. After that the data is being divided into three non-overlapping sets of which 60% of whole data belongs to the training set, 20% belongs to the validation set and 20% belongs to the testing set. After appropriate preprocessing of the training data, we used principal component analysis to find pattern similarities. The principal components that contribute less than 1% to the total variation in the data set were eliminated. Hereupon, we used probabilistic neural network with a spread of radial basis function of 0.01, to map the data into three classes, each with different number of CPUs. As a classification technique, we used the two layers PNN depicted in Figure 2. In the training process we used batch training function with weight and bias learning rules. After the network was trained, we proceeded with its adaptation to the validation set. As an adaptation function we used a function that trains a network with weight and bias learning rules. After the network was trained, we proceeded with its adaptation to the validation set. As an adaptation function we used a function that trains a network with weight and bias learning rules with sequential updates [27]. Eventually, the network has been trained in 50 epochs and adapted in 100 passes. The results show that the response time and the cost analysis perform the best classification. Hereupon, taking the results from these metrics, the cloud service provider can offer the customer both high demanding and economical VM configuration. For example, a particular load known to belong to class 1, according to response time was classified as it belongs to class 4. It means that once the cloud service provider gets the load, it will propose a VM with 4 cores to the customer. However, the classification according to the cost analysis proposed a VM with 1 core to be the appropriate cost-effective choice. Therefore, considering the high accuracy of the classifier, and also the real classes, we assume that this decision is reliable.
Page 77
International Conference on Applied Internet and Information Technologies, 2013 - Regular Papers
Fig. 2. Probabilistic Neural Network
V. CONCLUSION AND FUTURE WORK The current cloud service providers business model charges the consumers according to the amount of rented resources. In this paper we propose a new cloud service provider pricing model that aims to charge the customers according to their performance demands. To obtain a realistic modeling we provided appropriate testing environments, each with different number of CPU cores. The testing procedure produced results for the response time and the CPU. We additionally used the response time to provide cost analysis. Hereupon, we implemented well defined methodology to preprocess the data and prepare it for machine learning analysis. In order to handle the multiclass problem we used probabilistic neural networks. The results from the classification showed accurate decisions when mapping the data into each cloud setting. That is, the cloud service provider should propose a VM with 4 cores to the customer in order to achieve maximum performance, and a VM with 1 core for the appropriate cost-effective choice. In our future work, we aim to improve the presented methodology by performing more tests to obtain different performance metrics, and therefore, to build even more accurate classifier based on machine learning analysis.
REFERENCES [1] P. Mell and T. Grance, “The NIST definition of cloud computing,” National Institute of Standards and Technology, Information Technology Laboratory, 2011. [2] A. Fox, R. Griffith, A. Joseph, R. Katz, A. Konwinski, G. Lee, D. Patterson, A. Rabkin, and I. Stoica, “Above the clouds: A Berkeley view of cloud computing,” Dept. Electrical Eng. and Comput. Sciences, University of California, Berkeley, Rep. UCB/EECS, vol. 28, 2009. [3] R. L. Grossman, “The case for cloud computing,” IT professional, vol. 11, no. 2, pp. 23–27, 2009. [4] R. Buyya, C. S. Yeo, and S. Venugopal, “Market-oriented cloud computing: Vision, hype, and reality for delivering it services as computing utilities,” in High Performance Computing and Communications, 10th IEEE Int. Conf. on, 2008, pp. 5–13. [5] K. Xiong and H. Perros, “Service performance and analysis in cloud computing,” in Services-I, World Conference on. IEEE, 2009, pp. 693–700. [6] D. Durkee, “Why cloud computing will never be free,” Queue, vol. 8, no. 4, p. 20, 2010. [7] Microsoft, “Windows Azure,” September 2013. [Online]. Available: http://www.windowsazure.com/pricing/ [8] Google, “Compute Engine,” September 2013. [Online]. Available: http://cloud.google.com/pricing/ [9] Amazon, “Amazon EC2,” September 2013. [Online]. Available: http://aws.amazon.com/ec2/
[10] M. Simjanoska, G. Velkoski, S. Ristov, and M. Gusev, “Does the performance scale the same as the cost in the cloud,” in Information Technology Interfaces (ITI), Proceeding of ITI2013 35th International Conference. IEEE, 2013, pp. 83–88. [11] ----, “Machine learning based classification of multitenant configurations in the cloud,” in XLVIII International Scientific Conference on Information, Communication and Energy Systems and Technologies, ICEST, 2013. [12] M. Gusev, S. Ristov, G. Velkoski, and M. Simjanoska, “Optimal resource allocation to host web services in cloud,” in Cloud Computing (CLOUD), IEEE 6th International Conference on, June 2013, pp. 948–949. [13] M. Gusev and S. Ristov, “Superlinear speedup in Windows Azure cloud,” in 2012 IEEE 1st Int. Conf. on Cloud Networking (CLOUDNET) (IEEE CloudNet’12), France, 2012, pp. 173–175. [14] G. Velkoski, M. Simjanoska, S. Ristov, and M. Gusev, “CPU utilization in a multitenant cloud,” in EUROCON – Int. Conf. on Computer as a Tool (EUROCON), 2013 IEEE, pp. 242–249. [15] P. Xiong, Y. Chi, S. Zhu, H. J. Moon, C. Pu, and H. Hacigumus, “Intelligent management of virtualized resources for database systems in cloud environment,” in Data Engineering (ICDE), IEEE 27th International Conference on, 2011, pp. 87–98. [16] A. Ganapathi, Y. Chen, A. Fox, R. Katz, and D. Patterson, “Statistics driven workload modeling for the cloud,” in Data Engineering Workshops IEEE 26th Int. Conf. on, 2010, pp. 87–92. [17] P. Bodık, R. Griffith, C. Sutton, A. Fox, M. Jordan, and D. Patterson, “Statistical machine learning makes automatic control practical for internet datacenters,” in Proceedings of the 2009 Conference on Hot topics in cloud computing, 2009, pp. 12–12. [18] H. Chen, P. Kumar, M. Kesavan, K. Schwan, A. Gavrilovska, and Y. Joshi, “Spatially-aware optimization of energy consumption in consolidated datacenter systems,” Proc. of InterPACK, Portland, OR, 2011. [19] A. Li, X. Zong, S. Kandula, X. Yang, and M. Zhang, “Cloudprophet: towards application performance prediction in cloud,” in ACM SIGCOMM Computer Communication Review, vol. 41, no. 4, 2011, pp. 426–427. [20] S. H. Liew and Y.-Y. Su, “Cloudguide: Helping users estimate cloud deployment cost and performance for legacy web applications,” in Cloud Computing Technology and Science (CloudCom), 2012 IEEE 4th Int. Conf. on. 2012, pp. 90–98. [21] M. Simjanoska, G. Velkoski, S. Ristov, and M. Gusev, “New cloud business model towards performance,” in Proceedings of The 3rd Int. Conf. on Information Society Technology and Management, ICIST, 2013. [22] OpenStack, “Openstack cloud software,” Jan. 2013. [Online]. Available: http://openstack.org [23] SoapUI, “Functional testing tool for web service testing,” Jan. 2013. [Online]. Available: http://www.soapui.org/ [24] Y. Koh, R. Knauerhase, P. Brett, M. Bowman, Z. Wen, and C. Pu, “Analysis of performance interference effects in virtual environments,” in Performance Analysis of Systems & Software, ISPASS 2007. IEEE Int. Symposium on, 2007, pp. 200–209. [25] H. Abdi and L. J. Williams, “Principal component analysis,” Wiley Interdisciplinary Reviews: Computational Statistics, vol. 2, no. 4, pp. 433–459, 2010. [26] S. Kotsiantis, I. Zaharakis, and P. Pintelas, “Supervised machine learning: A review of classification techniques,” Frontiers in Artificial Intelligence and Applications, vol. 160, p. 3, 2007. [27] Mathworks, “Matlab and Simulink for technical computing,” 2013
Page 78