Machine Learning based Work Task Classification Michael Granitzer Know-Center Graz & Graz University of Technology
[email protected] Christin Seifert Know-Center Graz
[email protected]
Andreas S. Rath Know-Center Graz
[email protected]
Mark Kr¨oll Knowledge Management Institute Graz University of Technology
[email protected]
Doris Ipsmiller m2n - consulting and development gmbh
[email protected]
Nicolas Weber Know-Center Graz & Graz University of Technology
[email protected]
Abstract: Increasing the productivity of a knowledge worker via intelligent applications requires the identification of a user’s current work task, i.e. the current work context a user resides in. In this work we present and evaluate machine learning based work task detection methods. By viewing a work task as sequence of digital interaction patterns of mouse clicks and key strokes, we present (i) a methodology for recording those user interactions and (ii) an in-depth analysis of supervised classification models for classifying work tasks in two different scenarios: a task centric scenario and a user centric scenario. We analyze different supervised classification models, feature types and feature selection methods on a laboratory as well as a real world data set. Results show satisfiable accuracy and high user acceptance by using relatively simple types of features.
I. Motivation Knowledge-intensive work plays an increasingly important role in organizations of all types. Workdays are characterized by processing and manipulating more and more digitized information. So far, indexing and search tools have been employed to make the stored information accessible. However, people realized, that systems have to take the knowledge worker’s context into account to be truly supportive. As recently discussed in the information retrieval community [1], the emphasis of future information retrieval applications ought to be put on exploiting the user’s current context in order to increase the accuracy of retrieval results. Knowing the knowledge worker’s current work activities, i.e., the work task the user resides in, allows various ways for support. Search queries can be generated based on the user context, submitted and the results can be ranked according to the user’s profile and context. Furthermore, guidance through the work process may be provided automatically and declared experts may be suggested. Other research groups have recently started to examine approaches that are capable of identifying the current work task of a user. The TaskTracer project [3] at Oregon State University monitors human computer interactions with computer desktops and
Didier Devaurs Know-Center Graz
[email protected]
Stefanie Lindstaedt Know-Center Graz & Graz University of Technology
[email protected]
provides data for the machine learning system TaskPredictor [14]. Three major processing steps are incorporated into the system: (i) feature selection by mutual information, (ii) classification based on confidence threshold and (iii) classification with hybrid Na¨ıve Bayes and SVM classifiers. The SWISH [11] system, developed at Microsoft Research, approaches user task predictions by clustering desktop windows on (i) window titles and (ii) window sequence. The basic assumption is that windows related to each other belong to the same task and that relations can be found by analyzing the window titles. Drezde et al. [4] applied various, similarity based methods to categorize emails by activities yielding promising results. Kellar et al. [9] noted that the knowledge of a user’s current task type allows information filtering systems to apply useful measures for user interest. They focused on discovering features and studying their predictability for specific task types in web browsers. While previous work demonstrated the feasibility of work task classification, important properties like differences among learning techniques, feature representation, and predictable kinds of tasks are yet unclear. In this work, we analyze different machine learning techniques and feature types for work task classification and compare them to results reported in literature. Due to missing standard and real world test data sets we present our own data acquisition strategy and the underlying data model which contains content and interaction based feature types. Based on the recorded real world interaction patterns, we •
compare the accuracy of standard machine learning techniques
•
compare the impact of entropy based feature selection
•
analyze the impact of content based and interaction based feature types
•
compare different scenarios for work task classification
The data sets used for evaluation reflect two different scenarios. In the first scenario, referred to as task centric scenario, we defined a set of tasks users had to work on. After
a training phase, the system automatically identifies the current work task from this set. Since task categories are given a-priori, we refer to this scenario as task centric scenario. This scenario allows us to analyze whether our approach is capable to identify the same tasks over different groups of users, if trained accordingly. In scenario two, referred to as user centric scenario, work tasks are guessed a-priori by the system and labeled by the user afterwards. Our task here is to accurately predict the user given label, if a similar task occurs again. Since the user is allowed to give what ever label she wants, this scenario allows us to evaluate whether our approach can capture the work behavior of a single user. Our results demonstrate to favor the Na¨ıve Bayes and the k-Nearest Neighbor approaches over Support Vector Machines and support findings of other groups, that window title based features are the most suitable form of representation. Overall, our work shows the maturity and applicability of work task classification in practical, real world scenarios.
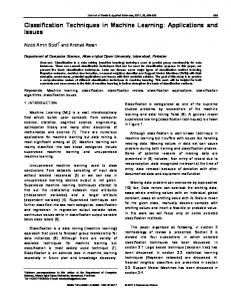
on. For a more detailed description of the monitoring process, we refer to [7, 12]. B. Data Model Monitoring low level events results in massive amount data, intractable to be analyzed by machine learning techniques in near real time. So the question on how to cope with this mass of data has to be addressed. Figure 1 depicts our aggregation model and transformation techniques used for aggregating low level events to work tasks. In a first step, a predefined static rule set aggregates low level event sequences to so-called event blocks which can be understood as intermediate representation form which groups together interaction on the same resource. An example of such a static mapping can be as follows: The user opens MS Windows and writes a paragraph, yielding numerous mouse click and keystroke events. This set of events is combined to an event block called edit a word document. The actual structure depends on the nature of an event block, i.e., which types of events it was aggregated over, whether an application provides particular data or not. Especially application-independent event blocks, like for example console events, rarely contain data at all.
The paper is structured as follows: The methodology that we followed to create a resource for task classification is described in Sections II. Data sets used, test design and experimental results for the task centric scenario are presented in Section III, while results on the user-centric scenario are presented in Section IV. The findings are discussed and compared to two other task classification approaches in Section V. Section VI contains concluding remarks and an outlook on future work.
In a second step before classifying work tasks, the event blocks are automatically clustered based on their content resulting in event block clusters. Event blocks that share a significant amount of words are likely to end up in the same cluster. The event block clusters are validated and labeled by the user thus becoming task instances and the ground truth for learning the users task model.
II. Work Pattern Acquisition This section describes the steps that are necessary getting from the recorded, raw data to the data that is used in our experiments and which may be used in a real world application. Therefore, we had to address that (i) the amount of data quickly reaches a critical value, if every single click is monitored, (ii) data is heterogeneous in nature, e.g., sequence data, textual contents, nominal values, (iii) data is noisy and (iv) interaction patterns tend to be very user specific. In order to cope with these challenges, we introduce a data model that allows data preprocessing, data aggregation and data abstraction. A. Data Acquisition Data acquisition starts on the lowest level on which the user interaction context is automatically captured. The user interaction context comprises all interactions of the user with resources, applications and the operating system on the computer desktop. The data about these interactions are referred to as events. Currently, monitored low level events are keystrokes, mouse movements and mouse clicks. Furthermore, for some applications it is possible to record the content managed by the application. In utilizing these functionality it is possible to access the content directly, when the user focuses such a supported application. Filename, author, organization, used template, document structure, whole document content, page number, window title or even just the content that the user currently sees on the screen are only small pieces of the data we ground the context construction
Figure. 1: Relationships between events, event blocks and tasks for context detection.
C. Data Description
2
In our experiments we used following four fields for the event blocks: Application Name, Content, Window Title and Semantic Type. Besides the semantic representation of an event block, the interior structure of an event block consists of 31 different fields, 13 general and 18 application-dependent ones. Taking only 4 out of 31 fields into account needs explanation and justification. Analysis of the field characteristics showed that fields containing content
(non-empty fields) are unevenly distributed. The majority of the empty fields are application dependent. Furthermore, we opted for those fields providing data that is uniformly distributed over all event blocks, so to say adequately covering the entire data set.
E. Training Data Acquisition Two different scenarios have been considered to acquire training data. Scenario one utilizes a task centric point of view. Herein, we defined a fixed set of tasks a controlled user group has to work on. The user marks the begin of a task and the end of the task after its completion. This allows us to explore whether our system is capable to correclty identify the same tasks over a different group of users, i.e. that it generalizes over different working behaviours. The second scenario, named user centric scenario, can be seen from a single user’s perspective. To acquire our test data set, the untrained systems starts to record user interactions, aggregate them to event blocks, cluster those event blocks and provide the cluster result as a-priori task suggestion to the user. The user labels the task suggestions and may manually rearrange event blocks via the user interface. This experiment allows us to analyse whether our approach can capture the work behaviour of a single user.
The field Application Name, abbreviated as A, contains the name of the application the user is working with. For instance, if the user reads a document in Adobe Acrobat Reader, the field will contain the value acrord. Sensors for following applications have been implemented: MS Word, MS PowerPoint, MS Excel, MS Internet Explorer. In addition, a file system sensor, a clipboard sensor and a generic Windows XP system sensor allow for 14 different entries in the field Application Name. The field Content, abbreviated as C, stores the language dependent content of the current window, which can be the text on the current MS PowerPoint slide or the content of the website the user is viewing. In our data set German and English content occurs, even mixed, e.g., a webpage with German content and English navigation elements. The raw Content field includes also special characters, markup and end-of-line characters.
The following sections outline in detail the data set structure, analyse data set properties and provide accuracy results for different machine learning techniques.
III. Task Centric Scenario
The field Window Title, abbreviated as W, contains the title of the current window. Depending on the application Window Title may (e.g. MS Word) or may not (e.g. Novel Groupwise, new email window) include the name of the application.
A. Data Set Structure
The field Semantic Type, abbreviated as S, stores a rulebased generated type taking on three different values. The values indicate whether a document is (i) read or (ii) edited by the user, or whether the state is (iii) unknown. The assignment of a semantic type is application dependent. Only MS Word, MS PowerPoint and MS Excel sensors are capable of allotting the semantic types (i) reading or (ii) writing. The discrimination is based on simple rules. If one key stroke is detected, the whole event block is classified as writing, otherwise as reading. Event blocks generated by other applications receive the semantic type unknown. D. Data Preprocessing Textual raw contents in the fields A, C, and W have been preprocessed by the following 4 steps (in this sequence): (i) remove EOL (end-of-line), (ii) remove markup, e.g., \&lg and ![CDATA, (iii) remove all characters but letters, (iv) remove German and English stopwords. As stated above the fields may contain words from mixed languages, so that stemming algorithm are hardly applicable. Preliminary experiments did not show any significant differences in classification performance and thus we omitted stemming. For each event block we formed a ’bag of words’ representation for all fields and calculated the TF-IDF1 measure. We used the Information Gain (IG) measure to rank features by their discriminative power. Information Gain is among the most common measures for feature selection in machine learning. 1 term
frequency−inverse document frequency
3
In the task centric scenario we selected five typical task models from our domain for the experiment. Three task models were routine tasks (Task 1: “Filling in the official journey form”, Task 2: “Filling in the cost recompense form for the official journey”, Task 3: “Creating and handing in an application for leave”) and two were knowledge-intensive tasks (Task 4: “Planning an official journey”, Task 5: “Organizing a project meeting”). Before we started the experiment we did an online questionnaire to confirm that the descriptions of the task models are clear to the users and that the routine task are tasks that have already been executed by the employees several times before. The dataset we gained by the methods and techniques presented in the previous sections has 218 task instances (Task 1: 55, Task 2: 45, Task 3: 51, Task 4: 52, Task 5: 15) from 14 participants. Half of the task instances were collected on a single laboratory computer common to all users and the other half on the employees’ own work station computers. Our experiment was carried out in the knowledgeintensive domain of the applied research. It was preceded by an analysis phase, during which several requirements were defined, by interviewing knowledge workers. Users required to know what kind of data was recorded to be able to access and modify it and that the evaluation results were anonymized. They could practice with the recording tool for a week before the experiment in order to reduce the bias of unfamiliarity during the experiment. This study/experiment was exploratory, the comparison was within subjects and the manipulations were achieved by the executed task (five different tasks). Manipulation - Task: The manipulation resulted from varying the tasks themselves. During a preliminary meeting, the participants of the experiment agreed on a selec-
tion of five tasks typical of the knowledge worker domain. These tasks had different characteristics in terms of complexity, estimated execution time, number of involved resources or granularity. A short questionnaire was issued before starting the experiment to make sure that the probands understood the tasks they had to perform, and also to have them thinking about the tasks before they actually executed them. During the experiment, for capturing the users’ usage data, we have used multiple sensors [13] that record the user interactions with resources and applications on the computer desktop. Table 1 gives an overview of the number of instances, the number of attributes (the number of different terms in the term vector) and the number of classes for selected field combinations for the used dataset (Dataset T).
(i) research in the task detection area reported that good results have been achieved for a lower number of attributes, more specifically between 200-300 attributes [14, 10] and (ii) to also investigate the task classification performance of the learning algorithms for higher number of attributes as well. Stratified 10-fold cross-validation was applied and statistical values for each fold were computed. In addition, the mean and standard deviation of all values were calculated across all folds. We measured the accuracy (a) of the used algorithms, the number of attributes (g), the micro precision (p) and micro recall (r). In comparison to the user centric scenario there was no evaluation of the Semantic Type feature. D. Results of the Task Centric Scenario Table 2 shows the results for the task centric scenario. For each field combination/classifier pair we selected the number of features, where the accuracy of the classifier reached a maximum. If two values coincided at maximum, the combination with fewer features was chosen. Table 2 displays the best results achieved in terms of accuracy and corresponding features for each field combination/classifier pair. Maximal performance values for each field combination are highlighted in boldface. In Table 3 the three topmost values for each dataset are listed allowing a better comparison of best-performing classifiers, ˆ the standard the field combination, the mean accuracy A, deviation of the accuracy σ(A) and the number of features.
B. Experimental Data Constructing training instances for the machine learning algorithms is done on the task level. This means that each task represents a training instance for a specific class to be learned. A class corresponds to a specific task model. Having multiple task models hence results in a multi-class classification problem. A training instance for a class is built from features and feature combinations for a task. An example for the window title feature is the construction of a ’bag of words’ consisting of all window titles of applications the user has interacted with during the execution of a task. Table 1: Overview of the number of attributes, instances and classes for all tasks for selected field combinations (columns) for Dataset T of the task centric scenario. f # ATTRIB # INST # CLASSES
A 25 218 5
C 1823 218 5
W 621 218 5
Table 3: Overview of the best results for the task centric scenario. Showing the field combination (f ), the classifier (l), ˆ the standard deviation (σ(A)) and the numthe accuracy (A), ber of features (g).
ACW 2923 218 5
R ANK 1 2 3 4 5 6 7
C. Experimental Design In our experiment we evaluated the influence of three parameters on the task classification performance: (i) the number of features, (ii) the classification model and (iii) the feature category. The WEKA toolkit [15] and the WEKA integration [6] of the libSVM [2] provided us with the tool set to study the performance of the Na¨ıve Bayes (NB), Linear Support Vector Machine (SVM) with cost parameter c ∈ {2−5 , 2−3 , 2−1 , 20 , 21 , 23 , 25 , 28 , 210 }, and k-Nearest Neighbor (KNN-k) with k ∈ {1, 5, 10} algorithm. The interval for the cost parameter was chosen according to the libSVM practical guide at [2]. For each classifier algorithm l ∈ L and each feature category f ∈ F we selected the g attributes having the highest IG value to obtain our dataset. As values for g 50 different measure points were used. Half of them were equally distributed over the available number of attributes with an upper bound of 5000 attributes. The other half was defined by G = {3, 5, 10, 25, 50, 75, 100, 125, 150, 175, 200, 250, 300, 500, 750, 1000, 1500, 2000, 2500, 3000, 3500, 4000, 5000, 7500, 10000}. These measuring points were chosen because of two reasons:
f ACW CW AW W AC C A
l NB NB KNN-5 NB KNN-10 KNN-1 SVM
Aˆ 83.51 82.58 79.33 78.87 64.72 63.38 42.16
σ(A) 8.69 6.69 5.52 7.25 7.85 9.17 11.21
g 300 750 76 100 126 125 25
IV. User Centric Scenario A. Data Set Structure In the user centric scenario we recorded the work behaviour of a single user in a governmental domain over a period of two months. The user was requested to label the clustered event blocks with her current work task. If no label or an incorrect label was automatically suggested the correct label was assigned by the user. In this scenario task labelling is a subjective matter; in contrast to our task centric scenario and other approaches [11, 4, 3].
4
Such unrestricted labelling yields to syntactically different tasks with the same semantic meaning. One such example is author an article vs. write an article. To harmonise this syntactical heterogeneity, we manually identified misspellings in
Table 2: Classifier Performance for all field combinations for Dataset T (task centric). The table shows the maximum accuracy (averaged over all cross-validation runs) and the corresponding number of selected features. A C W AC AW CW ACW
KNN-1 37.12% (5) 63.38(125) 73.92% (75) 64.16% (200) 77.10% (75) 76.13% (250) 74.81% (200)
KNN-5 35.02% (24) 62.88% (75) 73.98% (100) 64.70% (150) 79.33% (75) 75.76% (200) 74.78% (250)
KNN-10 36.23% (24) 63.23% (125) 77.53% (75) 64.72% (125) 78.44% (75) 75.28% (175) 75.17% (200)
a post processing step and aggregated user defined labels to the task categories outlined below. Hence, four different task sets have been created from the acquired data. Set UI is activity driven, i.e., giving priority to the own tasks at hand and reduces the user labelled tasks to the 5 most important task. Set UII is process driven, i.e., a well defined step in a process and incorporates a semantic division of the event blocks. Set UI consists of the following 5 tasks:
NB 39.94% (24) 62.79% (75) 78.87% (100) 62.88% (2496) 77.81% (200) 82.58% (750) 83.51% (300)
SVM-lin 42.16% (24) 60.15% (75) 74.37% (75) 62.97% (250) 75.28% (75) 76.19% (50) 76.60% (50)
Table 4: Dataset UI & UII: Overview of the number of attributes, instances and classes for all event blocks for selected field combinations (columns) for Dataset UI and UII (rows). S ET UI
1. email - writing, reading, archiving email messages
UII
2. paper - writing papers and articles
f # ATTRIB # INST # CLASSES # ATTRIB # INST # CLASSES
A 14 349 5 14 406 4
C 3601 170 5 3718 196 4
S 4 77 5 4 77 4
W 253 307 5 356 266 4
ACSW 3706 349 5 3827 406 4
3. research - research to a given field model and (iii) the field combination.
4. documentation - writing project documentation and protocols 5. information - collect information Set UII consists of the following 4 sem antic tasks: 1. com - communication related event blocks, such as reading and writing emails 2. org - organisational and administrative things, such as writing timetables, make appointments 3. write - writing documents, articles, papers 4. read - reading internet pages, documents etc. B. Data Set Analysis We conducted experiments using different combinations of event block fields (see Section II-C). Depending on the combinations, the necessary field contents are concatenated to one string and preprocessing steps are applied. Further, the user labels are mapped to task labels according to Section IIE yielding Dataset UI and UII. There are cases in which event blocks are removed from the data set. Firstly, if no mapping from the user label to a task is found. Secondly, if the instance contains no data at all. Hence, field combinations differ in the number of instances. Table 4 gives an overview of the number of instances, the number of attributes (the number of different terms in the term vector) and the number of classes for selected field combinations for the used datasets. C. Experimental Design In our experiments we evaluated the influence of three parameters: (i) the number of features, (ii) the classification
5
We compared three classification models - Na¨ıve Bayes (NB), Support Vector Machines (SVM) and k-Nearest Neighbour (KNN). A Na¨ıve Bayes classifier was chosen because of its simplicity and effectiveness. Furthermore, Na¨ıve Bayes relies on the global data distribution, being robust and therefore less prone to noise. SVMs, besides performing well with textual data [8], put more weight to training data close to the decision boundary. Here, a linear kernel was applied - according to [5] the corresponding feature space possesses enough discrimination power. As representative for a nonlinear, more local classifier, we opted for the KNN, and set the number of neighbours k ∈ {1, 5, 10} to achieve different complexities of the decision boundary. The WEKA machine learning library [15] provided the necessary tools. The WEKA integration [6] of the libSVM [2] allowed the usage of a SVM as well. Cross-validation has been used to obtain statistical sound experimental results for evaluating possible combinations of fields, number of features and classification models. L represents the set of all classifiers, L = {KNN-1, KNN-5, KNN10, NB, SVM-lin}. Fifteen different field combinations P were taken into account resulting from forming the power set P ∈ Π(F ) \ ∅, where F = {A, C, S, W}. For each classifier l ∈ L on each field combination f ∈ P we selected the g attributes having the highest IG value to obtain our dataset. The value g was set to g = 1, 2, 3, . . . , 100% of all available attributes (the total number of attributes depends on the field combination). Stratified 10-fold cross-validation was applied and statistical values for each fold were computed. We evaluated the accuracy of the used techniques and for comparison with related work precision/recall measures. In addition, mean and standard deviation of all values were calculated across all folds.
D. Results of the User Centric Scenario
B. Effect of Field Combination
Tables 5 and 6 show the results for the Dataset UI and UII. For each field combination/classifier pair we selected the number of features, where the accuracy of the classifier reached a maximum. If two values coincided at maximum, the combination with fewer features was chosen. Tables 5 and 6 display the best results achieved in terms of accuracy and corresponding features for each field combination/classifier pair. Maximal performance values for each field combination are highlighted in boldface. In Table 7 the three topmost values for each user centric dataset are listed allowing a better comparison of bestperforming classifiers, the field combination, the mean ˆ the standard deviation of the accuracy σ(A) and accuracy A, the number of features.
Each field is capable of adding information that might be valuable for separating the classes. Although the datasets differ from each other in terms of task classes and semantics, the single fields Content and Window Title performed best in most runs. Consequently, the same fields occur in field combinations that reached highest accuracies. In contrast, fields that performed poorly as individuals, e.g., the Application Name, seldom boost the classification in combination with others. Considering the overall performance, we conclude that accurate classification results can be achieved by taking only the Window Title into account confirming the outcomes of SWISH. We refer to the results of the task and user centric scenario to the Tables 2, 3, 5 and 6 respectively. Our results reveal that nearly all classification models reached top accuracies when using the window title tield W.
Table 7: Overview of the best results for the two user centric datasets Dataset UI and Dataset UII. This table displays the ˆ the field combination (f ), the classifier (l), the accuracy (A), standard deviation (σ(A)) and the number of features (g) for the three topmost accuracy values. S ET UI
UII
R ANK 1 2 3 1 2 3
f SC C W W AW WS
l KNN-1 KNN-5 KNN-10 KNN-1 KNN-10 SVM- LIN
Aˆ 74.51 74.12 73.60 76.42 74.90 74.74
σ(A) 9.51 7.94 8.23 7.90 8.08 4.45
C. Effect of Classifier In case of the user centric scenario, KNN-5, KNN-1 and linear SVM’s had an advandtage over the Na¨ıve Bayes classifier (see Table 7) with rather low differences. In the task centric scenario, again KNN-5 achieves rather good results. In contrast to the user centric scenario however, linear SVM stay behind to a large degree and Na¨ıve Bayes achieve the best results (see Table 3). Noteably, the differences between Na¨ıve Bayes and SVM runs in the user centric scenario are smaller compared to the differences in the task centric run. This is especially true for runs where the SVM outperforms Na¨ıve Bayes. In constrat to that, differences between Na¨ıve Bayes and SVM are larger in the task centric scenario, especially in the best performing runs. Overall, our results point the conclusion that Na¨ıve Bayes and k-NN classifiers are more robust than SVM’s regarding work task classification.
g 108 144 156 188 230 74
V. Discussion The results of our experiments need to be interpreted in order to be applicable in similar settings. Our analysis concentrates on determining the impact of feature selection, the field combination and the classification model.
D. Comparison with other Approaches Firstly, we address the main differences to the TaskPredictor project (see [14] for further detail). (i) The task labelling is restricted by offering only choices coming from a drop down box. In our user centric scneario the user was free in labelling her tasks in her own, personal way. (ii) Only window title, file path and URL are taken into account for the prediction task. (iii) There are no experiments mentioned considering different numbers of features, always used a fixed number of features was used, i.e., 200 features. (iv) The prediction results achieved a precision of 0.8 (see Table 8). It is not determinable, whether micro or macro precision was calculated. Furthermore, they introduced the term coverage specifying the degree of discarding certain test examples from being classified.
A. Effect of Feature Selection Ranking the features by discrimination capability and handing them over allows to build classification models that achieve high accuracies. In the evaluation of the task centric secnario the best runs of the classifiers resulted from only up to 10% (25 to 300 attributes) of the maximum number of attributes. The only exception was the CW feature combination which used 750 attributes (30% of all attributes). The best performance in terms of accuracy has been achieved with 300 attributes (see Table 3). The results in Table 7 similarily reflect the effectiveness of feature selection. Regarding the evaluation of the user centric scenario only 2-6% of the total number of features sufficed for achieving the highest accuracy values. Our findings confirm the one of [14] and [10], that successful work task classification requires rather few features. 6
Secondly, we compare our approach to the SWISH system (see [11]). The features in SWISH are restricted to the terms obtained from window titles. When focusing on the optimisation of the recall measure, they achieved a precision of 0.49 and a recall of 0.72. In Table 8 the key data of both evaluations is compared. The number of features used was
Table 5: Classifier Performance for all field combinations for Dataset UI. The table shows the maximum accuracy (averaged over all cross-validation runs) and the corresponding number of selected features. A C S W AC AS AW SC WC WS AWC AWS ASC WSC AWSC
KNN-1 55.06% (7) 72.35% (144) 44.29% (3) 73.30% (168) 65.29% (864) 55.32% (13) 70.81% (250) 74.51% (108) 69.25% (2232) 72.02% (154) 67.61% (1813) 69.95% (124) 64.20% (1368) 70.59% (2232) 69.03% (3404)
KNN-5 55.03% (5) 74.12% (144) 44.29% (3) 73.26% (158) 65.59% (720) 55.35% (10) 71.06% (164) 73.33% (108) 69.22% (2700) 72.66% (160) 67.34% (629) 69.66% (122) 64.15% (720) 70.88% (3672) 69.35% (3256)
KNN-10 55.03% (5) 73.53% (180) 44.64% (3) 73.60% (156) 64.49% (1224) 55.34% (6) 71.08% (172) 73.92% (72) 68.94% (2988) 71.97% (244) 67.34% (1739) 69.90% (144) 64.18% (1188) 71.18% (3312) 68.80% (3404)
NB 55.03% (5) 65.29% (144) 44.46% (1) 69.68% (252) 65.62% (252) 55.04% (4) 67.36% (62) 66.44% (144) 68.62% (108) 70.39% (244) 66.18% (777) 63.91% (266) 63.30% (684) 69.57% (288) 66.21% (185)
SVM-lin 55.02% (5) 69.41% (72) 42.86% (1) 71.95% (40) 65.04% (216) 55.03% (5) 71.07% (60) 67.75% (108) 71.23% (360) 72.39% (40) 68.79% (259) 71.66% (68) 65.92% (252) 71.53% (360) 69.31% (296)
Table 6: Classifier Performance for all field combinations for Dataset UII. The table shows the maximum accuracy (averaged over all cross-validation runs) and the corresponding number of selected features. A C S W AC AS AW SC WC WS AWC AWS ASC WSC AWSC
KNN-1 57.17% (3) 72.95% (222) 74.46% (1) 76.42% (188) 65.77% (703) 57.20% (7) 74.65% (224) 72.29% (3404) 71.02% (2394) 74.44% (86) 72.87% (266) 74.12% (194) 65.28% (629) 72.43% (2622) 72.41% (3686)
KNN-5 57.18% (3) 73.05% (2516) 73.93% (1) 75.89% (192) 65.74% (2516) 57.19% (14) 74.40% (226) 71.24% (3404) 71.32% (1672) 74.48% (96) 71.70% (304) 73.70% (184) 65.57% (1739) 72.98% (3154) 71.95% (3420)
KNN-10 57.16% (4) 74.03% (2553) 74.29% (1) 76.17% (214) 65.79% (518) 57.17% (8) 74.90% (230) 71.71% (3478) 71.61% (2394) 74.18% (188) 72.42% (266) 73.87% (174) 64.79% (1702) 72.44% (1330) 71.98% (2622)
not determinable. The clusters generated in SWISH such as buying a book of Harry Potter do not seem to generalise well. The keywords of this cluster are too specific to allow an abstraction for other books. In our setting we emphasise general task classes as for instance research and write.
f ACW W W W WPU3 WPU3
l NB KNN KNN PLSI NB/SVM NB/SVM
t 5 5 4 5 96 81
g 300 156 188 ( ALL ) 200 200
π 0.95 0.91 0.90 0.49 0.84 0.85
SVM-lin 57.16% (5) 65.82% (74) 74.46% (1) 74.44% (130) 64.32% (148) 57.17% (10) 73.62% (108) 66.43% (37) 69.33% (38) 74.74% (74) 68.69% (76) 73.88% (102) 65.02% (111) 68.82% (114) 68.73% (190)
On the whole, we achieved significantly better precision/recall values (see Table 8). Partly responsible for the performance decrease could be the differing granularity of the task classes, being more general in our case. In contrast to the other approaches, different field combinations and their influences on the task categorisation were analysed. Based on our findings, we confirm the field choice W of TaskPredictor and SWISH.
VI. Conclusions and Future Work
Table 8: Comparing SWISH (S), participants FA and FB of the TaskPredictor system, and the results for DataSet UI and UII of our approach. Showing the field combinations (f ), the classification model (l), the number of tasks (t), the number of features (g) as well as the precision π and recall ρ values. DATA T UI UII SWI FA FB
NB 57.18% (6) 67.89% (333) 74.46% (3) 70.27% (64) 65.27% (37) 57.16% (3) 69.24% (250) 70.29% (37) 63.23% (76) 68.56% (158) 66.75% (76) 61.58% (106) 60.38% (148) 62.69% (76) 63.57% (114)
Our contribution comprises three major statements that are based on a thorough analysis of the conducted experiments. •
ρ 0.85 0.75 0.74 0.72 N.A. N.A.
Task classification can be accurately performed by applying machine learning techniques to the captured user interaction context. This we showed in two independent scenarios (task and user centric) for different tasks and users in which we reached a high accuracy in detecting
3 W-
window title, P - folder path, U - URI a coverage of 0.1 5 at a coverage of 0.2 4 at
7
References
the user’s tasks with our approach. •
Our findings confirm the feature type choice of three other research groups, which is the good discriminative power of the window title feature.
•
We highlighted that standard machine learning techniques suffice to extract the context in order to support the knowledge worker.
[1] J. Callan, J. Allan, C. L. A. Clarke, S. Dumais, D. A. Evans, M. Sanderson, and C. Zhai. Meeting of the minds: An information retrieval research agenda. ACM SIGIR Forum, 41(2):25–34, 2007. [2] C.-C. Chang and C.-J. Lin. LIBSVM: a library for support vector machines, 2001. Software available at http://www. csie.ntu.edu.tw/˜cjlin/libsvm. [3] A. N. Dragunov, T. G. Dietterich, K. Johnsrude, M. McLaughlin, L. Li, and J. L. Herlocker. Tasktracer: A desktop environment to support multi-tasking knowledge workers. In Proceedings of the International Conference on Intelligent User Interfaces, pages 75–82, New York, NY, USA, 2005. ACM Press. [4] M. Dredze, T. A. Lau, and N. Kushmerick. Automatically classifying emails into activities. In Proceedings of the International Conference on Intelligent User Interfaces, pages 70–77, 2006. [5] S. Dumais, J. Platt, D. Heckerman, and M. Sahami. Inductive learning algorithms and representations for text categorization. In Proceedings International Conference on Information and Knowledge Management, pages 148–155, New York, NY, USA, 1998. ACM Press. [6] Y. EL-Manzalawy and V. Honavar. WLSVM: Integrating libSVM into Weka environment, 2005. Software available at http://www.cs.iastate.edu/˜yasser/wlsvm. [7] M. Granitzer, M. Kr¨oll, C. Seifert, A. S. Rath, N. Weber, O. Dietzel, and S. Lindstaedt. Analysis of machine learning techniques for context extraction. In Proceedings of 2008 IEEE International Conference on Digital Information Management (ICDIM08), 2008. [8] T. Joachims. Text categorization with support vector machines: learning with many relevant features. In Proceedings of the European Conference on Machine Learning, number 1398, pages 137–142, Chemnitz, DE, 1998. Springer Verlag, Heidelberg, DE. [9] M. Kellar, C. Watters, and M. Shepherd. A field study characterizing web-based information-seeking tasks. J. Am. Soc. Inf. Sci. Technol., 58(7):999–1018, 2007. [10] R. Lokaiczyk, A. Faatz, A. Beckhaus, and M. Goertz. Enhancing just-in-time e-learning through machine learning on desktop context sensors. In CONTEXT ’07, pages 330–341, Roskilde, Denmark, 2007. [11] N. Oliver, G. Smith, C. Thakkar, and A. C. Surendran. SWISH: semantic analysis of window titles and switching history. In Proceedings of the International Conference on Intelligent User Interfaces, 2006. [12] A. S. Rath, M. Kr¨oll, S. Lindstaedt, and M. Granitzer. Lowlevel event relationship discovery for knowledge work support. In Workshop on Productive Knowledge Work - Management and Technological Challenges, WM’07, 2007. [13] A. S. Rath, N. Weber, M. Kr¨oll, M. Granitzer, O. Dietzel, and S. N. Lindstaedt. Context-aware knowledge services. In Workshop on Personal Information Management, CHI ’08, Florence, Italy, 2008. [14] J. Shen, L. Li, T. G. Dietterich, and J. L. Herlocker. A hybrid learning system for recognizing user tasks from desktop activities and email messages. In IUI ’06, pages 86–92, Sydney, Australia, 2006. [15] I. H. Witten and E. Frank. Data Mining: Practical machine learning tools and techniques. Morgan Kaufmann, San Francisco, 2nd edition, 2005.
In the presented work we studied two domain independent datasets for training and evaluation: (i) from a large scale laboratory experiment with 14 participants in which we put the focus on tasks and (ii) from a single user of a real world setting who had complete freedom in labeling the tasks. Since two datasets are not sufficient for reliably generalizing our findings the acquisition of more data in other settings with multiple tasks and users is currently in progress. We are going to evaluate our methodology on this enlarged data set. Our design allows for extending the capability of the currently available sensors as well as easiliy adding further sensors, if it is required. Still, it would be interesting to add sensors that are capable of capturing telephone conversations or meeting discussions. Monitoring the physical state of knowledge workers to enrich the context by an additional dimension is not far fetched any more. Finally, a reassessment of the feature creation process is to be considered. Instead of mixing features of all fields, a separating them in combination with different weighting schemes could be conceivable. A second approach would be to take structure into account and applying SVMs, where this additional information can be embedded into the kernel. Future work also has to consider general, user independent task models and boostrapping methods. Both aspects are central for high user satisfaction. Therefore, we are working on a ontology-based user interaction context model for representing, automatically capturing and reasoning about the user’s context. Exploiting the ontology peculiarities and structure for feature engineering in order to enhance task detection performance seems to be a fruitful extension in this direction. Furthermore, exchanging classification models between knowledge workers, especially between those with similar work styles and tasks may help to overcome the data sparsity problem. Both extensions raise a number of interesting questions and opportunities for further research in the areas of knowledge work, personal information mangement as well as in applied machine learning.
Acknowledgement The Know-Center is funded within the Austrian COMET Program - Competence Centres for Excellent Technologies under the auspices of the Austrian Federal Ministry of Transport, Innovation and Technology, the Austrian Federal Ministry of Economy, Family and Youth and by the State of Styria. COMET is managed by the Austrian Research Promotion Agency FFG. The project results have been developed in the DYONIPOS project (www.dyonipos.at) financed by the FFG under the project contract number 810804/9338.
8