Xiaoling Zhang. Moonjung Cho. State University of New York at Buffalo. {jianpei, xzhang7, mcho}@cse.buffalo.edu. Haixun Wang. Philip S. Yu. IBM T.J. Watson ...
MaPle: A Fast Algorithm for Maximal Pattern-based Clustering∗ Jian Pei
Xiaoling Zhang
Moonjung Cho
Haixun Wang
State University of New York at Buffalo {jianpei, xzhang7, mcho}@cse.buffalo.edu
Abstract Pattern-based clustering is important in many applications, such as DNA micro-array data analysis, automatic recommendation systems and target marketing systems. However, pattern-based clustering in large databases is challenging. On the one hand, there can be a huge number of clusters and many of them can be redundant and thus make the pattern-based clustering ineffective. On the other hand, the previous proposed methods may not be efficient or scalable in mining large databases. In this paper, we study the problem of maximal patternbased clustering. Redundant clusters are avoided completely by mining only the maximal pattern-based clusters. MaPle, an efficient and scalable mining algorithm is developed. It conducts a depth-first, divide-and-conquer search and prunes unnecessary branches smartly. Our extensive performance study on both synthetic data sets and real data sets shows that maximal pattern-based clustering is effective. It reduces the number of clusters substantially. Moreover, MaPle is more efficient and scalable than the previously proposed pattern-based clustering methods in mining large databases.
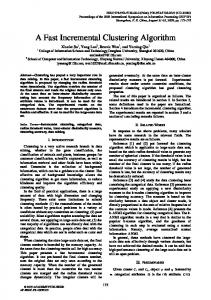
1 Introduction Clustering large databases is a challenging data mining task with many important applications. Most of the previously proposed methods are based on similarity measures defined globally on a (sub)set of attributes/dimensions. However, in some applications, it is hard or even infeasible to define a good similarity measure on a global subset of attributes to serve the clustering. To appreciate the problem, let us consider clustering the 5 objects in Figure 1(a). There are 5 dimensions. No patterns among the 5 objects are visibly explicit. However, as elaborated in Figure 1(b) and (c), respectively, objects 1, 2 and 3 follow the same pattern in dimensions a, c and d, while objects 1, 4 and 5 share another similar pattern in di∗ This research is partially supported by NSF Grant IIS-0308001. Any opinions, findings, and conclusions or recommendations expressed in this publication are those of the authors and do not necessarily reflect the views of NSF.
Philip S. Yu
IBM T.J. Watson Research Center {haixun, psyu}@us.ibm.com
mensions b, c, d and e. If we use the patterns as features, they form two pattern-based clusters. 80
Object 1
80
80
70
Object 2
70
70
60
Object 3
60
60
50
Object 4
50
50
40
Object 5
40
40
30
30
30
20
20
20
10
10
10
0
Dimensions a
b
c
d
e
(a) The data set
0
0 a
c
d
(b) Pattern−based cluster 1
b
c
d
e
(c) Pattern−based cluster 2
Figure 1. A motivating example. Some recent researches (e.g., [12]) indicate that patternbased clustering is useful in many applications. In general, given a set of data objects, a subset of objects form a pattern-based clusters if these objects follow a similar pattern in a subset of dimensions. Comparing to the conventional clustering, pattern-based clustering is a more general model and has two distinct features. On the one hand, it does not require a globally defined similarity measure. Different clusters can follow different patterns on different subsets of dimensions. On the other hand, the clusters are not necessary exclusive. That is, an object can appear in more than one cluster. The generality and flexibility of pattern-based clustering may provide interesting and important insights in some applications where conventional clustering methods may meet difficulties. For example, in DNA micro-array data analysis, the gene expression data are organized as matrices, where rows represent genes and columns represent samples/conditions. The number in each cell records the expression level of the particular gene under the particular condition. The matrices are often large, containing thousands of genes and hundreds of conditions. It is important to identify subsets of genes whose expression levels change coherently under a subset of conditions. Such information is critical in revealing the significant connections in gene regulatory networks. As another example, in the applications of automatic recommendation and target marketing, it is essential to identify sets of customers/clients with similar behavior/interest. As a concrete example, suppose that the ranks of movies given by customers are collected. To identify customer groups, it is essential to find the subsets
of customers who rank subsets of movies similarly. In the above two examples, pattern-based clustering is the major data mining task. Although the pattern-based clustering problem is proposed and a mining algorithm is developed by Wang et al. [12], some important problems remain not thoroughly explored. In particular, we address the following two fundamental issues and make corresponding contributions in this paper. First, what is the effective representation of patternbased clusters? As can be imagined, there can exist many pattern-based clusters in a large database. Given a patternbased cluster C, any non-empty subset of the objects in the cluster is trivially a pattern-based cluster on any non-empty subset of dimensions. Mining and analyzing a huge number of pattern-based clusters may become the bottleneck of effective analysis. Can we devise a non-redundant representation of the pattern-based clusters? Our contributions. In this paper, we propose the mining of maximal pattern-based clusters. The idea is to report only those non-redundant pattern-based clusters, and skip their trivial sub-clusters. We show that, by mining maximal pattern-based clusters, the number of clusters can be reduced substantially. Moreover, many unnecessary searches for sub-clusters can be pruned and thus the mining efficiency can be improved dramatically as well. Second, how to mine the maximal pattern-based clusters efficiently? Our experimental results indicate that the algorithm p-Clustering developed in [12] may not be satisfactorily efficient or scalable in large databases. The major bottleneck is that it has to search many possible combinations of objects and dimensions. Our contributions. In this paper, we develop a novel mining algorithm, MaPle (for Maximal Pattern-based Clustering). It conducts a depth-first, progressively refining search to mine maximal pattern-based clusters. We propose techniques to guarantee the completeness of the search and also prune unpromising search branches. An extensive performance study on both synthetic data sets and real data sets is reported. The results show that MaPle is significantly more efficient and more scalable in mining large databases than method p-Clustering in [12]. The remainder of the paper is organized as follows. Section 2 defines the problem of mining maximal pattern-based clusters and reviews related work. In Section 3, we develop algorithm MaPle. An extensive performance study is reported in Section 4. Section 5 concludes the paper.
2 Problem Definition and Related Work Given a set of objects, where each object is described by a set of attributes. A pattern-based cluster (R, D) is a subset of objects R that exhibit a coherent pattern on a subset of attributes D. To formulate the problem, it is essential to describe, given a subset of objects R and a subset of attributes D, how coherent the objects are on the attributes. The measure pScore serves this purpose.
Definition 2.1 (pScore) Let DB = {r1 , . . . , rn } be a database with n objects. Each object has m attributes A = {a1 , . . . , am }. We assume that each attribute is in the domain of real numbers. The value of object rj on attribute ai is denoted as rj .ai . For any objects rx , ry ∈ DB and any attributes au , av ∈ ¸¶ A, the pScore is defined µ· rx .au rx .av as pScore = k(rx .au − ry .au ) − ry .au ry .av (rx .av − ry .av )k. Clearly, the pScore describes the similarity between two objects on two attributes. The smaller the pScore value, the more similar are the two objects on the two dimensions. Pattern-based clusters can be defined as follows. Definition 2.2 (Pattern-based cluster) Let R ⊆ DB be a subset of objects in the database and D ⊆ A be a subset of attributes. (R, D) is said a δ-pCluster (for pattern-based cluster) if for any objects µ· rx , ry ∈ R and ¸¶ any attributes rx .au rx .av au , av ∈ D, pScore ≤ δ, where ry .au ry .av δ ≥ 0. In a large database with many attributes, there can be many coincident, statistically insignificant pattern-based clusters. A cluster may be considered statistically insignificant if it contains a small number of objects, or a small number of attributes. Thus, a user may want to impose constraints on the minimum numbers of objects and attributes in a pattern-based cluster. In general, given (1) a cluster threshold δ, (2) an attribute threshold mina (i.e., the minimum number of attributes), and (3) an object threshold mino (i.e., the minimum number of objects), the task of mining δ-pClusters is to find the complete set of δ-pClusters (R, D) such that (kRk ≥ mino ) and (kDk ≥ mina ). A δ-pCluster satisfying the above requirement is called significant. Although the attribute and object thresholds are used to filter out insignificant pClusters, there still can be some “redundant” significant pClusters. For example, consider the objects in Figure 1. Let δ = 5, mina = 3 and mino = 3. Then, we have 6 significant pClusters: C1 = ({1, 2, 3}, {a, c, d}), C2 = ({1, 4, 5}, {b, c, d}), C3 = ({1, 4, 5}, {b, c, e}), C4 = ({1, 4, 5}, {b, d, e}), C5 = ({1, 4, 5}, {c, d, e}), and C6 = ({1, 4, 5}, {b, c, d, e}). Among them, C2 , C3 , C4 and C5 are subsumed by C6 , i.e., the objects and attributes in the four clusters, C2 -C5 , are subsets of the ones in C6 . In general, a pCluster C1 = (R1 , D1 ) is called a subcluster of C2 = (R2 , D2 ) provided (R1 ⊆ R2 ) ∧ (D1 ⊆ D2 ). Moreover, C1 is called a proper sub-cluster of C2 if either R1 ⊂ R2 or D1 ⊂ D2 . Pattern-based clusters have the following property. Lemma 2.1 (Closure of sub-clusters) Let C = (R, D) be a δ-pCluster. Then, every sub-cluster (R0 , D0 ) is a δpCluster.
Problem Statement (mining maximal δ-pClusters). Given (1) a cluster threshold δ, (2) an attribute threshold mina , and (3) an object threshold mino , the task of mining maximal δ-pClusters is to find the complete set of maximal δ-pClusters with respect to mina and mino . 2.1 Related Work The problem of pattern-based clustering and an algorithm, p-Clustering1 , are proposed in [12]. According to the extensive performance study reported in the paper, pClustering outperforms all previous methods. The study of pattern-based clustering is related to previous work on subspace clustering and frequent itemset mining. The meaning of clustering in high dimensional data sets is often unreliable [6]. Some recent studies (e.g. [3, 1, 2, 7]) focus on mining clusters embedded in some subspaces. For example, CLIQUE [3] is a density and grid based method. It divides the data into hyper-rectangular cells and uses the dense cells to construct subspace clusters. Subspace clustering can be used to semantically compress data. An interesting study in [10] employs a randomized algorithm to find fascicles, the subsets of data that share similar values in some attributes. While their method is effective for compression, it does not guarantee the completeness of mining the clusters. In some applications, global similarity-based clustering may not be effective. Still, strong correlations may exist among a set of objects even if they are far away from each other as measured by distance functions (such as Euclidean) used frequently in traditional clustering algorithms. Many scientific projects collect data in the form of Figure 1(a), and it is essential to identify clusters of objects that manifest coherent patterns. A variety of applications, including DNA microarray analysis, collaborative filtering, will benefit from fast algorithms that can capture such patterns. Cheng and Church propose the biclustering model [8], which captures the coherence of genes and conditions in a sub-matrix of a DNA micro-array. Yang et al. [13] develop a move-based algorithm to find biclusters more efficiently. On the other hand, a transaction database can be modelled as a binary matrix, where columns and rows stand for items and transactions, respectively. A cell ri,j is set to 1 if item j is contained in transaction i. Then, the problem of 1 Wang et al. did not give a specific name to their algorithm in [12]. We call it p-Clustering since the main function in the algorithm is pCluster() and we want to distinguish the algorithm from the pclusters.
3 Algorithm MaPle 3.1 Overview Essentially, MaPle enumerates all the maximal pClusters systematically. It guarantees both the completeness and the non-redundancy of the search, i.e., every maximal pCluster will be found, and each combination of attributes and objects will be tested at most once. MaPle enumerates every combination of attributes systematically in a dictionary order according to an order of attributes. For each subset of attributes D, MaPle finds the maximal subsets of objects R such that (R, D) is a δpCluster. If (R, D) is not a sub-cluster of another pCluster (R0 , D) such that R ⊂ R0 , then (R, D) is a maximal δpCluster. This “attribute-first-object-later” search is illustrated in Figure 2. attributes 1. search a subset of attributes
2. find the largest subset(s) of objects
Definition 2.3 (maximal pCluster) A δ-pCluster C is said maximal (or called a δ-MPC in short) if there exists no δpCluster C 0 such that C is a proper sub-cluster of C 0 .
mining frequent itemsets [4] is to find subsets of rows and columns such that the sub-matrix is all 1’s, and the number of rows is more than a given support threshold. If a minimum length constraint mina is imposed to find only frequent itemsets of no less than mina items, then it becomes a problem of mining 0-pClusters on binary data. Although there are many efficient methods for frequent itemset mining, such as [5, 9], they cannot be extended to handle the general pattern-based clustering problem since they can only handle the binary data.
objects
Mining the redundant sub-clusters is tedious and ineffective for analysis. Therefore, it is natural to mine only the “maximal clusters”, i.e., the pClusters that are not subcluster of any other pClusters.
a possible maximal pCluster
Figure 2. Attribute-first-object-later search. There can be a huge number of combinations of attributes. MaPle prunes many combinations unpromising for δ-pClusters. Following Lemma 2.1, for subset of attributes D, if there exists no subset of objects R such that (R, D) is a significant pCluster, then we do not need to search any superset of D. On the other hand, when searching under a subset of attributes D, MaPle only checks those subsets of objects R such that (R, D0 ) is a pCluster for every D0 ⊂ D. Clearly, only subsets R0 ⊆ R may achieve δ-pCluster (R0 , D). Such pruning techniques are applied recursively. Thus, MaPle progressively refines the search step by step. Moreover, MaPle also prunes searches that are unpromising to find maximal pClusters. It detects the attributes and objects that can be used to assemble a larger pCluster from the current pCluster. If MaPle finds that the current subsets of attributes and objects as well as all possible attributes and objects together turn out to be a sub-
cluster of a pCluster having been found before, then the recursive searches rooted at the current node are pruned, since it cannot lead to a maximal pCluster. Why does MaPle enumerate attributes first and then objects later, but not in the reverse way? In real databases, the number of objects is often much larger than the number of attributes. In other words, the number of combinations of objects is often dramatically larger than the number of combinations of attributes. In the pruning using maximal pClusters discussed above, if the attribute-first-object-later approach is adopted, once a set of attributes and its descendants are pruned, all searches of related subsets of objects are pruned as well. Heuristically, the attribute-first-objectlater search may bring a better chance to prune a more bushy search sub-tree.2 Essentially, we rely on MDSs, the maximal δ-MPC containing only two objects or two attributes, to determine whether a subset of objects and a subset of attributes together form a pCluster. Therefore, as a preprocessing, we materialize all non-redundant MDSs. Based on the above discussion, we have the framework of MaPle as shown in Figure 3.
Input: database DB, cluster threshold δ, attribute threshold mina and object threshold mino ; Output: the complete set of maximal δ-pClusters; Method: (1) compute and prune attribute-pair MDSs and object-pair MDSs; // Section 3.2 (2) progressively refining, depth-first search for maximal δ-pClusters; // Section 3.3
Figure 3. Algorithm MaPle. Comparing to p-Clustering, MaPle has several advantages. First, in the third step of p-Clustering, for each node in the prefix tree, the combinations of the objects registered in the node will be explored to find pClusters. This can be expensive if there are many objects in a node. In MaPle, the information of pClusters is inherited from the “parent node” in the depth-first search and the possible combinations of objects can be reduced substantially. Moreover, once a subset of attributes D is determined hopeless for pClusters, the searches of any superset of D will be pruned. Second, MaPle prunes non-maximal pClusters. Many unpromising searches can be pruned in their early stages. Third, new pruning techniques are adopted in the computing and pruning MDSs. That also speeds up the mining. In the remainder of this section, we will explain the two steps of MaPle in detail. 2 However, there is no theoretical guarantee that the attribute-firstobject-later search is optimal. There exist counter examples that objectfirst-attribute-later search wins. Limited by space, we omit the details here.
3.2 Computing and Pruning MDSs A pCluster must have at least two objects and two attributes. Intuitively, we can use those pClusters containing only two objects or two attributes to construct larger pClusters having more objects and attributes. Given a database DB and a cluster threshold δ. A δ-pCluster C1 = ({o1 , o2 }, D) is called an object-pair MDS (for maximal dimension set) if there exists no δ-pCluster C10 = ({o1 , o2 }, D0 ) such that D ⊂ D0 . On the other hand, a δ-pCluster C2 = (R, {a1 , a2 }) is called an attribute-pair MDS if there exists no δ-pCluster C20 = (R0 , {a1 , a2 }) such that R ⊂ R0 . MaPle computes all attribute-pair MDSs as p-Clustering does. The method is illustrated in Figure 4(b). Limited by space, we omit the detailed algorithm here and only show the following example. Example 1 (Finding attribute-pair MDSs) Figure 4(a) shows the object values of two attributes, x and y. The last row shows the differences of the object values. Attribute
Objects a b c d e f g x 13 11 9 7 9 13 2 y 7 4 10 1 12 3 4 x−y 6 7 −1 6 −3 10 −2 (a) The object values of two attributes x and y. −3 −2 −1 6 e
g
6
7
8
c a d b h (b) Finding MDS
h 15 7 8
10 f
Figure 4. Finding MDS for two attributes. To compute the attribute-pair MDS, p-Clustering sorts the objects in the difference ascending order, as shown in Figure 4(b). Suppose δ = 2. P-Clustering runs through the sorted list using a sliding window of variable width. The objects in the sliding window form a δ-pCluster provided the difference between the rightmost element and the leftmost one is no more than δ. For example, p-Clustering firstly sets the left edge of the sliding window at the left end of the sorted list, and moves rightward until it sees the first 6. The objects in between, {e, g, c}, is the set of objects of an attribute-pair MDS. Then, p-Clustering moves the left edge of the sliding window to object g, and repeats the process until the left end of the window runs through all elements in the list. In total, three MDSs can be found, i.e., ({x, y}, {e, g, c}), ({x, y}, {a, d, b, h}) and ({x, y}, {h, f }). A similar method can be used to find the object-pair MDSs. As our running example, consider mining maximal pattern-based clusters in a database DB as shown in Figure 5(a). Suppose mina = 3, mino = 3 and δ = 1. For each pair of attributes, we calculate the attribute pair MDSs. The attribute-pair MDSs returned are shown in Figure 5(b). We can also generate all the object-pair MDSs similarly. However, we can speed up the calculation of object-pair
a1 a2 a 3 a4 a5 5 6 7 7 1 4 4 5 6 10 5 5 6 1 30 7 7 15 2 60 2 0 6 8 10 3 4 5 5 1 (a) The database Objects Attribute-pair {o1 , o2 , o3 , o4 , o6 } {a1 , a2 } {o1 , o2 , o3 , o6 } {a1 , a3 } {o1 , o2 , o6 } {a1 , a4 } {o1 , o2 , o3 , o6 } {a2 , a3 } {o1 , o2 , o6 } {a2 , a4 } {o1 , o2 , o6 } {a3 , a4 } (b) The attribute-pair MDSs
Object o1 o2 o3 o4 o5 o6
Figure 5. The running example.
Object-pair Attributes {o1 , o2 } {a1 , a2 , a3 , a4 } {o1 , o3 } {a1 , a2 , a3 } {o1 , o6 } {a1 , a2 , a3 , a4 } {o2 , o3 } {a1 , a2 , a3 } {o2 , o6 } {a1 , a2 , a3 , a4 } {o3 , o6 } {a1 , a2 , a3 } (a) Object-pair MDSs in MaPle. Object-pair Attributes {o1 , o2 } {a1 , a2 , a3 , a4 } {o1 , o3 } {a1 , a2 , a3 } {o1 , o6 } {a1 , a2 , a3 , a4 } {o2 , o3 } {a1 , a2 , a3 } {o2 , o6 } {a1 , a2 , a3 , a4 } {o3 , o4 } {a1 , a2 , a4 } {o3 , o6 } {a1 , a2 , a3 } (b) Object-pair MDSs in method p-Clustering
Figure 6. Pruning using Lemma 3.1. MDSs by utilizing the information on the number of occurrences of objects and attributes in the attribute-pair MDSs. Lemma 3.1 (Pruning MDSs) Given a database DB and a cluster threshold δ, object threshold mino and attribute threshold mina . (1) An attribute a cannot appear in any significant δ-pCluster if a appears in less than mino ·(mino −1) object-pair MDSs, or appears in less than 2 (mina −1) attribute-pair MDSs; (2) An object o cannot appear in any significant δ-pCluster if o appears in less than mina ·(mina −1) attribute-pair MDSs, or appears in less than 2 (mino − 1) object-pair MDSs. Example 2 (Pruning using Lemma 3.1) Let us check the attribute-pair MDSs in Figure 5(b). Object o5 does not appear in any attribute-pair MDS, and object o4 appears in only 1 attribute-pair MDS. According to Lemma 3.1, o4 and o5 cannot appear in any significant δ-pCluster. Therefore, object-pairs containing o4 or o5 can be pruned. There are 6 objects in the database. Without this pruning, we have to check 6×5 = 15 pairs of objects. With this 2 pruning, only four objects, o1 , o2 , o3 and o6 survive. Thus, we only need to check 4×3 2 = 6 pairs of objects. 60% of the original searches are pruned. Moreover, since attribute a5 does not appear in any attribute-pair MDS, it cannot appear in any significant δpCluster. The attribute can be pruned, i.e., a5 can be removed from any object-pair MDS. In summary, after the pruning, only attributes a1 , a2 , a3 and a4 , and objects o1 , o2 , o3 and o6 survive. We use these attributes and objects to generate object-pair MDSs. The result is shown in Figure 6(a). In method p-Clustering, it uses all attributes and objects to generate object-pair MDSs. The result is shown in Figure 6(b). As can be seen, not only the computation cost in MaPle is less, the number of objectpair MDSs in MaPle is also one less than that in method p-Clustering. Once we get the initial object-pair MDSs and attributepair MDSs, we can conduct a mutual pruning between the
object-pair MDSs and the attribute-pair MDSs, as method p-Clustering does. Furthermore, Lemma 3.1 can be applied in each round to get extra pruning. The pruning algorithm is shown in Figure 7. (1) REPEAT (2) count the number of occurrences of objects and attributes in the attribute-pair MDSs; (3) apply Lemma 3.1 to prune objects and attributes; (4) remove object-pair MDSs containing less than mina attributes; (5) count the number of occurrences of objects and attributes in the object-pair MDSs; (6) apply Lemma 3.1 to prune objects and attributes; (7) remove attribute-pair MDSs containing less than mino objects; (8) UNTIL no pruning takes place
Figure 7. The algorithm of pruning MDSs.
3.3 Progressively Refining, Depth-first Search of Maximal pClusters The algorithm of the progressively refining, depth-first search of maximal pClusters is shown in Figure 8. We explain the algorithm step by step in this subsection. 3.3.1 Dividing Search Space By a list of attributes, we can enumerate all combinations of attributes systematically. The idea is shown in the following example. Example 3 (Enumeration of combinations of attributes) In our running example, there are four attributes surviving from the pruning: a1 , a2 , a3 and a4 . We list any subset of attributes in the order of a1 -a2 -a3 -a4 . Suppose that mina = 3, i.e., every maximal δ-pCluster should have at
(1) let n be the number of attributes; make up an attribute list AL = a1 -· · ·-an ; (2) FOR i = 1 TO n − mina + 1 DO (3) FOR j = i + 1 TO n − mina + 2 DO (4) find row-maximal pClusters (R, {ai , aj }); //Section 3.3.2 (5) FOR EACH row-maximal pCluster (R, {ai , aj }) DO (6) call search(R, {ai , aj }); (7) END FOR EACH (8) END FOR (9) END FOR (10) (11) FUNCTION search(R, D); // (R, D) is a row-maximal pCluster. (12) compute P D, the set of possible attributes; //Optimization 1 in Section 3.3.3 (13) apply optimizations in Section 3.3.3 to prune, if possible; (14) FOR EACH attribute a ∈ P D DO (15) find row-maximal pClusters (R0 , D ∪ {a}); //Section 3.3.2 (16) FOR EACH row-maximal pCluster (R0 , D ∪ {a}) DO (17) call search(R0 , D ∪ {a}); (18) END FOR EACH (19) END FOR EACH (20) IF (R, D) is not a subcluster of some maximal pCluster having been found (21) THEN output (R, D); (22) END FUNCTION
Figure 8. Projection-based search.
least 3 attributes. We divide the complete set of maximal pClusters into 3 exclusive subsets according to the first two attributes in the pClusters: (1) the ones having attributes a1 and a2 , (2) the ones having attributes a1 and a3 but no a2 , and (3) the ones having attributes a2 and a3 but no a1 . In general, the set of maximal pClusters can be divided into exclusive subsets by a list of attributes. Heuristically, for an attribute a, if there are many distinct objects appearing in the attribute-pair MDSs containing a, then it is likely that a may appear in a maximal pCluster of large size (i.e., a maximal pCluster containing many objects and attributes). Such attributes should be considered first in our search. Based on the heuristic, given a database DB, the rank of an attribute a is the number of distinct objects in the S attribute-pair MDSs containing a. That is, rank(a) = k (R,D)|a∈D Rk, where (R, D) is an attribute-pair MDS. The list of all attributes in the database in rank descending order is called the attribute-list of DB. Attributes having an identical rank can be sorted arbitrarily. For example, from the attribute-pair MDSs in Figure 5(b), we can compute the ranks of the attributes. The ranks of a1 , a2 , a3 and a4 are 4, 4, 4 and 3, respectively. Thus, we make up the attribute-list as a1 -a2 -a3 -a4 . We will use this list to search for maximal δ-pClusters in our running example.
Since a pCluster has at least 2 attributes, MaPle first partitions the complete set of maximal pClusters into exclusive subsets according to the first two attributes, then searches the subsets one by one in the depth-first manner. For each subset, MaPle further divides the pClusters in the subset into smaller exclusive sub-subsets according to the third attributes in the pClusters, and searches the sub-subsets. Such a process proceeds recursively until all the maximal pClusters are found. This is implemented by line (1)-(3) and (14) in Figure 8. 3.3.2 Finding Row-maximal pClusters Now, the problem becomes how to find the maximal δpClusters on the subsets of attributes. For each subset of attributes D, we will find the maximal subsets of objects R such that (R, D) is a pCluster. Such a pCluster is a maximal pCluster if it is not a sub-cluster of some others. Given a set of attributes D such that (kDk ≥ 2). A pCluster (R, D) is called a row-maximal δ-pCluster if there exists no any δ-pCluster (R0 , D) such that R ⊂ R0 . In other words, a row-maximal pCluster is maximal in the sense that no more objects can be included so that the objects are still coherent on the same subset of attributes. For example, in the database shown in Figure 5(a), ({o1 , o2 , o3 , o6 }, {a1 , a2 }) is a row-maximal pCluster for subset of attributes {a1 , a2 }. Clearly, a maximal pCluster must be a row-maximal pCluster, but not vice versa. Given a subset of attributes D, how can we find all rowmaximal pClusters efficiently? There are two cases. If D has only two attributes, then the row-maximal pClusters are the attribute-pair MDSs for D. Since the MDSs are computed and stored before the search, they can be retrieved immediately. Now, let us consider the case where (kDk ≥ 3). Suppose D = {ai1 , . . . , aik } where the attributes in D are listed in the order of attribute-list AL. Intuitively, (R, D) is a pCluster if R is shared by attribute-pair MDSs from any two attributes from D. (R, D) is a row-maximal pCluster if R is a maximal set of objects. One tricky thing here is that, in general, there can be more than one attribute-pair MDS for given attributes au , av . Thus, there can be more than one row-maximal pCluster on a subset of attributes D. Technically, (R, D) is a row-maximal pCluster if for each pair of attributes {au , av } ⊂ D, there existsT an attribute-pair MDS ({au , av }, Ruv ), such that R = {au ,av }⊂D Ruv . Recall that MaPle searches the combinations of attributes in the depth-first manner, all row-maximal pClusters for subset of attributes D − {aik } is found before we search for D. Therefore, we only need to find the subset of objects in a row-maximal pCluster of D − {aik } that are shared by attribute-pair MDSs of aij , aik (j < k). 3.3.3 Pruning and Optimizations Several optimizations can be used to prune the search so that the mining can be more efficient.
Optimization 1: Only possible attributes should be considered to get larger pClusters. Suppose that (R, D) is a row-maximal pCluster. For every attribute a such that a is after all attributes in D in the attribute-list, under what condition can we find a significant pCluster (R0 , D ∪ {a}) such that R0 ⊆ R? If (R0 , D ∪ {a}) is significant, i.e., has at least mino obo −1) jects, then a must appear in at least mino (min object2 pair MDSs ({oi , oj }, Dij ) such that {oi , oj } ⊆ R0 . In other words, for an attribute a that appears in less than mino (mino −1) object-pair MDSs of objects in R, there ex2 ists no row-maximal pCluster with respect to D ∪ {a}. Based on the above observation, an attribute a is called a possible attribute with respect to row-maximal pCluso −1) object-pair MDSs ter (R, D) if a appears in mino (min 2 ({oi , oj }, Dij ) such that {oi , oj } ⊆ R. In line (12) of Figure 8, we compute possible attributes and only those attributes are used to extend the set of attributes in pClusters. Optimization 2: Pruning local maxiaml pClusters having insufficient possible attributes. Suppose that (R, D) is a row-maximal pCluster. Let P D be the set of possible attributes with respect to (R, D). Clearly, if kD ∪ P Dk < mina , then it is impossible to find any maximal pCluster of a subset of R. Thus, such a rowmaximal pCluster should be discarded and all the recursive search can be pruned. Optimization 3: Extracting common attributes from possible attribute set directly. Suppose that (R, D) is a row-maximal pCluster with respect to D, and D0 is the corresponding set of possible attributes. If there exists an attribute a ∈ D0 such that for every pair of objects {oi , oj }, {a} ∪ D appears in an object pair MDS of {oi , oj }, then we immediately know that (R, D ∪ {a}) must be a row-maximal pCluster with respect to D ∪ {a}. Such an attribute is called a common attribute and should be extracted directly. Example 4 (Extracting common attributes) In our running example, ({o1 , o2 , o3 , o6 }, {a1 , a2 }) is a rowmaximal pCluster with respect to {a1 , a2 }. Interestingly, as shown in Figure 6(a), for every object pair {oi , oj } ⊂ {o1 , o2 , o3 , o6 }, the object-pair MDS contains attribute a3 . Therefore, we immediately know that ({o1 , o2 , o3 , o6 }, {a1 , a2 , a3 }) is a row-maximal pCluster. Optimization 4: Prune non-maximal pClusters. Our goal is to find maximal pClusters. Once we know that the recursive search on a row-maximal pCluster cannot lead to a maximal pCluster, the recursive search thus can be pruned. The earlier we detect the impossibility, the more search efforts can be saved. We can use the dominant attributes to detect the impossibility. We illustrate the idea in the following example. Example 5 (Detect non-maximal pClusters) In our running example, let us try to find the maximal pClusters whose first two attributes are a1 and a3 . Following the
above discussion, we identify a row-maximal pCluster ({o1 , o2 , o3 , o6 }, {a1 , a3 }). One interesting observation from the object-pair MDSs on objects in {o1 , o2 , o3 , o6 } (Figure 6(a)): attribute a2 appears in every object pair. We called a2 a dominant attribute. That means {o1 , o2 , o3 , o6 } also coherent on attribute a2 . In other words, we cannot have a maximal pCluster whose first two attributes are a1 and a3 , since a2 must also be in the same maximal pCluster. Thus, the search of maximal pClusters whose first two attributes are a1 and a3 can be pruned. The idea in Example 5 can be generalized. Suppose (R, D) is a row-maximal pCluster. If there exists an attribute a such that a is before the last attribute in D according to the attribute-list, and {a} ∪ D appears in an objectpair MDS ({oi , oj }, Dij ) for every ({oi , oj } ⊆ R), then the search from (R, D) can be pruned, since there cannot be a maximal pCluster having attribute set D but no a. Attribute a is called a dominant attribute with respect to (R, D).
4 Empirical Evaluation We test both MaPle and p-Clustering extensively on both synthetic and real life data sets. In this section, we report the results. MaPle is implemented using C/C++. We obtained the executable of p-Clustering from the authors of [12]. Please note that the authors of p-Clustering improved their algorithm dramatically after their publication in SIGMOD’02. All the experiments are conducted on a PC with a P4 1.2 GHz CPU and 384 M main memory running a Microsoft Windows XP operating system. The algorithms are tested against both synthetic and real life data sets. Synthetic data sets are generated by a synthetic data generator reported in [12]. Limited by space, we only report the results on a real data set, the Yeast microarray data set [11]. This data set contains the expression levels of 2, 884 genes under 17 conditions. Results on Yeast Data Set The results on Yeast data set are shown in Figure 9. We can obtain the following two interesting observations. δ 0 0 0
mina 9 8 7
mino 30 40 50
# of MPC 5 5 11
# of pClusters 5520 2.05 × 10⁹ 3.37 × 10¹⁵
Figure 9. Test results on Yeast raw data set. On the one hand, there are significant pClusters existing in real data. For example, we can find pure pCluster (i.e., δ = 0) containing more than 30 genes and 9 attributes in Yeast data set. That shows the effectiveness and utilization of mining maximal pClusters in bioinformatics applications.
MaPle p-Clustering
Runtime (seconds)
Runtime (seconds)
100 80 60 40
150 100 50
0
0 25 30 35 40 45 50 55 60 65 Minimum number of objects (min_o)
70
(a) Runtime vs. minimum number of objects in pClusters.
MaPle p-Clustering
120
200
20
20
140
MaPle p-Clustering
250
Runtime (seconds)
120
100 80 60 40 20 0
0
2000
4000 6000 Number of objects
8000
10000
(b) Scalability with respect to the number of objects in the data sets.
0
20
40 60 80 Number of attributes
100
120
(c) Scalability with respect to the number of attributes in the data sets.
Figure 10. Results on synthetic data sets. On the other hand, while the number of maximal pClusters is often small, the number of all pClusters can be huge, since there are many different combinations of objects and attributes as sub-clusters to the maximal pClusters. This shows the effectiveness of the notation of maximal pClusters. Results on Synthetic Data Sets We test the scalability of the algorithms on the two parameters, the minimum number of objects mino and the minimum number of attributes mina in pClusters. In Figure 10(a), the runtime of the algorithms versus mino is shown. The data set has 6000 objects and 30 attributes. Both algorithms are in general insensitive to parameter mino , but MaPle is faster than p-Clustering. The major reason is that the number of pClusters in the synthetic data set does not change dramatically as mino decreases and thus the overhead of the search does not increase substantially. Please note that we do observe the slight increases of runtime in both algorithms as mino goes down. One interesting observation here is that, when mino > 60, the runtime of MaPle is significantly shorter. That is because there is no pCluster in such a setting. MaPle can detect this in an early stage and thus can stop early. We observe the similar trends on the runtime versus parameter mina . The reasoning similar to that on mino holds here. Limited by space, we omit the details here. We test the scalability of both algorithms on the number of objects in the data sets. The result is shown in Figure 10(b). The data set contains 30 attributes, where there are 30 embedded clusters. We fix mina = 5 and set mino = nobj · 1%, where nobj is the number of objects in the data set. δ = 1. The result clearly shows that both MaPle and p-Clustering are scalable with respect to the number of objects in the data sets. MaPle performs substantially better than p-Clustering in mining large data sets. We also test the scalability of both algorithms on the number of attributes. The result is shown in Figure 10(c). The number of objects is fixed to 3, 000 and there are 30 embedded pClusters. We set mino = 30 and mina = nattr · 20%, where nattr is the number of attributes in the data set. Both MaPle and p-Clustering are approximately linearly scalable with respect to the number of attributes,
and MaPle performs consistently better than p-Clustering. In summary, from the tests on synthetic data sets, we can see that MaPle clearly outperforms p-Clustering. MaPle is efficient and scalable in mining large data sets.
5 Conclusions In this paper, we propose MaPle, an efficient and scalable algorithm for mining maximal pattern-based clusters in large databases. We test the algorithm on both real life data sets and synthetic data sets. The results show that MaPle outperforms the best method previously proposed.
References [1] C.C. Aggarwal et al. Fast algorithms for projected clustering. In SIGMOD’99. [2] C.C. Aggarwal and P.S. Yu. Finding generalized projected clusters in high dimensional spaces. In SIGMOD’00. [3] R. Agrawal et al. Automatic subspace clustering of high dimensional data for data mining applications. In SIGMOD’98. [4] R. Agrawal et al. Mining association rules between sets of items in large databases. In SIGMOD’93. [5] R. Agrawal and R. Srikant. Fast algorithms for mining association rules. In VLDB’94. [6] K. S. Beyer et al. When is “nearest neighbor” meaningful? In ICDT’99. [7] C. H. Cheng et al. Entropy-based subspace clustering for mining numerical data. In KDD’99. [8] Y. Cheng and G.M. Church. Biclustering of expression data. In Proc. of the 8th Int’l Conf on Intelligent System for Molecular Biology. [9] J. Han et al. Mining frequent patterns without candidate generation. In SIGMOD’00. [10] H. V. Jagadish et al. Semantic compression and pattern extraction with fascicles. In VLDB’99. [11] S. Tavazoie et al. Yeast micro data set. In http://arep.med.harvard.edu/biclustering/yeast.matrix, 2000. [12] H. Wang et al. Clustering by pattern similarity in large data sets. In SIGMOD’02. [13] J. Yang et al. δ-cluster: Capturing subspace correlation in a large data set. In ICDE’02.