Lecture Notes in Earth Sciences ISSN 2160-066X Volume 2
Mapping Wetland Cover Types Using Remote Sensing and GIS in Can Gio Mangrove Biosphere Reserve, Vietnam Pham Tien Dat1,a, Nguyen Kim Anh2,b, Kunihiko Yoshino3,c 1
Centre for Agricultural Research and Ecological Studies (CARES), Hanoi University of Agriculture Trau Quy, Gia Lam, Hanoi, Vietnam
2
Institute of Geography, Vietnam Academy of Science and Technology, 18 Hoang Quoc Viet Rd., Cau Giay, Hanoi, Vietnam
3
Faculty of Engineering, Information and Systems, University of Tsukuba, 1-1-1 Tennodai, Tsukuba, Ibaraki, 305-8573 Japan a
[email protected], b
[email protected],
[email protected] doi.10.5729/lnes.vol2.66
Keywords: Can Gio biosphere reserve, Mangrove change, Object-based classification, Pixel-based classification.
Abstract. Mangroves, an important type of tropical and semi-tropical coastal wetlands, are found in the inter-tidal zone where they play a major role in protecting land from erosion, facilitate alluvium deposition and mitigate the effects of typhoons and floods. Can Gio district is the first biosphere reserve located in the Southern coast of Vietnam and is in the first mangrove zone in Vietnam. This district is recorded as having one of the most successful mangrove reforestation and rehabilitation programs, not only in Vietnam, but also in Southeast Asia. The objective of this research was to analyze wetlands cover change using different sensors including LANDSAT, SPOT 5, and ALOS AVNIR-2 from 1994 to 2010 in the Can Gio mangrove biosphere reserve. A hybrid approach between pixel-based and object-based classifications was applied to improve accuracy assessment of the post satellite image processing. The findings of this research indicate that mangroves have increased by 17.3% between 1994 and 2010. The annual rate of mangrove gain was approximately 374 hectares. The overall accuracy assessment for 2004 and 2010 were 91%, 88%, and the Kappa coefficients were 0.88 and 0.84, respectively. From the viewpoint of conservation and management, this area is thought to be very well protected and the mangrove conservation system in Can Gio could become a typical example for other coastal areas to follow. This research provides the potential of using a hybrid classification technique for multi-temporal remotely sensed data for mapping mangrove forests in the coastal zones. 1. Introduction Coastal wetland ecosystems are considered the most important on the earth and they provide habitat for wildlife as well as numerous ecological resources for humans. Coastal wetlands include mangroves, salt marshes, tidal mudflats, and seagrasses of which mangroves are found in subtropical and tropical climates [1]. Mangrove forests play a major role to protect coastal zones from the waves [2] and the damage from the effects of tropical typhoons [3]. The importance of the latter was clearly demonstrated by the devastating effects of the Asian Tsunami in 2004 [4].
66
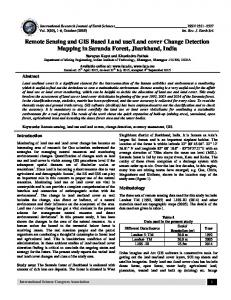
Globally more than 3.6 million hectares of mangroves have been destroyed of which 1.9 million hectares took place in Asia [5]. The mangrove area declined drastically in the early 20th century Vietnam [6]. The mangrove area reduced by 17,094 ha from Mong Cai to Do Son between 1964 and1997. The loss of mangrove was 4,640 ha in the Red River plain throughout the period 1975-1991, which was led to a decline of 7,430 ha during the year 1993. The Southern coastal zone parts of Viet Nam witnessed little change in mangroves (from 250,000 ha to 210,000 ha) during 1950 – 1960. This reduced to 92,000 ha of mangroves in 1975 due to the spraying of herbicides by the American forces (1962 – 1972) [7]. Mangroves have decreased by 30% since 1965 in Ca Mau province [8], and the mangrove area in Cai nuoc district declined by two-third between 1968 and 2003 [9]. This loss of mangrove forests was due to shrimp farming. On the other hand, mangrove forests in Can Gio increased significantly from 1989 to 2001 [10] thanks to good and effective conservation and management [7, 11]. It is necessary to identify the location of mangroves, which had changed throughout the different periods to promote mangrove conservation program. Throughout world, research has been undertaken using various satellite remotely sensed data for mapping and monitoring land covers types in wetlands [12-16]. Multi-temporal and multi-sensors satellite remotely sensed data provides useful information to detect mangrove change and facilitate monitoring [10]. Nevertheless, few studies have used a Geographic Information System (GIS) and remote sensing data for wetland cover mapping in Vietnam. Thus, mangrove mapping plays an important role in updating mangrove wetland status in Vietnam. Remotely sensed data can be applied for large areas and provide a powerful tool for mapping coastal wetlands where access for survey is limited and inconvenient [10]. These data can be implemented throughout different periods for mangrove forest management. Satellite based mapping is used by natural resource managers in their attempt to protect natural habitats and plan against future loss and degradation. In this research, a hybrid approach of wetland mapping was introduced based on pixel based and object-based classification. Moreover, the integration of wetland cover maps into a GIS can be used to analyze how the wetland condition changed in Can Gio mangrove biosphere reserve, Vietnam between 1994 and 2010. 2. Study area Can Gio is a coastal district located about 50 km south of Ho Chi Minh city (formerly Sai Gon) on the Southern coast of Vietnam. The geographical coordinates are 10022’- 10040’ latitude and 106046’-107001’ longitude. This district has a tropical monsoon climate and contains two seasons. The rainy season is from May to the end in October. The average temperature is 260C, annual rainfall is roughly 1,300-1,400 mm and humidity is about 80%. This district is recorded as having one of the most successful mangrove reforestation and rehabilitation programs not only in Vietnam but also in Southeast Asia [7]. The wetlands ecosystem of Can Gio is diverse and contains the mangrove areas distributed in zone IV, which is characterized by the largest mangrove forest in Vietnam (Fig 1), among the four mangroves zones [17]. The mangrove forests in Can Gio were adopted as a biosphere reserve by the UNESCO during the year 2000 [7, 18], and consist mainly of Rhizophora apiculata together with other assemblages of Sonneratia alba, Avicennia alba, R. mucronata, etc… Approximately 33 species belonging to 19 genera and 15 families have been identified in the Can Gio mangroves [17].
67
Fig. 1 Study site in Can Gio district, Ho Chi Minh city
3. Materials and Methodology 3.1 Material The satellite images are depicted in table 1. Multi-resolution and multi-temporal data was employed to archive the current and historical status of wetland in the Can Gio biosphere reserve from 1994 to 2010. The different sensors used include LANDSAT TM/ETM, SPOT 5 and ALOS AVNIR2. Table 1 List of satellite images used in the study Name
Date
ALOS AVNIR2 SPOT 5 LANDSAT ETM+ LANDSAT TM
2010 2004 2002 1994
Spatial resolution 10 m 10 m 30 m 30 m
Spectral resolution Multi-spectral (4 bands) Multi-spectral (4 bands) Multi-spectral (6 bands) Multi-spectral (6 bands)
Since Can Gio district extends through two scenes of LANDSAT images; a mosaic of the two scenes was utilized to obtain an entire view of the wetlands in the district. 3.2 Methodology 3.2.1 Satellite imagery processing Pre-processing of satellite imagery: ALOS AVIR2 level 1B2 was achieved from the Remote Sensing Technology Center (RESTEC) of Japan. We used the GDEM 30m for orthorectification of ALOS data and SPOT5 level 2A (http://www.gdem.aster.ersdac.or.jp ). Hybrid approach for classification: A hybrid method for image processing in this study is a combination of pixel-based and object-based classification. This approach classified land cover types based on multi-spectral bands from the different satellite sensors [19]. The image classification of remotely sensed satellite data is divided into the following steps: 68
Firstly, satellite images were classified into 50 spectral classes using an unsupervised ISODATA classification algorithm [20]. The unsupervised classification, which refers to pixel-based classification, is a traditional approach. It is commonly and widely used [21]. The spectral classes were labeled using available reference data including Google Earth for the year 2004 and land use maps for the year 2005 and 2010, which were acquired from the Department of Survey and Mapping (DOSM), Ministry of Natural Resources and Environment (MONRE) of Vietnam. Secondly, after labeling the image segmentation procedure was initiated. Image segmentation is one of the object-based method [22]. The remotely sensed images were divides into homogenous segments based on three parameters: scale, color (spectral information) and shape. In this research, 10 land cover types of wetland ecosystem were classified including mangrove, rice paddy, aquaculture, tidal mudflat, settlement, salt marsh, perennial trees, bare land, and water bodies. The NDVI (Normalized Difference Vegetation Index) is also used during the image processing process. This index is applied to extract the vegetation areas such as: mangrove forest, perennial trees and rice paddy and non-vegetation areas including salt marsh, aquaculture, settlement, mudflat, and water bodies. The vegetation index is a ratio of reflected energy in visible red and near infra-red bands, expressed in the 8-bit data used as NDVI = (NIR – RED) / NIR + RED where NIR: Near Infrared energy and RED: visible red energy [10]. The NDVI index is utilized to achieve forest cover distribution in the wetland regions of Can Gio. Using a vegetation index allows better discrimination between mangroves and other vegetation cover types [23]. Thirdly, manual editing of segments was employed using GIS applications. In this research, ArcGIS 9.3 was used to update more information about wetlands characteristics [24] as well as correct the objects based on reference data. Lastly, quality checking is the last step of image classification. If the classification passed this check, it was recorded as one cover type. Otherwise, it was returned for further editing. This step also included accuracy assessment. We generated the accuracy assessment by available data from land use maps acquired from the DOSM, MONRE of Vietnam. The wetland cover classification was evaluated using standard measures of accuracy assessment [25] and the pixels residing inside the verification objects as reference. Two land use maps for the year 2005 and 2010 were utilized to generate accuracy assessment of the post imagery classification. The image classification for this study is showed in Fig. 2.
69
Fig. 2 Flowchart of the image classification of remotely sensed data
Before running segmentation, the composite RGB was created based on three different bands (Mid-infrared, Near-infrared and Red) for LANDSAT TM, ETM+, SPOT5, and (Near-infrared, Red and Green) for ALOS AVNIR-2. 4. Results and Discussions 4.1 Results 4.1.1 Mapping wetland covers in Can Gio district Figure 3 illustrates the wetlands cover maps from 1994 to 2010 in Can Gio mangrove biosphere reserve. The overall accuracy of the satellite image classification for the years 2004 and 2010 are 91%, 88%, and the Kappa coefficients are 0.88, 0.84, respectively (Table 2). There were a few classification errors due to spectral similarities and gradual transitions among several classes (e.g. mangroves vs. perennial trees, bare land vs. settlement, and aquaculture vs. water). For some classes, user’s accuracies are lower than those of producer’s accuracies since skilled users were engaged in the land covers maps production. The overall accuracy assessment and the Kappa indexes of the satellite image classification are shown in table 2.
70
Fig. 3 Wetlands cover maps in Can Gio biosphere reserve from 1994 to 2010 Table 2 Accuracy assessment of the wetlands cover maps for Can Gio between 1994 and 2010
Mangroves Aquaculture Rice Paddy Perennial trees Settlement Salt marsh Tidal Mudflat Bare land Water bodies Overall acc. Kappa index
2004 wetland cover Producer's acc. User's acc. 87.33% 99.53% 91.19% 81.17% 81.88% 72.22% 88.60% 67.09% 85.31% 74.00% 75.68% 96.74% 89.91% 73.04% 92.53% 81.55% 98.77% 97.69% 91% 0.87
71
2010 wetland cover Producer's acc. User's acc. 89.07% 94.96% 98.82% 75.72% 71.99% 77.31% 94.35% 69.97% 55.95% 62.66% 87.71% 92.96% 58.23% 96.07% 78.92% 70.56% 97.53% 94.96% 88% 0.84
By overlaying past and current wetland cover maps in the GIS environment, it is possible to find out that mangrove forests in the study area have increased significantly. 4.1.2 Wetland cover change from 1994 to 2010 The mangrove forest area expanded by 17.3% between 1994 to 2010. The annual rate of mangrove gain was nearly 374 hectares. The change indicates that Can Gio has good mangrove protection. At present, the mangrove areas comprise to nearly 34,473 hectares. This number nearly equals the figure before the second Indochina war (40,000 hectares) [7]. In addition, thanks to the mangrove forest allocation program, mangrove forests have increased significantly. Mangrove areas must be certified for right of use. On average, each household was allocated 80-100 hectares of mangrove to protect. There were about 167 local households protecting 14,198 hectares of planned and natural mangrove forest by the year 2005. Remarkably, the fund granted for forest protection and management from the local government to local people in Can Gio was much higher than that of other provinces. The salary for forest guardians increased over time, starting at 70,000 VND/ha/year increasing to 185,000 VND and then to 316,000 VND; this number increased to 445,000 VND/ha throughout the year 2006. In other provinces, the amount of money received from local government was only 50,000 VND/ha/year before 2009 and then this figure increased to 100,000 VND [11]. Table 3 Mangrove area statistics in Can Gio from 1994 to 2010
Period
Onset of period (ha)
End of period (ha)
Mangrove Area change (ha)
% change
Annual rate of gain (ha yr-1)
1994 - 2002
28495.68
31356.05
2860.37
10
357.55
2002 - 2004
31306.05
31938.20
582.15
1.9
291.08
2004 - 2010
31938.20
34472.67
2534.47
7.9
422.41
1994 - 2010
28495.68
34472.67
5976.99
17.5
373.56
It is clear that Can Gio mangrove biosphere reserve has good mangrove conservation and management. This district has one of the most successful wetland conservation and management programs, not only in Vietnam but also in Southeast Asia, and its mangrove conservation and management system has become an example for other coastal area to follow. This is due to effective wetlands management and success of the rehabilitation program in Can Gio is facilitated by local institutions and the property rights of local people [26]. 4.2 Conclusions This research indicates the potential of a hybrid approach using multi-temporal remotely sensed data for mapping wetlands. This technique provides high overall accuracy and the Kappa coefficients. The wetlands ecosystem in Can Gio is successful case in recovering and developing mangrove forest thanks to great contributions by local institutions and the property rights of local people. The statistical findings of this research are valuable in understanding the current wetland ecosystem in Can Gio district, Ho Chi Minh city in the Southern part of Vietnam. 5. Acknowledgements The authors are thankful the JICE (Japanese International Cooperation Center) for providing funds to purchase satellite imagery. In addition, we express our gratitude to EDL (Environmental Diplomatic Leader) staff, the University of Tsukuba, Japan for editing the manuscript.
72
References [1] Wolanski, E., et al., Coastal Wetlands: An Integrated Ecosystem Approach. First edition 2009 ed, ed. Gerardo M.E. Perillo, et al. 2009, The Netherlands: Elsevier. [2] Mazda, Y., et al., Mangroves as a coastal protection from waves in the Tong King delta, Vietnam. Mangroves and Salt Marshes, 1997. 1(2): p. 127-135. [3] Daniel M, A., Mangrove forests: Resilience, protection from tsunamis, and responses to global climate change. Estuarine, Coastal and Shelf Science, 2008. 76(1): p. 1-13. [4] Danielsen, F., et al., The Asian Tsunami: A Protective Role for Coastal Vegetation. Science, 2005. 310: p. 643. [5] FAO, The World's mangroves 1980-2005. A thematic study prepared in the framework of the Global Forest Resources Assessment 2005, in FAO Forestry Paper2007, Food and Agriculture Organization of the United Nations: Rome. p. 89. [6] Tuan, L.X., et al., Environmental Management in Mangrove Areas Environmental Informatics Archives, 2003. 1: p. 38-52. [7] Tuan, L.D., et al., Can Gio Mangrove Biosphere Reserve. 2002, Ho Chi Minh city: Agricultural Publishing house. 311. [8] Tong, P.H.S., et al., Assessment from space of mangroves evolution in the Mekong Delta, in relation to extensive shrimp farming. International Journal of Remote Sensing, 2004. 25(21): p. 4795-4812. [9] Binh, T.N.K.D., Vromant, N., Hung, N.T., Hens, L., Boon, E.K., Land cover changes between 1968 and 2003 in Cai Nuoc, Ca Mau Peninsula, Vietnam. Environment, Development and Sustainability, 2005. 7: p. 519-536. [10] Hang, H.T.M., et al., Geo-Environmental Research for Can Gio Mangrove Forest, Vietnam. Asian journal of Geoinformatics 2003. 3(3): p. 3-12. [11] Tuan, L.D. The essential factors leading to success in Can Gio mangrove restoration and management of Ho Chi Minh city, Vietnam. in Proceedings of the Eco-town V: Community participation in conservation, Sustainable use and rehabilitation of mangroves in Southeast Asia. 1996. Ho Chi Minh city, Vietnam. [12] Ozesmi, S.L. and M.E. Bauer, Satellite remote sensing of wetlands. Wetlands Ecology and Management, 2002. 10(5): p. 381-402. [13] Seto, K.C. and M. Fragkias, Mangrove conversion and aquaculture development in Vietnam: A remote sensing-based approach for evaluating the Ramsar Convention on Wetlands. Global Environmental Change, 2007. 17(3-4): p. 486-500. [14] Lee, T.-M. and H.-C. Yeh, Applying remote sensing techniques to monitor shifting wetland vegetation: A case study of Danshui River estuary mangrove communities, Taiwan. Ecological Engineering, 2009. 35(4): p. 487-496. [15] Dronova, I., P. Gong, and L. Wang, Object-based analysis and change detection of major wetland cover types and their classification uncertainty during the low water period at Poyang Lake, China. Remote Sensing of Environment, 2011(0). [16] Klemas, V., Remote Sensing of Wetlands: Case Studies Comparing Practical Techniques. Journal of Coastal Research, 2011: p. 418-427.
73
[17] Hong, P.N. and H.T. San, Mangroves of Vietnam, in IUCN1993: Bangkok, Thailand. p. 173 pages. [18] Vogt, J., et al., Do canopy disturbances drive forest plantations into more natural conditions? — A case study from Can Gio Biosphere Reserve, Viet Nam. Global and Planetary Change, 2011(0). [19] Zingaretti, P., et al., A Hybrid Approach to Land Cover Classification from Multi Spectral Images, in Image Analysis and Processing – ICIAP 2009, P. Foggia, C. Sansone, and M. Vento, Editors. 2009, Springer Berlin / Heidelberg. p. 500-508. [20] Jensen, J.R., Introductory Digital Image Processing: A Remote Sensing Perspective ed. 2nd. 1996, New York: Prentice-Hall, Inc.: Saddle River. [21] Navulur, K., Multispectral Image Analysis Using the Object-Oriented Paradigm, 2007, Taylor & Francis Group, LLC [22] Dehvari, A. and R.J. Heck, Comparison of object-based and pixel based infrared airborne image classification methods using DEM thematic layer Journal of Geography and Regional Planning, 2009. 2(4): p. 086-096. [23] Satyanarayana, B., et al., Remote sensing in mangrove research – Relationship between vegetation indices and dendrometric parameters: A case for coringa, east coast of India in ACRS – 22nd Asian Conference on Remote Sensing2001: Singapore. p. 567-572. [24] Dahdouh-Guebas, F., et al., Recent Changes in Land-Use in the Pambala–Chilaw Lagoon Complex (Sri Lanka) Investigated Using Remote Sensing and GIS: Conservation of Mangroves vs. Development of Shrimp Farming. Environment, Development and Sustainability, 2002. 4(2): p. 185-200. [25] Congalton, R.G. and K. Green, Assessing the accuracy of remotely sensed data - Principles and Practices. 1999, New York: Lewis Publishers. [26] Adger, W.N. and C. Luttrell, Property rights and the utilisation of wetlands. Ecological Economics, 2000. 35(1): p. 75-89.
74