Marking up a World: Visual Markup for Creating and Manipulating Virtual Models Don Kimber
Chong Chen
Eleanor G. Rieffel
FX Palo Alto Laboratory 3400 Hillview Ave. Palo Alto, California
University of Illinois at Chicago 851 South Morgan M/C 154 Chicago, IL 60607
FX Palo Alto Laboratory 3400 Hillview Ave. Palo Alto, California
[email protected]
[email protected] Jun Shingu
FX Palo Alto Laboratory 3400 Hillview Ave. Palo Alto, California
[email protected]
[email protected]
Jim Vaughan FX Palo Alto Laboratory 3400 Hillview Ave. Palo Alto, California
[email protected]
ABSTRACT We describe Pantheia, a system that constructs virtual models of real spaces from collections of images, through the use of visual markers that guide and constrain model construction. To create a model users simply ‘mark up’ the real world scene by placing preprinted markers that describe scene elements or impose semantic constraints. Users then collect still images or video of the scene. From this input, Pantheia automatically and quickly produces a model. The Pantheia system was used to produce models of two rooms that demonstrate the effectiveness of the approach.
1.
INTRODUCTION
An increasing number of applications make use of virtual representations of real physical spaces. Museums, conference rooms, trade show venues, and factory floors may be represented in a virtual environment, to support virtual tours, provide immersive telepresence into the space, facilitate use planning for the space, or to provide an interface for monitoring activity occurring in the space. Unfortunately, creating such models is expensive and time consuming, involving measurement, photography, and sophisticated graphics tools. An ambitious long term research goal is to automatically construct such models from collected images; fully automatic approaches are not yet possible. Current state of the art modeling is done using interactive modeling tools which let artists use images to aid in model construction. The Pantheia system takes a step toward automation. It requires users to ‘mark up’ the real world with uniquely identifiable visual markers with predefined meanings, and to collect video or images of the space. Pantheia detects markers
Permission to make digital or hard copies of all or part of this work for personal or classroom use is granted without fee provided that copies are not made or distributed for profit or commercial advantage and that copies bear this notice and the full citation on the first page. To copy otherwise, to republish, to post on servers or to redistribute to lists, requires prior specific permission and/or a fee. Immerscom 2009, May 27-29, 2009, Berkeley, USA. Copyright 2009 ICST ISBN # 978-963-9799-39-4.
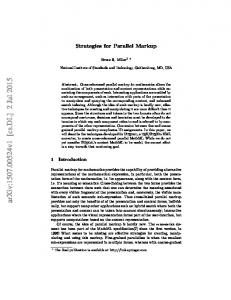
Figure 1: 3D model and photo of our lab
in the images and uses them to automatically construct a model of the scene. The marker meanings support the modeling of scene elements such as walls, doors, and windows and impose semantic constraints such as coplanarity, region subdivision, or color matching. Markers can also indicate where to place predefined models of furniture or equipment. Figure 1 shows the model of our lab created by Pantheia which includes a preexisting model of a piece of equipment. In a typical use scenario, many markers, of various sizes, shapes, and meanings are placed around the space. One or more markers placed in easy to measure locations serve as fiducial markers. The fiducial markers are generally large to be easily detected in many images. Additional markers of various sizes are placed around the space to specify markup
semantics. A set of markers designated as belonging to a wall group may be placed on a wall to help Pantheia identify that wall. Four markers may delineate a rectangular region corresponding to a picture, window, or digital display. When all semantic markers have been placed, the user must collect a sufficient set of images or video to allow Pantheia to determine the pose, that is the position and orientation, of each marker. In general, a marker pose can be determined if it is either itself a fiducial marker, or it is co-visible in at least one image with another marker whose pose can be determined. To ensure that this condition is met, it may be necessary to place additional ‘scaffold markers’ so that no groups of markers are visually isolated. Finally, given the marker poses, Pantheia interprets the marker semantics to create a model of the space. This model will be more or less rich depending on which aspects of the space were captured by the marker semantics. Figure 3 shows some markers used by Pantheia. Each marker includes an easily detected square pattern that is uniquely identifiable. The system has access to information about the markers, from basic information such as size and shape, to higher level information about individual and groups of markers that is used in the virtual construction. Because the size of the markers is known, for each marker detected in an image, the relative pose of the marker with respect to the camera can be estimated. If the pose of any marker visible in an image is known, the camera pose for that image can be estimated. Conversely, if the camera pose is known, the marker pose can be estimated. The algorithm that determines all marker poses starts by estimating the pose of images containing fiducial marker. From these camera poses, the pose of any marker detected in these images can be estimated. This process may be repeated to estimate the poses of all markers, given enough images and assuming there are no visually isolated groups. Various estimation sequences are possible, and give results of varying quality. These estimates can be improved by applying bundle adjustment [20], a global optimization procedure. Pantheia uses ARToolKitPlus [1] to detect markers and determine relative pose between markers and cameras, and SBA [11] to perform bundle adjustments. Section 4 describes the estimation method in detail. The remainder of this paper describes Pantheia more fully and reports on two room models we built to evaluate the system. Section 2 reviews related work. Section 3, describes markup semantics used in our experiments. Section 4 provides a detailed description of Pantheia including pose estimation issues. Section 5 describes experiments used to evaluate Pantheia. Section 6 contains concluding remarks.
2.
RELATED WORK
Researchers such as [16, 17, 7] work on non-marker-based methods for constructing models from images. Their work advances progress on the hard problem of deducing geometric structure from image features. Instead, we make the problem simpler by placing markers that are easily detected and have meanings that greatly simplify the geometric deduction. Furthermore, a marker-based approach enables users to specify which parts of the scene are important. In this way, Pantheia handles clutter removal and certain occlusion issues easily since it renders what the markers indicate rather than what is seen. In addition, markers enable the specification of deviations from the physical scene.
Figure 2: System generated model of meeting room
Markers such as QR codes support augmented reality applications by indicating what models, or other information, should be shown where in an augmented reality display. ARToolKit was designed for this application [1]. Others have used markers simply as labels [6]. Markers, including QR codes, are frequently used for camera pose estimation in 3D reconstruction tasks [18, 19]. Some groups use markers to provide size or angle calibration information [14] for 3D object reconstruction. Fiala and Shu [9] use a combination of markers and SIFT features to determine camera poses and correspondence points between images to support object modeling. Schall et al. [13, 10] use markers together with geodetic equipment to construct models; their markers have no special meanings and are primarily used to find transforms between sets of measurements made with specialty equipment. Our work goes beyond using markers simply as labels, or for calibration or pose estimation, or to indicate where objects or information should be shown. The main novelty in our work is the use of a markup language that provides markers with a rich set of meanings that guide the construction of a model. Chella et al. [5] developed an ontology for indoor environments, and implemented an XML-based language based on this ontology, used by a group of roving robots to communicate in order to build a model of their environments. Madden et al. [12] patented a system that enables users to markup a model obtained from images, or markup the images, with additional information that is used to improve the model. Their approach is complementary to ours; their markup occurs after the images are taken whereas we are taking images of a physically marked-up space. Non-vision-based approaches are also possible. For example, 3D scanners that provide distance information are used to build models using SLAM techniques [8], for example.
Our marker-based approach avoids certain clutter and occlusion issues that affect 3D scanner model reconstruction by rendering what is indicated by the markers rather than what is sensed. Also a pure scanner-based approach cannot reconstruct visual features such as color and texture. Eventually Pantheia may be able to support combining 3D scanner data with the marker-based image data we currently use.
3.
simple marker
a corner marker
alternative corner marker
SPATIAL MARKUP
Pantheia produces a virtual model from a set of images containing user placed markers with predefined meanings. Semantic markers may be thought of as elements of a markup grammar that describes the model. We are still working to define this language. Section 3.1 describes the preliminary markup language we used in our experiments.
3.1
Marker Semantics
Each marker used by Pantheia contains a square pattern (see Figure 3) which is used for pose estimation, and which also encodes a unique marker ID, by which the marker may be assigned a ‘group’ and a ‘type’. Roughly, the markers of a given group form a ‘sentence’ in the markup language, which makes an assertion such as the existence of a planar region which is a wall. The basic markup types of the markup grammar are: • Plane: markers that lie on the same planar surface. • Image extractor: markers that define an area containing an image, such as a picture or bulletin board. • Object insertion: markers that indicate how an existing 3D model should be inserted. Plane markers indicate the model must include a planar region fitted to these markers. Section 4.3 describes how that fitting is done, and how boundaries are deduced from intersections with other planes, or defined by modifier markers. The ultimate grammar will have a number of subtypes of plane, optimized for particular purposes. The subtypes used to create our models are:
line marker
texture sampler marker
Figure 3: Examples of visual markup markers fitted line are constructed extending from the corners. Four corner markers by themselves can define lines bounding a rectangular region. In all of these cases, the resulting lines change the boundary of the planar region on which they lie. This region may be a ‘hole,’ or may have a different color or texture than the main region. We used two categories of appearance control markers. • Color groups and samplers: markers belonging to a color group indicate that all regions containing these markers have the same color. That color is defined by one or more color sampler. • Texture groups and samplers: markers belonging to a texture group indicate that all regions containing these markers have the same texture, as defined by a texture sampler. A sampler marker (Figure 3) has a cutout region in which the background surface is clearly visible in images showing the marker. The pixels found in that region determine the color or texture of the associated group.
• Wall: markers that all lie on the same wall.
3.2
• Ceiling and Floor: Ceiling markers lie on a horizontal plane that bounds walls from the top. Floor markers bound walls from below.
We envision markers preprinted as sheets of stickers that can be easily placed and removed. Our experiments, however, used markers printed on paper and affixed with tape or tacks. For Pantheia to construct a model, it must be able to estimate the pose of all markers. A marker’s pose can be estimated if there is a chain of images connecting it to a fiducial marker. The co-visibility graph has a vertex for each marker, and an edge connecting two vertices if the corresponding markers are co-visible in some image. If the covisibility graph is connected, all marker poses can be estimated relative to the fiducial marker. When placing markers and collecting images, users must ensure the resulting graph is connected. Users may need to place markers for the sole purpose of connecting otherwise isolated sets of markers. At the highest level, there are three categories of marker use:
• Door: Door markers specify a vertical plane and its boundaries. There are two types of modifier markers: those that refine the geometry of the planar regions listed above, and those that modify their appearance. Geometric modifiers include: • Line: markers that define a line. • Corner: A corner marker indicates a 90◦ corner. Geometric modifiers are used in different ways depending on the context. They are usually implicitly part of another group - for example, region markers which lie on a plane are grouped with that plane - and modify the modeling of that group. For example, a line fitted to the markers in a line group divides a planar region in two. If corner markers are present among the line markers, lines perpendicular to the
Marker Usage
• Fiducial markers are placed to establish a frame of reference. The pose of a fiducial marker may be specified relative to a coordinate system convenient to the
user, or may be left unspecified, in which case all coordinates will be relative to the fiducial marker.
Fiducial Markers (known position)
• Semantic markers form the majority of markers. They guide and constrain the construction of the model through their associated meanings.
4.
PANTHEIA SYSTEM DESCRIPTION
This section describes Pantheia’s overall structure and processes. The basic steps in Pantheia’s model production are: 1. Place markers in space 2. Collect video or images 3. Import and process images 4. Estimate marker and image poses 5. Handle geometric markup 6. Handle image and color markup 7. Render and view model In the simplest cases, these steps are carried out once sequentially. Pantheia supports an interactive process, however. The user can see the progress at each step and may
Semantic Markers
Use certified markers to estimate more image poses
Place markers
Collect & Import images
Video frames
images
• Scaffold markers connect otherwise isolated groups of markers to ensure that the co-visibility graph is connected so all marker poses can be estimated. These categories are loose. For example, a semantic marker may also be a fiducial marker. In some cases, scaffold markers may be needed only temporarily to estimate the pose of more permanent markers. For example, two visually separated regions that need detailed modeling can be connected by placing temporary scaffold markers which are used to estimate the relative positions of a marker in each detailed region so that even after the scaffold markers are removed, the global pose of all semantic markers near these two markers can be estimated. Each marker has an associated coordinate system determined by its square pattern. Its origin is the center of the square. The x-axis aligns with the bottom of the square, and points to the right. The y-axis points upward along the square, and the z-axis points out of the square. Determining the pose for a marker is equivalent to determining the transform between its coordinate system and the world coordinate system. Marker semantics may use points, line segments, or regions that do not necessarily lie on the square pattern, and which are specified in terms of marker coordinates. For corner and line markers (see Figure 3), the salient point or line is generally at the edge of the marker, and guide marks indicate which point or segment is salient so the user can place the marker properly. Texture extraction markers contain a cutout square bounding the region that will be sampled. We found markers of varying sizes useful. Fiducial and scaffold markers should generally be large so that they can be detected in many images, including distance shots. Image extraction markers may need to be small to fit on thin frames or into small spaces between a picture and a nearby object. We used five sizes ranging from 4cm to 16cm.
Scaffold Markers
Known Image poses Estimation loop
Use image poses to estimate more marker poses
Known marker poses
Certify markers using bundle adjustment markers and images poses
Markup Handler
Generate models
Figure 4: Estimation process overview decide to place more markers or collect additional images. A graphical interface lets a user intervene for diagnostic purposes, such as to indicate images to be ignored or marker poses that are poorly estimated. Steps 1 and 2 are carried out by the user and have been previously described. Strictly speaking Steps 2 and 3 may be combined, since Pantheia has the capability to either import images, or directly capture video from a webcam or DV Camcorder device. The other steps are described in the remainder of this section.
4.1
Image import and detection
The first processing step imports images captured by a still camera or video device. We use ARToolKitPlus [2] to process the images, detect markers, and estimate the relative pose of each marker with respect to the camera. To improve the marker detection rate and accuracy, we first run the detection to determine the location of candidate markers, and then use Otsu’s threshold selection technique [15, 3] on each region of interest before rerunning ARToolKit. These regions of interest have a bi-modal intensity histogram, and this technique allows the markers to be detected, with good accuracy. This step results in a set of images, each containing at least one identified marker, and an estimate of each identified marker’s pose relative to the camera.
4.2
Pose Estimation
The next step estimates a global pose for each marker in terms of a single world coordinate system. ARToolKit estimates the pose of any image containing a marker with known pose using the marker pattern corners. While a single known marker pose suffices, better estimates are expected if more marker poses are known. Similarly, ARToolKit estimates the pose of any marker detected in an image with known pose. At any step of pose estimation, we have a set M of markers with known pose estimates, and a set I of images with known estimates. Initially, M is the set of measured fiducial markers, and I is empty. We iteratively estimate poses for additional images containing markers in M and add those images to I, and then estimate poses for any markers visible
ceiling1 A
wall1
door1
wall2
B
E
C
D
F
wall3
H
X
Y
G
floor1
Figure 6: Plan view of room with concave geometry
wall2
1. Create: An initial model of the object is created, based on the initial marker estimates. 2. Update: The model is updated as additional marker estimates become available.
Figure 5: Intersections of planes
in newly estimated images, and add those to M . If the co-visibility graph is connected, this process leads to a complete set of estimates. However, different chains lead to the same marker thus providing multiple disparate estimates. It is desirable to have a procedure that uses all observations to give the best global estimate. Bundle adjustment provides such a global estimate by minimizing the re-projection error [20]. We use the open source package SBA [11] to perform the bundle adjustment. Bundle adjustment can get stuck in local minima; good initialization is required. It is also slow on large data sets. We experimented with several procedures for initializing bundle adjustment, and are still investigating this area. When a marker is estimated, the estimate is based on a single image. If the marker is poorly estimated, and this pose estimate is then involved in the pose estimate of additional images, it can cause additional estimation errors. To address this problem, we use marker pose certification; a marker pose estimate is not used in the estimation of image poses until it has been certified. In our current procedure, each time a new set of marker poses has been estimated, the marker visible in the most images with known pose is bundle adjusted, and becomes certified. We found this conservative procedure helps to avoid bad global bundle adjustment initializations which fail to converge to good solutions. The four corners of a marker pattern of known size have 6 degrees of freedom, not 12. Ideally bundle adjustment would take these constraints into account, but we have not yet implemented that part; we currently do bundle adjustment and then fit the results to a square of the correct size.
4.3
Markup Handling
The markup handler component of the Pantheia system is responsible for producing the Virtual Reality Modeling Language (VRML) model. It consists of a manager and a handler for each of the marker group types described in Section 3. As marker estimates become available, the manager groups the markers and invokes the appropriate handler.
3. Adjust: Each handler updates its model based on the status of the other handlers. This process takes place over several iterations. 4. Render: Creates a VRML model from the information produced by each handler. We describe the plane handler since planes are the most common architectural component. During the create and update phases, the plane handler fits a plane to the marker estimates in its group using eigen analysis, and generates a large square surrounding the markers of default side length. The adjustment phase splits each square region along its lines of intersection with the other squares (see Figure 5), initially keeping only regions containing a marker. In the simplest cases, these are exactly the desired regions, but for more complex cases, this process may have thrown out too much, so we need to expand some regions. For each retained region, consider each adjacent discarded coplanar region. If the boundary line between a region and an adjacent region came from an intersection with part of a square that has now been discarded, expand the region to include the adjacent region. Continue to expand, examining all discarded regions adjacent to the new region, until no more expansion is possible. For example, in a room with the floor plan of Figure 6, the plane HG intersects the planes BC and ED. Say only one marker lies on that plane, and it lies above line segment HX; only that part of the wall is kept after the first step. But because the region above line segment CX is not retained, the region above HX expands, to include the region above XY in the second step, and because DY was also not retained, it expands to the entire region above HG. During the adjustment process, lines may be added to a plane’s set of bounding lines. For example, the door markup handler determines the wall on which the door is situated and makes the rectangular opening for the door in the wall. The line markup handler fits a plane to the markers in its group to determine which object the line should affect. In its final phase, the markup handler generates VRML from the sets of vertices that were generated during the adjust phase. The appearance of these objects is determined by color and texture markers.
4.3.2 4.3.1
Geometric Markup Handling
Handlers for geometric properties have four distinct phases:
Image-based Markup Handling
Color or texture sampler handlers sample the color or texture near the marker. Similarly, an image extractor handler
Extracted Rectangle Object
Match Transform None Rigid Similarity
Resultant Extracted Texture
Original Scene Image
Figure 7: Image extraction using extraction markers extracts parts of images contained within the rectangle defined by its markers. Colors, textures, or image regions are obtained from each image that contains these markers. For color, the associated object is given the mean of these color values. Texture samplers and image extractors sample the region from the image with the most head-on view of the region. Various methods for combining images to obtain a higher quality image could improve the extraction. We have not tried such methods yet, but we did use image processing to improve boundaries of extracted regions. It would be tedious to have to place image extractor markers to bound exactly the region to be extracted, and frames or nearby objects may make it difficult to place markers at desired locations. To simplify this process, a user may use markers to define a larger region containing the target region. Pantheia then uses the Probabilistic Hough Transform [3] to detect lines within the region bounded by the markers, and extracts the largest rectangle contained in this region. Figure 7 shows detected lines, the largest rectangle, and the resulting extracted image. In this way, a well-cropped texture for the bulletin board is accurately extracted without the need for careful placement of markers.
4.4
Render and view models
The final VRML model can be viewed in any VRML browser or in the 3D viewer we built using OpenSceneGraph [4], which is integrated with our system. The viewer can show marker placement during the estimation loop, can be moved to the virtual view of any source image, and can show that image in the scene, with an adjustable alpha value, so users can see it in alignment with the model.
5.
Angle error (deg) Max Avg. 5.06 2.22 4.44 1.56 4.43 1.56
Table 1: Evaluation summary: lab
Detected Lines Image Extractor Markers
Position Error (cm) Max Avg. 19.68 14.60 7.73 3.47 5.00 1.74
EXPERIMENTS
We used Pantheia to produce models of two rooms: our lab and our main conference room. These experiments are preliminary; our code and processes are still evolving. We collected images with a Canon Powershot SD900, a consumer grade camera, with focal length 7.7mm and 3648x2048 resolution, and calibrated it with the Matlab Calibration toolkit. To evaluate the accuracy of our current process, we measured the positions of the more permanent markers placed in both rooms and compared these measurements with our final estimates. These measurements are not used in the creation of our models; they are used only to evaluate the results. Our ‘ground truth’ measurements were accurate to within about 2 cm. We used the orientation of the wall as the orientation for the markers placed on the wall since we consistently placed the markers so that they were roughly
aligned with the wall edges. We did not take great care in this alignment, so some markers were noticeably askew. Thus the discrepancy between the ‘ground truth’ angles and the estimated angles is partially due to errors in the ‘ground truth.’ We did not worry about the inaccuracy in the ground truth angles, since even with this inaccuracy the errors were within a few degrees. Because a small inaccuracy in the pose of any fiducial marker used to initialize the algorithm can lead to significant rotation of the entire model, and only the overall geometry is of interest, not an exact match to world coordinates, we applied the optimal rigid transform to the entire set of points before making the comparisons. Also, our models tended to be a little larger than they should be, perhaps due to incorrect focal length calibration. For that reason we also applied the optimal global scale transformation. We hope to understand where this scale increase (of approximately 3%) is coming from so that we may remove it. Tables 2 and 1 summarize our evaluation results.
5.1
Constructing a virtual model of our lab
Our lab has width 5.2m, length 6.0m, and height 2.7m. Figure 1 shows a photo of the room and the model we constructed. The lab has wall regions of different colors, doors, posters, and equipment for which we had preexisting models. In addition to one fiducial marker, we placed 14 wall and scaffold markers, plus another dozen or so semantic markers including color samplers, texture, region, and model insertion markers. We took 26 pictures. Our qualitative success can be judged from Figure 1. Table 1 shows results from the quantitative evaluation on the 15 more permanent markers.
5.2
Constructing a model of a conference room
Our main conference room is almost rectangular except that the front wall has been replaced with three walls in a triptych configuration. Each of the two diagonal walls as well as the center front wall has a large display screen. The room has small columns along the side, doors, artwork, and a corporate poster. Figure 2 shows a photo of the room and the model we constructed. The conference room has width 7.3m, length 9.4m at its shortest, length 10.4m at its longest, and height 2.7m. We used one fiducial marker, 13 wall and scaffold markers, and a dozen or so semantic markers. We took 173 images. This experiment was run on an earlier version of our still evolving code. Table 1 shows quantitative evaluation results on the more permanent markers.
6.
DISCUSSION AND FUTURE WORK
Pantheia already provides a practical way to produce models, but we plan a number of improvements. A richer markup language, and improved pose estimation, will increase the breadth and accuracy of the models. Diagnostics and visualizations based on reprojection error and co-visibility graph
Match Transform None Rigid Similarity
Position Error (cm) Max Avg. 45.24 24.83 24.28 15.55 10.47 4.56
Angle error (deg) Max Avg. 2.75 1.34 2.24 1.04 2.23 1.04
[14]
Table 2: Evaluation summary: conference room [15] analysis will assist users in placing markers and collecting images. Using detected scene features, such as SIFT features, together with markers, would reduce or eliminate the need for scaffold markers, and generally improve Pantheia’s results. As mentioned in Section 4.2, we hope to incorporate geometric constraints into the bundle adjustment. We plan to evaluate this more complete system on more complex spaces, including multi-room environments.
7.
ACKNOWLEDGMENTS
The authors thank FXPAL for supporting this work. We also thank the creators of open source systems (Python, ARToolKit, ARToolKitPlus, SBA, OpenCV, Coin3D, OpenSceneGraph) upon which Pantheia builds.
8.
REFERENCES
[1] ARToolkit. http://www.hitl.washington.edu/artoolkit/. [2] ARToolkitPlus. http://studierstube.icg.tugraz.ac.at/handheld ar/artoolkitplus.php. [3] OpenCV. http://sourceforge.net/projects/opencvlibrary/. [4] OpenSceneGraph. http://OpenSceneGraph.org/. [5] A. Chella and et al. Modeling ontologies for robotic environments. In SEKE’02, pages 15–19, 2002. [6] J. Cosmas and et al. 3D Murale: A multimedia system for archaeology. In Proceedings of VAST 2001, pages 297–306, 2001. [7] F. Dellaert and et al. Structure from motion without correspondence. In CVPR’00. IEEE, 2000. [8] H. Durrant-Whyte and T. Bailey. Simultaneous localisation and mapping (slam): Part i the essential algorithms. Robotics and Automation Magazine, 13:99–110, 2006. [9] M. Fiala and C. Shu. 3D model creation using self-identifying markers and SIFT keypoint. In Proceedings HAVE’06, 2006. [10] D. S. G. Schall, J. Newman. Rapid and accurate deployment of fiducial markers for augmented reality. In Proceedings of the 10th Computer Vision Winter Workshop, 2005. [11] M. Lourakis and A. Argyros. sba: A generic sparse bundle adjustment C/C++ package based on the Levenberg-Marquardt algorithm. http://www.ics.forth.gr/ lourakis/sba/. [12] P. B. Madden and et al. Computer assisted mark-up and parameterization for scene analysis. US patent 6249285, 2001. [13] J. Newman, Fraundorger, G. Schall, and D. Schmalstieg. Construction and maintenance of augmented reality environments using a mixture of autonomous and manual surveying techniques. In
[16] [17]
[18]
[19]
[20]
Proc. 7th Conf. Optical 3-D Measurement Techniques, volume 1, 2005. W. Niem and J. Wingberm¨ uhle. Automatic reconstruction of 3D objects using a mobile monoscopic camera. In Proceedings of the International Conference on Recent Advances in 3-D Digital Imaging and Modeling, pages 173 – 180, 1997. N. Otsu. A threshold selection method from gray level histograms. IEEE Trans. Systems, Man and Cybernetics, 9:62–66, Mar. 1979. M. Pollefeys. Visual 3D modeling from images. http://www.cs.unc.edu/ marc/tutorial. M. Pollefeys and L. V. Gool. Visual modeling: from images to images. Journal of Visualization and Computer Animation, 13:199–209, 2002. J. Rekimoto and Y. Ayatsuka. Cybercode: Designing augmented reality environments with visual tags. In Proceedings of DARE, pages 1 – 10, 2000. M. Rohs and B. Gfeller. Using camera-equipped mobile phones for interacting with real-world objects. In Advances in Pervasive Computing, pages 265 – 271, 2004. B. Triggs and et al. Bundle adjustment – a modern synthesis. In Vision Algorithms: Theory and Practice, LNCS, volume 1883, pages 298–375. Springer Verlag, 2000.