Proceedings
Measurement transducer impulse response using an exponential Sine Sweep method † Jorge Otero 1,* and Ivan Felis 2 Universitat Politècnica de València (UPV); 46730 Gandia, València, Spain. Centro Tecnológico Naval y del Mar (CTN); 30320 Fuente Á lamo, Murcia, Spain. * Correspondence:
[email protected]; Tel.: +34-963-877-000 (ext. 43681) † Presented at the 5th International Electronic Conference on Sensors and Applications, 15–30 November 2018; Available online: http://sciforum.net/conference/ecsa-5 1 2
Received: 15/11/2018; Accepted: date; Published: date
Abstract: The impulse response of a piezoelectric transducer can be calculated using the electrical equivalent circuit model with the Manson method for a bandwidth in far field. Nevertheless, these approaches are not sufficiently precise because the importance of homogeneous structure medium where the transducer emit the signal in part determine the bandwidth in which it acts due to the interactions of this with the environment. This paper describes preliminary research results on piezoelectric impulse response measurement in small space, making use of the procedure presented by Angelo Farina for transducers emitting in reverberant spaces. Combination the Basics of Exponential Sine Sweep (ESS) method, techniques of arrival detection and signal processing it is possible to obtain the impulse response in piezoelectric transducer emitting in a homogeneous medium. Keywords: Impulse response; piezoelectric ceramics; Sine Sweep; medical applications
1. Introduction The impulse method, which is based on recording measuring signal, can be used to obtaining transfer function of common electroacoustic systems and their impedance [1]. Also, physical phenomena occurring in the ultrasonic transducers can be observed and diagnosed in detail when the impulse method in association with digital processing of the signal. There are different methods of transducer impulse measurement with different sorts of signals. One of these methods with sweep sinus requires an anechoic chamber in order to delete the influence of the room and get a good signalto-noise ratio. On the other hand, using a quasi-anechoic chamber give the possibility of the measurement in a small room [2]. One of the most use methods is through MSL (maximum length sequence) signal. The possibility to create the sequence by hardware alleviated from memory constraints. As the case “all zeros” is excluded from the sequence, the length of an MLS 2𝑁 − 1 [3]. As a result, measurements could be made in some different size rooms. As an advantage, the MLS signal make them suited for transfer function measurements. Their auto-correlation comes close to a Dirac pulse, indicating a white spectrum. Repeated periodically as a pulse train, all frequency components have indeed exactly the same amplitude, meaning of their spectrum is perfectly white [3]. In this paper, the method proposed by A. Farina to get the impulse response in rooms is implemented in electromechanical transducers and an ultrasonic transducer through exponential sweeps. For several reasons, sweeps are a far better choice for transfer-function measurements than noise sequences. First, in contrast to the latter, the spectrum of a non-repeated single sweep is almost identical to that of its periodic repetition. This means that is not necessary to emit the excitation signal Proceedings 2018, 2, x; doi: FOR PEER REVIEW
www.mdpi.com/journal/proceedings
Proceedings 2018, 2, x FOR PEER REVIEW
2 of 6
twice to establish the expected spectrum, for this reason, the sweep must be sent out only once and the response can be captured and processed immediately. 2. Material and Methods 2.1. Measurement process. In order to test the method in twice sorts of transducers, an anechoic chamber was used to reduce the number of reflections in the walls, floor, and cell in the case of electromechanical loudspeaker transducer. In the second case with piezoelectric ceramic PZT a sweep sinus was emitted in a water medium. In both cases, to avoid reflections from surfaces the signal has been cut before the first reflection can be recorded according to the size of each room. Also, in both cases, the same method to obtain the impulse response was used. The signal emitted depends on the frequency response of the transducer evaluated whereby an exponential sine sweep is generated in a width band suitable [4].
𝑥(𝑡) = 𝑠𝑖𝑛 [
1 𝑓 2𝜋𝑓1 ln( 2 ) ∙ (𝑒 𝑇 𝑓1 − 1)] 𝑓 ln ( 2 ) 𝑓1
(1)
Where 𝒇𝟏 and 𝒇𝟐 are the initial and end frequencies of the signal respectively and 𝑻 represent the time. In order to get the deconvolution of the IR it is necessary inverse the signal emitted. Figure 1 shows a general scheme of the process.
Figure 1. Scheme of the impulse response measurement method.
Once the signal has been emitted by the device under test (DUT) and record in digital system acquisition (DAQ), the spectrums of the record signal and the inverse signal emitted are multiplied to get the impulse response. However, pre-riding at low frequency due to bad sound car system featuring frequency-dependent latency in the case of electromechanical loudspeaker transducer produce a bad resolution in low frequency. This effect can be corrected if the frequency-dependent latency remains the same, by creating a suitable inverse filter with the Kirkeby method (KIF) [4]. First the signal IR to be inverted is FFT transformed to frequency domain. 𝐶𝑜𝑛𝑗[𝐻(𝑓)]
𝐻(𝑓) = 𝐹𝐹𝑇[ℎ(𝑓)] → 𝐶(𝑓) 𝐶𝑜𝑛𝑗[𝐻(𝑓)]∙𝐻(𝑓)+𝜀(𝑓) → 𝑐(𝑡) = 𝐼𝐹𝐹𝑇[𝐶(𝑓)]
(2)
The filter is gets in the frequency domain as a conjugated operation where 𝜺(𝒇) is a small, frequency-dependent regularization parameter. Finally, an IFFT brings back the inverse filter to time domain.
Proceedings 2018, 2, x FOR PEER REVIEW
3 of 6
2.2. Electromechanical transducer measurement. A sweep sinus measurement with a single microphone was performed. A loudspeaker Genelec 8010A was set up over a flat surface separated from floor 1.6 meters. A receiver is a Behringer ECM 8000 microphone separated 1 meter of the source. The shame can be seen in figure 2. The signal from the from source doesn't have reflections are null due to the anechoic chamber.
.
(a)
(b)
(c)
Figure 2. Set up of the impulse measurement. (a) System calibration with white noise; (b) the transducer and receiver are in the middle of the anechoic chamber; (a) and the microphone is on the axis of the loudspeaker.
To emit and record the signal a laptop with Adobe audition was prepared with the signal generated from 20ℎ𝑧 to 20𝑘𝐻𝑧 on a M-Audio sound card with 48000 𝑘𝑠⁄𝑠 . First the signal was calibrated to 91𝑑𝐵 with white noise as shown figure 2a, then the process of emit and record was repeated three times at the same length. Figure 3 shown the signal emitted, the signal record.
Figure 3. Exponential sweep from 20ℎ𝑧 to 20𝑘𝐻𝑧 emitted and record
The instantaneous sweep power should be controllable according to the frequency just being swept through. This can be accomplished by controlling the amplitude of the sweep in a frequency-
Proceedings 2018, 2, x FOR PEER REVIEW
4 of 6
dependent fashion, it is important because the signal could saturate the system causing a non-linear operation on the membrane in its natural-resonance frequency. 2.3. Underwater transducer measurement. In order to evaluate the method, the process of impulse measurement was assessed in two RESON TC4034 transducers. The experimental environment is a water tank with a water volume of 0.64 m3. Both similar sensors are separated 30cm each other and a national instrument DAQ acquisition system was used with a sample rate of 10 𝑀𝑠⁄𝑠. Figure 4 shows the set-up of the experiment with both sensors.
30cm
Figure 4. Set up of the impulse measurement. The.
Due to characteristic of the experimental space, the exponential sweep signal emitted has a duration of 200us. This sweep was recorded for 500us and in order to suppress all reflections a time window of 210us was used to extricate the direct signal from the file before the first scatter appear and delete the electromagnetic signal from the electric components. Figure 5 shows the characteristics of the emitted signal, and the maximum amplitude of the received signal where the resonance frequency overlap.
Figure 5. Exponential sweep from 20ℎ𝑧 to 20𝑘𝐻𝑧 emitted and record
Proceedings 2018, 2, x FOR PEER REVIEW
5 of 6
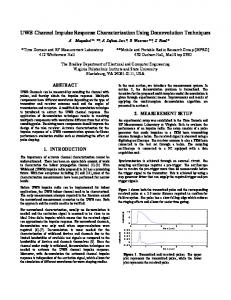
The general idea of suppressing the first reflection with the sensor is to get the main signal from the transducer to the receiver on the axis direction. To do that the cross-correlation method gives information about the time of arrival (TOA) [5], whereby there is the possibility to set the best fit to obtain only the direct signal and the time of the window to process the signal. 3. Results and Conclusions Impulse measurement of a mechanical and ultrasound transducer can be got with the method described in this paper. This made it possible to derive a general procedure for calculating these responses, which can be used for different transducer. Figure 6 shows que impulse response for loudspeaker transducer and ultrasound transducer respectively. With the exponential sweep technique, is possible to simultaneously deconvolve the linear impulse response of the system and selectively separate each impulse response corresponding to the harmonic distortion orders considered. With this information, it is possible to determine, for example, the kind of signals should be sent to each transducer when the signal expected is known.
(b)
(a)
Figure 6. Impulse response of two systems analysed. (a) IR of the loudspeaker in an anechoic environment; (b) Impulse response of underwater sensor in a reverberant environment.
The impulse response deconvolution process is realized by lineal convolution of the measured output with the analytical inverse filter processed form the excitation signal. Using lineal convolution allows time-aliasing problems to be avoided [6]. In fact, even if the time analysis window has the same length as the emitted signal, the tail of the system response may be lost, but this will not introduce time aliasing. Experimental with piezoelectric transducer shows that it is possible to suppress reflection from given surface of the experiment and obtain good results spite of the increase of the noise. In order to perform an objective comparison of the impulse response qualities, the optimal signal-to-noise ratios achievable for each transducer have been compared. The signal-to noise ratio definition used is the ratio expressed in dB between the average power of the signal recorded by the microphone and the average power of the noise present in the impulse response. In the case of the chamber room, the signal obviously has a better relation if it is compared with the reverberant environment into the water tank. This assertion is confirmed by the results presented in table 1. Table 1. Signal to noise ratio of the two different environments.
Signal-to-noise ratio
Loudspeaker
Ultrasound transmitter
51.2 dB
45.1 dB
The good relationship of the signal-to-noise of the exponential sweep method make it a notable impulse response measurement technique in a lot of environments provided the signal-to-noise ratio were enough to reduce que distortion in the IR and the time window had been appropriately implement.
Proceedings 2018, 2, x FOR PEER REVIEW
6 of 6
Conflicts of Interest: The authors declare no conflict of interest. References
[1] F. Kadlec, “Impulse response measurement of ultrasonic transducers,” Journal de Physique IV Colloque, vol. 4, pp. 295 - 298, 1994. [2] C. J. Struck and S. F. Temme, “A Comparison of Techniques for Evaluation of Loudspeakers at Low Frequencies,” in Audio Engineering Society 95th Convention, New York, 1993. [3] S. Muller, “Transfer-Function Measurement with Sweeps,” Journal of the AES, vol. 49, no. 6, pp. 443 - 417, 2001. [4] A. Farina, “Advancements in impulse response measurements by sine sweep,” in 112nd AES convention, Vienna, Austria, 2007. [5] F. G. and F. G. , “positioning using time-difference of arrival measurements,” in IEEE International Conference on Acoutics, Speech, and Signal Processing , Hong Kong, China, 2003. [6] S. Guy-Bart, E. Jean-Jacques and A. Dominique, “Comparison of Different Impulse Response Measurement Techniques,” Journal of AES, vol. 50, no. 4, pp. 249 - 262, 2002.
© 2018 by the authors. Submitted for possible open access publication under the terms and conditions of the Creative Commons Attribution (CC BY) license (http://creativecommons.org/licenses/by/4.0/).