Organizational Research Methods OnlineFirst, published on April 29, 2010 as doi:10.1177/1094428110366036
Method Variance and Marker Variables: A Review and Comprehensive CFA Marker Technique
Organizational Research Methods 000(00) 1-38 ª The Author(s) 2010 Reprints and permission: sagepub.com/journalsPermissions.nav DOI: 10.1177/1094428110366036 http://orm.sagepub.com
Larry J. Williams1, Nathan Hartman2, and Flavia Cavazotte3
Abstract Lindell and Whitney introduced a partial correlation technique, now referred to as the correlational marker technique, for controlling method variance using a marker variable that is theoretically unrelated to substantive variables in a study. This article (a) first reviews their specific analysis plan, and then (b) reviews empirical studies that have followed all or part of this plan. The authors also (c) describe a structural equation method that has been applied to the analysis of marker variables and (d) review empirical studies using this analytical approach. Next, the authors (e) develop a comprehensive confirmatory factor analysis (CFA) marker technique analysis plan, and (f) demonstrate this plan with an empirical example. Finally, the authors (g) describe how marker variables can be examined along with other method variance processes, (h) discuss the important role of theory in the critical step of selecting marker variables, and (i) discuss assumptions and limitations of the Comprehensive CFA Marker Technique. Keywords method variance, quantitative research, quantitative: structural equation modeling, construct validation procedures, reliability and validity Organizational researchers have had a long-standing interest in problems associated with the use of employee self-reports that describe variables such as emotions, personality styles, attitudes, and perceptions of work environments. A main reason for this interest is the concern that empirical estimates of relationships among variables such as those mentioned above might be contaminated by shared variance associated with the use of self-reports as a measurement method. As discussed by Podsakoff and Organ (1986), this shared method variance can be due to respondent’s consistency
1
Center for the Advancement of Research Methods and Analysis, Wayne State University, Detroit, MI, USA Department of Management, John Carroll University, OH, USA 3 Faculdades IBMEC–Rio de Janeiro, RJ, Brazil 2
Corresponding Author: Larry J. Williams, Center for the Advancement of Research Methods and Analysis, Wayne State University, 5201 Cass, Detroit, MI 48202, USA Email:
[email protected]
1 Downloaded from orm.sagepub.com at Tbilisi State University on August 2, 2016
2
Organizational Research Methods 000(00)
motifs, transient mood states, illusory correlations, item similarity, and social desirability. Over the years, this interest in method variance has led researchers to investigate how much method variance is present in various types of organizational and psychological data, the causes of this method variance, and strategies for controlling method variance (see summaries of this literature in Chan, 2009; Conway, 2002; Podsakoff, MacKenzie, Lee, & Podsakoff, 2003; Richardson, Simmering, & Sturman, 2009; Spector, 2006; L.J. Williams, Ford, & Nguyen, 2002). In this latter category, one stream of literature addresses data analysis techniques that can be used to control for method variance problems (in contrast to techniques related to research design or data collection). For example, Ganster, Hennessey, and Luthans (1983) developed statistical models for testing method effects due to social desirability that used multiple regression and partial correlations. Alternatively, Podsakoff and Todor (1985) and Kemery and Dunlap (1986) have discussed the use of factor analysis for removing method variance. More recently, Burke, Brief, and George (1993) used a partial correlation approach to investigate method effects due to negative affectivity. Finally, L.J. Williams et al. (2002) as well as Podsakoff et al. (2003) have reviewed confirmatory factor analysis (CFA) approaches to a wide range of method variance problems. In addition, in this category of statistical techniques for controlling method variance, Lindell and Whitney (2001) provided a partial correlation technique that has been labeled the correlational marker technique (Richardson et al., 2009) and it has received considerable attention among organizational researchers. Lindell and Whitney focused on questionnaire data sets that include a marker variable, which they defined as a variable that is theoretically unrelated to substantive variables and for which its expected correlation with these substantive variables is 0. Such a variable has more recently been defined as an ideal marker variable (Richardson et al., 2009), and research to be discussed has indicated that the distinction between ideal and nonideal marker variables is important. Lindell and Whitney demonstrated the application of a partial correlation technique in these situations, in which a researcher uses a chosen nonzero correlation between a marker variable and a substantive variable as an estimate of the amount of method variance, and then corrects all correlations among substantive variables using a partial correlation adjustment. Lindell and Whitney also demonstrated how to adjust for measurement error in their approach. Finally, they also advocated that researchers include a sensitivity analysis as a way of acknowledging that the estimate of method variance provided by correlations involving marker variables is subject to sampling error. This article will review organizational research using marker variables that has been published subsequent to Lindell and Whitney (2001), with the goals of providing guidance for selecting marker variables and developing an analytical approach that overcomes the limitations of partial correlations. Toward this end, we (a) first review the specific correlational marker technique analysis plan using partial correlations with manifest variables developed by Lindell and Whitney and then (b) review empirical studies from organizational research that have followed all or part of this plan. We also (c) describe a structural equation method with latent variables that has been applied to the analysis of marker variables and (d) review empirical studies using this newer analytical approach. Next, we (e) develop a Comprehensive CFA Marker Technique analysis plan aimed at increasing knowledge of marker variable and associated method variance effects and (f) demonstrate this plan with an empirical example. Finally, we (g) describe how marker variables can be examined along with other method variance processes, (h) discuss the important role of theory in the critical step of selecting marker variables, and (i) discuss assumptions and limitations of the Comprehensive CFA Marker Technique, which are absolutely critical if the technique is to be successful at identifying and controlling for any sources of common method variance (CMV). Before proceeding with these objectives, we emphasize that this proposed technique is not a panacea for CMV and favorable results with it do not unequivocally guarantee that CMV is not a problem. There will always potentially be other sources of CMV beyond that associated with the marker variables used that remain unaccounted for. 2 Downloaded from orm.sagepub.com at Tbilisi State University on August 2, 2016
Williams et al.
3
Analysis of Marker Variables With Partial Correlations In developing the correlational marker technique, Lindell and Whitney (2001) included five steps that are based on what they referred to as the CMV model, which proposes that a researcher’s substantive variables are contaminated by a single unmeasured factor that has an equal effect on all of the variables. The CMV model is contrasted with the unrestricted method variance (UMV) model, which does not assume an equal effect due to the unmeasured factor. It should be noted that Richardson et al. (2009) recently referred to the CMV model as the Noncongeneric CMV model and the UMV model as the Congeneric CMV model. Assuming the CMV model, Lindell and Whitney presented the rationale for why a squared correlation between a marker variable and a substantive variable can be used to obtain an estimate of method variance, and they discussed which such correlation among many that might be available in a data set should be selected to obtain the estimate. In terms of their five steps, they recommended (a) choosing the smallest of the various correlations between the marker variable and substantive variables. Once this estimate is obtained, the correlational marker technique requires that (b) it be incorporated into the formula for a partial correlation, through which the correlation value reflecting method variance is subtracted from a zero-order relation among two substantive variables in the numerator and subtracted from the value of 1.0 in the denominator. Once the resulting partial correlation is obtained, the focus is on (c) whether partialling out method variance in this fashion reduces the original correlation among substantive variables to statistical nonsignificance. Lindell and Whitney (2001) also noted that random measurement error would attenuate all the correlations involved in the calculations required for the partial correlation approach. Thus, the results of their partial correlation analysis would be biased by the measurement error and this measurement error would typically result in an underestimation of the impact of CMV. Therefore, they recommended (d) computing the partial correlations using zero-order correlations corrected for attenuation, with the corrections based on sample estimates of the reliabilities of the involved variables. Although Lindell and Whitney discussed the use of a t test to examine the significance of the partial correlation controlling for the marker variable, they were unable to discuss a significance test of the partial correlation corrected for measurement error because one does not exist. Finally, another significant feature of the correlational marker technique as presented by Lindell and Whitney (2001) is referred to as (e) a sensitivity analysis. The recommendation for this analysis was primarily motivated by the recognition that the estimate of method variance associated with the marker variable is subject to sampling error. The approach recommended to deal with this concern begins by computing the point estimate of the marker correlation at the upper and lower bound of its 95% and 99% confidence interval as the estimate of marker-based method variance. Next, these values are used to compute additional partial correlations and test for the impact of marker variable-based method variance. If any of these additional partial correlations remain significant, further support is obtained for the conclusion that predictor–criterion correlations cannot be accounted for by method variance associated with the marker variable. Lindell and Whitney suggested that this use of a more stringent criterion (using estimates of method variance higher than the actual amount indicated by the sample data) allows for greater confidence in rejecting CMV as a rival hypothesis when all the partial correlations remain significant. Before proceeding, we return to the underlying assumption of the correlational marker technique that deserves attention, the assumption of the CMV model as compared to the assumption of the UMV model. As noted earlier, the Noncongeneric CMV model assumes that a researcher’s variables are contaminated by a single unmeasured factor that has an equal effect on all of the variables. This assumption is required to obtain the estimate of method variance as a squared correlation involving the marker variable, and Lindell and Whitney noted that the accuracy of their partial correlation corrections depends on the validity of the assumption that the method variable has an equal impact on 3 Downloaded from orm.sagepub.com at Tbilisi State University on August 2, 2016
4
Organizational Research Methods 000(00)
all observed variables. However, results from organizational research challenges this assumption, and the Congeneric CMV (UMV) model may be more realistic in that there is evidence that different types of variables contain differing amounts of method variance. In terms of existing data, Podsakoff et al. (2003) summarize literature that found that job performance measures contain about 22% method variance, personality and aptitude measures about 25%, whereas attitude measures contain 40%. Additionally, we will suggest in a later section that different marker variables may reflect differing types of method bias, and as a result may be differentially related to substantive variables based on the type of bias and the nature or domain of the substantive variable. In short, there are several reasons to believe that the assumption of the Noncongeneric CMV model may not match most organizational research settings, indicating the need for an analytical technique that can incorporate the assumptions of unequal method effects associated with the Congeneric CMV model. We add that this assumption is a key reason that the correlational marker technique is not a good substitute for more advanced techniques to be discussed when the more likely Congeneric CMV model provides a more accurate representation of the data than the Noncongeneric CMV (UMV) model, and in these situations, the partial correlation results cannot be trusted.
Review of Empirical Research Using Correlations and Marker Variables Since the publication of Lindell and Whitney (2001), many self-report cross-sectional studies have used a wide range of marker variables and analytical techniques to assess and/or account for CMV. A summary of 21 studies related to the field of organizational behavior, which incorporated some aspect of the correlational marker technique developed by Lindell and Whitney (2001) is presented in Table 1 (references are provided in the appendix). We note these studies used a manifest variable design and did not include analyses with latent variables. Our review of these studies indicates the wide variety of types of marker variables and measures as well as associated analyses. In terms of the types of variables used as marker variables in these studies, some were traditional organizational behavior variables such as helping (Arnold & Spell, 2006), commitment (Irving & Coleman, 2003; Irving, Coleman, & Bobocel, 2005), job satisfaction (Shipton, Armstrong, West, & Dawson, 2008), and leadership (Zhu, Chew, & Spangler, 2005). Other researchers used demographic variables including age (Griffith & Lusch, 2007), tenure (Krishnan, Martin, & Noorderhaven, 2006), and education (Rindfleisch, Burroughs, & Wong, 2009). Finally, in a few instances, the specific variable used was not described (Becker, Greve, & Albers, 2009; Brews & Tucci, 2004; Byrne & LeMay, 2006). Across these studies, it appears that about half of them noted whether they assumed that the marker variable was theoretically unrelated to their substantive variables, a key requirement of the Correlated Marker Technique. As for the types of measures of these marker variables, several were multi-item Likert-type scales (Grayson, 2007; Irving & Coleman, 2003; Irving et al., 2005; Luthans, Zhu, & Avolio, 2006; Oreg, 2006; Shipton et al., 2008; Zhu et al., 2005). Other studies included single-item Likert-type items (Arnold & Spell, 2006; Johnson & Hall, 2005; Waldman, Javidan, & Varella, 2004). Objective items were also used (Arvey, Rotundo, Johnson, Zhang, & McGue, 2006; Booth, Park, & Glomb, 2009; Griffith & Lusch, 2007; Krishnan et al., 2006; Rindfleisch et al., 2009). Finally, across the studies, about half selected their marker variables a priori and the remaining selected them post hoc. Regarding the analyses used in these studies, in several instances, researchers that included marker variables did not actually follow any of the steps of the correlational marker technique (Griffith & Lusch, 2007; Irving & Coleman, 2003; Irving et al., 2005; Kavanaugh, Benson, & Brown, 2007; Luthans, Zhu, & Avolio, 2006; Zhu et al., 2005). In one study, only the first three steps of the Correlational Technique were followed (Arvey et al., 2006), whereas in others the first four steps were implemented (Arnold & Spell, 2006; Begley, Lee, & Hui, 2006; Booth et al., 2009; Brews & Tucci, 2004; Byrne & LeMay, 2006; Grayson, 2007; Johnson & Hall, 4 Downloaded from orm.sagepub.com at Tbilisi State University on August 2, 2016
Downloaded from orm.sagepub.com at Tbilisi State University on August 2, 2016
5
Substantive Variables
Benefits satisfaction, procedural justice, positive and negative inequity; and organizational culture Arvey, Rotundo, Age, occupation, education, Johnson, Zhang, & leadership role occupancy, and personality measures McGue, 2006 Becker, Greve, & Initiation performance, maintenance Albers, 2009 performance, retention performance, organizational implementation, technological implementation, management support, employee support, customer heterogeneity, and industry Begley, Lee, & Procedural & distributive justice, Hui, 2006 organizational level, affective commitment, organizational trust, intent to quit, and organizational citizenship behaviors Booth, Park, & Time-oriented ESV benefits, Glomb, 2009 financial- and logistic-oriented ESV benefits, volunteer hours, skills acquired from volunteering, employer’s recognition, and perception of job success Brews & Tucci, Internetworking depth, business 2004 specialization/scope, hierarchy reduction, external partnering, internetworking duration, firm size, overall firm performance, internetworking operational performance, firm location, and firm global research
Arnold & Spell, 2006
Study
Not discussed
OI
Not discussed
Financial giving*
Not provided
Large city*
Modernity
OI
Helped other employees*
Not discussed
LSI
Marker Variable Namea
Not provided
Marker Variable Type of Measureb
Table 1. Selected Information From Studies Using Correlations With Marker Variables
1–4
Not 1–4 discussed
Post hoc 1–4
A priori
(continued)
After correcting for potential correlation inflation from CMV the main effects held up at the same level of statistical significance
All significant correlations remained significant after the partial correlation adjustment
Both partial and disattenuated correlations remained significant
All significant correlations remained significant after the partial correlation adjustment Post hoc 1–3 Estimated correlations did not significantly change after adjustment Not Not Minor correlation variations discussed discussed occurred when they were corrected for CMV
Post hoc 1–4
Marker Steps Conclusion About Common Selection Followedc Method Variance (CMV)
6
Downloaded from orm.sagepub.com at Tbilisi State University on August 2, 2016
Satisfaction with information, satisfaction with communication medium, quality of information, trust in top management, and urgent news Friendship with Upline sponsor, friendships with direct and indirect Downline, preexisting relationship, instrumentality (amount of training), business outcomes, perceived value of company, and products Perceived governance structure for protecting capital, organizational commitment, organizational trust, satisfaction, intention to turnover, and accumulated transferable capital Role ambiguity, job tension, and affective and continuance commitment
Byrne & LeMay, 2006
OI
LMI
LMI
LSI
Affective and continuance commitment
Affective and continuance Irving, Coleman, & Negative affectivity, procedural Bobocel, 2005 justice, and job satisfaction (Study 1 commitment* & 2)
Employees receive safety Subjective norms, attitude, perceived behavior control, intent orientation* to lift safely, and safe lifting behavior
Johnson & Hall, 2005
Irving & Coleman, 2003
Griffith & Lusch, 2007
Age*
Not discussed
LMI
Not provided
Marker Variable Namea
Marker Variable Type of Measureb
Success with traditional advertising*
Grayson, 2007
Substantive Variables
Study
Table 1 (continued)
A priori
A priori
A priori
1–4
0
0
Post hoc 0
Post hoc 1–4
Not 1–4 discussed
(continued)
The marker variable was not significantly related to any of the variables in the model, thus suggesting that CMV is not a serious problem Predicted nonsignificant correlation was supported and several near-zero correlations provided evidence that CMV was not a significant problem Predicted nonsignificant correlation was supported and several near-zero correlations provided evidence CMV was not a significant problem The partial correlation coefficients for all variables remained statistically significant while controlling for the marker variable
Some of the correlations (5 of 19) between the three dependent variables and independent variables could be accounted for by CMV Two of the 40 significant correlations became nonsignificant; suggested CMV was unlikely to affect a majority of the results
Marker Steps Conclusion About Common Selection Followedc Method Variance (CMV)
Downloaded from orm.sagepub.com at Tbilisi State University on August 2, 2016
7
Substantive Variables
Oreg, 2006
Marker Variable Type of Measureb
LMI
Tolerance for ambiguity*
LMI
OI
Tenure*
Financial referent when Not determining satisfaction with pay discussed
Marker Variable Namea
Physical development value Change attitude, resistance to change, perceived outcomes to the change, trust in management and social influence, information about change, job satisfaction, intent to quit, and continuance commitment
Performance appraisal fairness, role Kavanagh, Benson, & Brown, conflict, role overload, resource inadequacy, work overload, 2007 performance rating, two-way communications, involvement, supervisor neutrality, process clarity, process understanding, and process acceptance Krishnan, Martin, Alliance performance, position of & Noorderhaven, respondent, investment size, cultural distance, local partner size, 2006 equity alliance, alliance duration, quality of information exchanged, interdependence, interpartner competition, environmental stability, environmental unpredictability, and trust Luthans, Zhu, & Self-efficacy, job satisfaction, Avolio, 2006 turnover intentions, and organizational commitment
Study
Table 1 (continued)
A priori
A priori
All significant correlations remained significant after the partial correlation adjustment
Nonsignificant correlation with dependent and marker variable suggested CMV was not a problem
(continued)
The marker variable was regressed on the various independent, mediating, and dependent variables; results indicated CMV was not an issue Not After controlling for CMV in this discussed study, all of the significant correlations between predictor and criterion variables remained significant, thus increasing confidence in the validity of the study’s conclusions
0
Post hoc 1–4
Post hoc 0
Marker Steps Conclusion About Common Selection Followedc Method Variance (CMV)
8
Downloaded from orm.sagepub.com at Tbilisi State University on August 2, 2016
Substantive Variables
Human-capital enhancing human resource management (HRM), transformational leadership, and organizational performance
Post hoc 0
1–4
Transactional leadership
LMI
All significant correlations remained significant after the partial correlation adjustment
Correlations remained significant after adjustment; the sensitivity analysis of the correlation between the marker variable and the subject variables indicated some sampling error effects might be present In hierarchical regression analysis, the marker was not significantly related to the dependent variable, which was used as evidence CMV was not a problem
All the significant correlations remained significant after the adjustment
Not Not discussed discussed
Post hoc 1–5
A priori
A priori
Not 1–4 discussed
Marker Steps Conclusion About Common Selection Followedc Method Variance (CMV)
Extent to which managers in the LSI surveyed firms perceived that their suppliers were becoming more unpredictable*
Not discussed
Tuition reimbursement*
Highest level of education*
LMI
OI
Marker Variable Namea
Employee job satisfaction
Marker Variable Type of Measureb
b
Marker variables with an asterisk were stated as theoretically unrelated to substantive variables by the authors. LMI ¼ Likert Multi-Item Scale; LSI ¼ single-item Likert, OI ¼ objective item, CHI ¼ Commission for Health Improvement Star Ratings, CGR ¼ Clinical Governance Review Rating. c Based on Lindell and Whitney’s (2001) 5-step process.
a
Zhu, Chew, & Spangler, 2005
Rindfleisch, Burroughs, & Wong, 2009
Materialism, personal insecurity, social insecurity, developmental insecurity, existential insecurity, brand loyalty, self-brand connection, social desirability response, age, and gender Leadership effectiveness, care Shipton, Armstrong, West, quality climate, complaints per 1,000 & Dawson, 2008 patients, CHI star rating, and CGR rating Spell & Arnold, Job control, distributive justice, 2007 procedural justice, interpersonal justice, organizational structure, anxiety, and depression Waldman, Javidan, Country, total assets, CEO tenure, & Varella, 2004 strategic change, CEO charisma, CEO intellectual stimulation, environmental uncertainty, newt profit margin, return on equity, and sales growth
Study
Table 1 (continued)
Williams et al.
9
c X1
c c
X2
Sublv1 e
a
e
c
X3
c
c
c c
Sublv2
b
e b
Markerlv
X4
e d
X5
d
X6
d
d
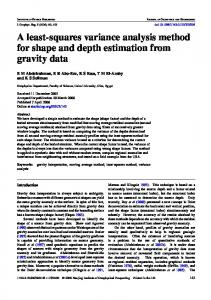
Figure 1. Example latent variable marker variable model
2005; Krishnan et al., 2006; Rindfleisch et al., 2009; Spell & Arnold, 2007). In only one study were all five recommended steps of the Correlated Marker Technique followed (Waldman et al., 2004). As a general conclusion, across the studies, marker variable-based method variance was not seen as problematic. Estimated correlations did not change much as a result of partialling marker variance and statistical significance was generally retained. However, given some of the shortcomings in the selection and measurement of marker variables, the likely mistaken assumption of Noncongeneric CMV effects, the lack of attention apparently paid to the assumption that the chosen marker variable be uncorrelated with substantive variables and the failure to follow all of the recommended steps of analyses, the conclusions about lack of presence and bias of marker variables should be viewed cautiously.
A Latent Variable Approach to Marker Variables Given the increasing use of structural equation modeling (SEM) with latent variables in organizational research and the use of this analytical approach in other areas of method variance research (Podsakoff et al., 2003; L.J. Williams et al., 2002), it should not be surprising that some authors have used SEM to investigate marker variables. Such an approach was originally presented by L. Williams, Hartman, and Cavazotte (2003) and has been recently investigated by Richardson et al. (2009), who gave it the label of the CFA Marker Technique. As it turns out, both the CMV and UMV models discussed by Lindell and Whitney can be analyzed with structural equation techniques using model comparisons with variants of key parameters, and we will argue such an approach has other advantages as well. Before reviewing articles using SEM with marker variables, we provide a simple example model to facilitate discussion of the articles. The general model shown in Figure 1 can be used to describe the types of models necessary for using the CFA Marker Technique to explore the CMV and UMV models. 9 Downloaded from orm.sagepub.com at Tbilisi State University on August 2, 2016
10
Organizational Research Methods 000(00)
This general model has two latent variables of substantive interest (Sublv1 and Sublv2) and one latent variable associated with the marker variable (Markerlv). This general model allows for a correlation between the two latent variables (a) and for two correlations between the marker latent variable and the two substantive latent variables (b). This model also shows that the two substantive and the single marker latent variables are each measured with two indicators. We note that empirical applications of the latent variable approach should use at least three indicators for latent variables and we limit ourselves to two with this example to ease its presentation. This model requires four factor loadings and four error variances (c) associated with the X1-X4 indicators, and two factor loadings and two error variances (d) associated with the indicators of the marker latent variable (X5, X6). In addition, the model shows how the marker latent variable can be linked with the substantive indicators via four method factor loadings (e) to represent the method variance effects associated with the marker variable. Finally, note that in the articles to be discussed in the next section, the correlations (b) between the marker latent variable and all substantive latent variables are set to 0 to achieve model identification (it is not possible to obtain unique estimates of these two factor correlations and the method factor loadings), and we note this assumption is more restrictive than that of the correlational marker technique and it matches the definition of an ideal marker variable by Richardson et al. (2009). In addition, in some studies, the factor correlation (a) is replaced with a structural or regression-like parameter when researchers are examining a broader theoretical model with multiple exogenous and endogenous variables.
Review of Empirical Research Using Latent Variables and Marker Variables Review of Studies Using SEM With Marker Variables We identified 15 published articles in the organizational behavior literature that have included marker variables and that also used confirmatory factor or structural equation methods to test substantive hypotheses, and information from these studies is presented in Table 2 (references are provided in the appendix). We first focus on three studies that included one or more marker variables and provided adequate detail on their analyses to fully understand their results. Rafferty and Griffin (2004) examined a model linking five dimensions of transformational leadership with five outcomes, including affective and continuance commitment, role breadth self-efficacy, interpersonal helping behavior, and turnover intentions. The variable bureaucracy, reflecting an emphasis on rules and red tape within an organization, was used as the marker variable. To describe their analyses, reference will be made to the general model shown in Figure 1, noting that the factor correlation (a) is replaced with a series of structural parameters linking the five leadership dimensions to the four outcome variables, and also noting that the factor correlations (b) linking the bureaucracy marker variable with the nine substantive constructs are assumed to be 0 to achieve identification. Rafferty and Griffin (2004) first tested for the presence of marker variable method effects by comparing two structural models that differed in their patterns of factor loadings associated with the marker latent variable. A first model allowed the factor loadings represented by (c), (d), and (e) in Figure 1 to be estimated, and a second model forced to 0 all of the factor loadings linking the marker latent variable to substantive indicators (e). A comparison of these two models using a chi-square difference test obtained significant results, supporting the claim that significant method effects were present. In a second part of their analyses, Rafferty and Griffin examined whether the marker latent variable had an equally strong influence on each indicator of the nine substantive constructs by examining a model with appropriate equality constraints on the method factor loadings. Their model comparison showed that method effects were not equal for indicators of the substantive constructs. Finally, in a third step of their analyses, Rafferty and Griffin assessed the bias due to the marker 10 Downloaded from orm.sagepub.com at Tbilisi State University on August 2, 2016
Downloaded from orm.sagepub.com at Tbilisi State University on August 2, 2016
11
Lui, 2009
Faith in humanity, trusting stance, cognitive Trusting stance reputation, calculative cost/benefit, situational normality, structural assurance, subjective norms, trusting beliefs, trusting attitude, and trusting intention Inequity Competence trust, formal contract, interorganizational learning (knowledge accessing, knowledge acquisition), history, expected future, procurement size, and firm size
Li, Hess, & Valacich, 2008
Not discussed
LMI
LMI
Organizational citizenship behaviors
Transformational & transactional leadership, and innovation
Gray & Densten, 2007
LMI
LMI
Six unnamed items*
Information privacy, psychological empowerment, organizational citizenship behaviors individual & organization, and creative performance
Alge, Ballinger, Tangirala, & Oakley, 2006
Fugate, Stank, & LO knowledge generation, LO knowledge Global reach* Mentzer, 2009 dissemination, LO knowledge Shared interpretation, LO knowledge responsiveness, LO performance, organizational performance, LO efficiency, LO effectiveness, and LO differentiation
Marker Variable Namea
Substantive Variables
Study
Marker Variable Type of Measureb
Table 2. Selected Information From Studies Using CFA/SEM With Marker Variables in Design
A priori
(continued)
Partial correlation technique showed no significant correlations between the marker and the two dependent variables, indicating a lack of common method bias.
Used Williams and Anderson (1994) methodology and found some evidence of marker variable method bias. This did not substantially alter the relationship between substantive variables. A priori Loaded nine substantive constructs onto one second-order factor and compared that model to one that also allowed the marker variable to load onto the second-order factor. The model without marker variable resulted in better fit and all paths except one were significant at p < .001 when marker variable was included. A priori The model including the marker variable had a superior fit over the baseline model. The marker variable had significant positive loadings on all but two leadership items. Post hoc Correlation approach with sensitivity analysis found all but three variables remained significant after partial correlation adjustment.
A priori
Marker Selection Analysis and Conclusion About CMV
12
Downloaded from orm.sagepub.com at Tbilisi State University on August 2, 2016
LMI
LMI
Bureaucracy* Supportive leadership, developmental leadership, affective commitment, career certainty, job satisfaction, role breadth selfefficacy
Fantasizing* Information privacy concerns, justice (distributive, procedural, and interactional), societal benefits from complaining, information privacy protective responses (refusal, misrepresentation, removal, negative word-of-mouth, complaining directly to online companies, and complaining indirectly to third-party organizations)
Rafferty & Griffin, 2006
Son & Kim, 2008
LMI
Leadership, vision, intellectual stimulation, Bureaucracy* inspirational communication, supportive leadership, personal recognition, affective commitment, continuance commitment, role breadth self-efficacy, interpersonal helping behavior, and turnover intention
Rafferty & Griffin, 2004
Marker Variable Namea
Substantive Variables
Marker Variable Type of Measureb
Study
Table 2 (continued)
A priori
A priori
A priori
(continued)
Controlled for the effects of marker variable method variance using an approach developed by Williams and Anderson (1994). The final model in this study included a CM factor that loaded freely on all items. Model comparisons indicated that marker variable effects were unequal across substantive variables and did not significantly change the estimated values of the structural paths. A marker variable was included in an approach adopted from Williams and Anderson (1994). Model comparisons indicated significant marker variable effects that were unequal across substantive indicators and that significantly affected estimates of structural parameters. Analysis indicated that CMV was not substantial, because the average correlation coefficient was close to 0 (r ¼ .03, n.s.). Thus, it was presumed CMV was not a serious problem in this study.
Marker Selection Analysis and Conclusion About CMV
Downloaded from orm.sagepub.com at Tbilisi State University on August 2, 2016
13
Substantive Variables
Marker Variable Namea
Westjohn, Arnold, Magnusson, Zdravkovic, & Zhou, 2009
Satisfaction with life* Cosmopolitanism, global identification, promotion and prevention focus, technology readiness, and technology usage
Tenure of the relationship*
Tenure at firm Perceived work compatibility, perceived usefulness, perceived ease of use, perceived behavioral control, intention to use, subjective norms, IT usage, and individual performance
Wang, Bradford, Complementary resources, knowledge sharing routines, learning orientation, Xu, & Weitz, open-mindedness, management support, 2008 trust, contract, power, and creativity production
Sun, Bhattacherjee, & Ma, 2009
Strauss, Griffin, Team member proficiency and proactivity, Work–home conflict* organization member proficiency and & Rafferty, proactivity, team and organizational 2009 commitment, role-breadth self-efficacy, team and organizational transformational leadership
Study
Table 2 (continued)
Not provided
OI
OI
LMI
Marker Variable Type of Measureb
(continued)
Model fit showed very little change after the inclusion of the marker variable suggesting that marker variable common method variance (CMV) was not a substantial explanation for the covariances between the study’s substantive variables. Post hoc The common method adjusted correlations between the variables of interest were not significantly different from the unadjusted correlations, suggesting CMV bias was not a serious problem in this study. Not Correlations remained significant after discussed the partial correlation adjustments, and the pattern of the estimated coefficients with the marker variable in the regression models remained the same when the marker variable was added. This suggested CMV bias was not a serious problem in this study. A priori Examined stability of structural parameters between the independent and dependent variables with and without the inclusion of a marker variable. In one of two samples, the significance level of one structural parameter deteriorated from .05 to .10, but the remaining parameters remained significant.
A priori
Marker Selection Analysis and Conclusion About CMV
14
Downloaded from orm.sagepub.com at Tbilisi State University on August 2, 2016
A priori
LMI Ye, Marinova, & Unit cost emphasis, unit revenue emphasis, Institutional forces, market Singh, 2007 change perception, detachment, perceived forces, customer rejection, and customer relationship effort* participation, productivity performance, and quality performance
Notes: CFA ¼ confirmatory factor analysis; SEM ¼ structural equation modeling. a Marker variables with an asterisk were stated as theoretically unrelated to substantive variables by the authors. b LMI ¼ Likert Multi-Item Scale, LSI ¼ single-item Likert, OI ¼ objective item.
A priori
LMI
Used partial correlation analysis to conclude marker variable was not a problem. Correlations corrected for marker variable were slightly lower than the original ones; the differences were not substantive and suggested that CMV effects did not affect study results. Assumed equal method effects (factor loadings) of four marker variables on substantive indicators. Model comparisons were made to mitigate the potential for common method bias by modeling a common method factor and partialing out the effect of the common method factor from the estimated structural coefficients.
Marker Selection Analysis and Conclusion About CMV A priori
Marker Variable Type of Measureb LMI
Race, language, party affiliation, perception Social desirability* of crisis, attributed charisma, value congruence, decisiveness, and vote Creative self-efficacy* Supervisory procedural justice, cognitive trust, affective trust, job satisfaction, job performance, and helping behaviors
Williams, Pillai, Lowe, Jung, & Herst, 2009 Yang, Mossholder, & Peng, 2009
Marker Variable Namea
Substantive Variables
Study
Table 2 (continued)
Williams et al.
15
variable effects by examining a model with unequal method effects (as described above), only this model additionally forced the structural parameters from the five transformational latent variables to the four outcomes to have the values obtained from a model without marker variable method effects. The comparison of this model with a model in which the structural parameters were estimated provided a test of bias due to method effects. Rafferty and Griffin found a nonsignificant difference and concluded that method effects did not significantly change the estimated values of the structural paths. A subsequent study by the same authors, Rafferty and Griffin (2006), used a similar analytic approach whereas examining the effects of developmental and supportive leadership on job satisfaction, career certainty, affective commitment, and role breadth self-efficacy. In this second study, bureaucracy was again used as the marker variable, using the same three indicators as in the first study. Analytically, the authors followed the same three stages of analyses, first testing for the presence of marker variable effects via a model comparison focusing on fixed versus estimated factor loadings linking the marker latent variable to indicators. The second and third stages, testing for equality of marker variable method effects and bias due to these effects, were conducted in the same way as in Rafferty and Griffin (2004), with similar findings of unequal effects in the second stage. In this case, however, in the third stage, the test of bias in structural parameters associated with marker variable method effects was significant, suggesting that method effects did significantly change the estimated values of the structural paths. They did not report how much change in the parameter estimates occurred. Finally, we identified a third study using latent variables to examine marker variable method effects. Ye, Marinova, and Singh (2007) included four marker variables (institutional forces, market forces, customer rejection, and customer relationship effort) in a multiple indicator structural equation model. The focus of their study was antecedents of change perceptions and the impact of these on detachment, productivity performance, and quality performance. These researchers assumed (but did not test for) equal effects of the marker variables on the substantive indicators. Ye et al. also conducted model comparisons and concluded that marker variable effects were present. However, they did not test for biasing effects of their marker variables on structural parameters linking their substantive latent variables. In terms of the other studies shown in Table 2, nine of the most recent of these studies appeared to not include their marker variable in their latent variable models. In spite of using SEM techniques to test substantive hypotheses in these articles, variants of the correlational marker technique were used. For example, E.A. Williams, Pillai, Lowe, Jung, and Herst (2009) used social desirability as their marker variable and used partial correlation analysis to conclude that method variance was not a problem but did not include the marker variable in a CFA of substantive variables that was conducted. Other studies from Table 2, which used partial correlation techniques to test for marker variable method variance while also reporting results of theory testing with latent variable structural equation techniques include Li, Hess, and Valacich (2008), Lui (2009), Son and Kim (2008), Sun, Bhattacherjee, and Ma (2009), Wang, Bradford, Xu, and Weitz (2008), and Yang, Mossholder, and Peng (2009). In a structural equation analysis that did not include latent variables, Strauss, Griffin, and Rafferty (2009) used work–home conflict as their marker variable and concluded that marker variable CMV was not an explanation for covariances among the substantive variables using a structural equation model with scales as single indicators (while not accounting for measurement error). An additional study by Westjohn, Arnold, Magnusson, Zdravkovic, and Zhou (2009) examined structural parameters both with and without the inclusion of a satisfaction with life marker variable, but it was not clear if any multiple indicator measurement model was included in their analyses. Finally, three additional articles did not provide enough details to fully understand their approach. Alge, Ballinger, Tangirala, and Oakley (2006) included information privacy and psychological empowerment, and their effects on three dimensions of employee performance were examined. Alge 15 Downloaded from orm.sagepub.com at Tbilisi State University on August 2, 2016
16
Organizational Research Methods 000(00)
et al. (2006) also included 6 marker items theoretically unrelated to the substantive constructs and followed a methodology suggested by L.J. Williams and Anderson (1994). Although not reporting detailed results of their assessment of marker variable method effects, Alge et al. concluded that although there was some evidence of common-source method effects, the marker variable method effects did not bias the relations among the substantive variables. Gray and Densten (2007) included organizational citizenship behavior as their marker variable in a study of transformational and transactional leadership that also included innovation. They reported that the model with marker variable effects had superior fit and that the marker variable had mostly significant effects on the leadership indicators. Finally, Fugate, Stank, and Mentzer (2009) included global reach as their marker variable and allowed it to have loadings on a second-order factor representing their substantive variables. They reported that the model without the marker variable effects had better fit and that all substantive paths except one remained significant when the marker variable was included.
Analytical Issues With Latent Variable Models With Marker Variables The two preceding sections indicate an SEM approach to marker variables has some advantages over the partial correlation approach. First, it puts the area of marker variable method variance investigation in line with other method variance research in approaching it from a measurement model perspective (with a marker latent variable’s influence represented via factor loadings). It also provides a statistical test of bias due to marker variable effects via a model comparison, overcoming a limitation that there is no test to compare the zero-order and partial correlations in the correlational marker technique. Finally, an SEM approach also allows for a test of the assumptions of the CMV versus the UMV models, while also controlling for the biasing effects of random measurement error. In this section, we will now discuss issues involved with the application of SEM to analysis of marker variables, building on topics originally raised by Lindell and Whitney (2001), and our reactions to the three articles mentioned above that used multiple indicators for marker and substantive latent variables and that provided details of analyses. We also take into account the special nuances associated with complex measurement models required for this type of analysis. We discuss these issues in an order that will facilitate our presentation in the next section, in which we develop a comprehensive approach to SEM analyses with marker variables, and again we will make reference to Figure 1. Before proceeding, we emphasize that there are assumptions and limitations to all structural equation model techniques as well as specific limitations of the use of marker variables, and we will address these issues in more detail in our discussion section. Our first issue involves the importance of establishing the meaning of the marker latent variable before testing for its impact on substantive indicators. We note that in Figure 1, the latent variable representing the marker variable is associated with its own indicators (X5, X6) via the factor loadings (d). However, to investigate the relation between the marker latent variable and the substantive indicators of the other latent variable, additional factor loadings are needed (e). Thus, as shown in Figure 1, the marker latent variable has factor loadings associated with its own indicators as well as all other indicators. A key point to be remembered is that the meaning of a latent variable is established by the specific indicators used to represent it. As a result, if in Figure 1, the paths linking the method latent variable to the substantive indicators (e) are set at 0, then the marker latent variable is defined according to the content of its own indicators. In this case, the meaning of this marker latent variable is clear. However, when the model shown in Figure 1 is evaluated with both sets of factor loadings (from the marker latent variable to its own indicators and to the other substantive indicators) while testing for method variance, the meaning of the marker latent variable becomes unclear. In this situation, this marker latent variable, as represented by six freely estimated factor loadings (d and e), has a meaning or interpretation that is ambiguous, reflecting in part the content of the marker indicators 16 Downloaded from orm.sagepub.com at Tbilisi State University on August 2, 2016
Williams et al.
17
but also containing additional components associated with the substantive meaning of the other indicators. Taking this concern into account, it seems advisable that before beginning analysis of a model that includes both sets of indicators (d and e), one should establish the meaning of the marker latent variable by fixing the factor loadings (d) and error variances associated with its indicators. If this is done, then the interpretation or meaning of the marker latent variable is clear, as is the meaning of the factor loadings linking the marker variable to the substantive indicators—these loadings will more purely reflect marker variable variance, given that the meaning of the marker variable is now established. From the information available from the studies of Rafferty and Griffin (2004, 2006) and Ye et al. (2007), it appears this was not done, which raises questions about the meaning of their marker latent variable and what was actually partialled or controlled for by their marker latent variables. Second, it seems that a comprehensive analysis approach should include the three steps identified in the three studies above (and that are often followed in other method variance research). These three steps include testing for the presence of method variance effects by individually and as a set examining the statistical significance of the factor loadings linking the marker latent variable to the substantive indicators (e). Also included should be a test of the equality of these method effects by comparing a model that forces these factor loadings to have the same value and a model that allows their values to be different. As noted earlier, this comparison provides information about the CMV and UMV models discussed by Lindell and Whitney (2001). Finally, a test should be conducted for potential biasing effects of the marker variable by comparing two additional models. Both models should control for marker variable effects via the factor loadings linking the marker latent variable with the substantive indicators (e); however, in one model, the substantive relations (either factor correlations or structural parameters) are freely estimated and in the second model they are constrained to values from a model without method effects. It appears that Rafferty and Griffin (2004, 2006) included both tests for the equality of method effects and for the biasing impact of these effects, but Ye et. al. (2007) did not. Third, there are two additional features of an SEM approach to marker variable analysis that could be attractive. First, although the steps above include testing for the biasing effects of marker variables on parameters representing relations among substantive variables, they do not provide any information on the impact of associated marker variable effects on the measurement of substantive latent variables. With reference to the example model shown in Figure 1, it might be expected that the reliability of a scale comprised of X1 and X2 would be influenced by the presence of systematic variance associated with method variance due to the marker variables (due to the factor loadings from the marker latent variable to X1 and X2). As a result, it would be attractive to be able to decompose an overall reliability estimate based on multiple items from a substantive variable scale included in a marker variable model into substantive and methodological (marker variable) components. Second, it may be recalled that Lindell and Whitney (2001) included in their suggestions a type of sensitivity analysis, in which several estimates of the amount of marker variable method variance were used to investigate the robustness of findings of the impact of the method variance. Given this, it would be attractive if approaches to quantifying the impact of marker variance on latent variable measurement and to implementing a sensitivity analysis could also be incorporated into an SEM approach to marker variables. These two steps were not included in the three key studies discussed from our review (Rafferty & Griffin, 2004, 2006; Ye et al., 2007).
A Comprehensive Analysis Plan Using SEM and Marker Variables Our goal is to develop a standard approach to latent variable analysis of marker effects that can be used across studies to facilitate consistency in analyses and that will yield a broader understanding of marker variables and their effects. We feel there is value in articulating such an approach, given that 17 Downloaded from orm.sagepub.com at Tbilisi State University on August 2, 2016
18
Organizational Research Methods 000(00)
there has been much reliance on partial correlations in this literature even though CFA approaches dominate other areas of method variance research. This goal is also supported by the fact that some researchers continue to rely on the correlational marker technique even though they use latent variable methods to test their substantive hypotheses. Finally, our goal is important because of the inconsistencies and deficiencies in existing SEM studies of marker variables, and we note that our method extends these previous applications in several ways. The proposed Comprehensive CFA Marker Technique approach proceeds in three phases that we now summarize (more details of these phases will be provided using an empirical example in a later section). Phase I in our approach includes analyses aimed at testing for the presence and equality of method effects associated with the marker latent variable. The initial version of the model shown in Figure 1 is referred to as the CFA Model; it has the four method factor loadings (e) set to 0. A second model will be referred to as the Baseline model. In the Baseline model, two correlations between the method and substantive latent variables (b) are forced to 0, the measurement parameters of the marker variable (d) are fixed at nonzero values obtained from the initial CFA model, and the four method factor loadings (e) are forced to 0. This model is evaluated to serve as a baseline for investigating method effects (hence its name). We emphasize that the requirement of an orthogonal relation between the marker and all substantive latent variables is a key assumption required of all latent variable method variance models, it is a more stringent assumption than that of the correlational marker technique, it is consistent with the use of ideal marker variables as discussed by Richardson et al. (2009), and we will consider the consequences of incorrectly implementing this assumption in a later section. Three additional models are required during Phase I of analysis. The third general model, the Method-C model, adds the four method factor loadings (e) back into the model, under the assumption that these loadings are constrained to have equal values (thus the label Method-C). A comparison of the Method-C Model to the Baseline Model provides a test of the presence of equal method effects associated with the marker latent variable. An alternative version of the Method-C Model that changes the assumption about the equality of the method factor loadings (e) and allows them to be different from each other is also examined. This fourth model will be called the Method-U Model, with the U indicating that the method factor loadings are unconstrained. A comparison of the Method-C and Method-U models allows for a comparison of the CMV and UMV models discussed by Lindell and Whitney. A fifth model, referred to as Method-R Model by Richardson et al. (2009), with the R indicating the use of restricted parameters to test for bias, is needed to investigate the potential biasing effect of marker variable method variance on factor correlations (or structural parameters). This model is identical to the Method-C and Method-U model, only the substantive factor correlations (a) are constrained to their values from the Baseline Model. The comparison of the Method-R Model with either the Method-C or Method-U Models (depending on which is retained in their direct comparison) provides a test of the bias in the substantive factor correlations due to the marker-based method variance that may be present. Once the presence and potential equality of method effects due to a marker latent variable have been investigated, the latent variable approach is used in Phase II to quantify how method variance affects the measurement of latent variables. This focus on the impact on latent variable measurement is in contrast to typical CFA applications of method variance that have emphasized the impact of method variance on individual indicator measurement properties by examining squared factor loadings of method latent variables on substantive indicators. Regarding latent variable measurement, traditional applications of CFA (without method factors) have allowed for the calculation of an estimate of reliability that would be obtained if the indicators of each latent variable were added together to create a composite scale. Specifically, an estimate of reliability for a scale based on the two indicators of the first substantive latent variable can be calculated using the factor loadings and error variances associated with X1 and X2. As another example, an estimate for a 18 Downloaded from orm.sagepub.com at Tbilisi State University on August 2, 2016
Williams et al.
19
scale based on adding X3 and X4 can be calculated using the factor loadings and error variances of X3 and X4. However, these calculations ignore the impact of shared method variance within these pairs of indicators associated with the marker latent variable. This shared method variance affects the correlations between indicators of the same latent variable (e.g., between X1 and X2 and would lead to nonzero factor loadings linking the marker latent variable to the indicators (two e paths to X1 and X2 in Figure 1). Most importantly, if not accounted for, this shared method variance would also affect the values obtained for estimates of reliabilities involving the latent variables, because in the absence of the two e paths, the shared method variance would inflate the two values of the c paths for the latent variable used in the reliability calculations. We will show how the impact of shared method variance on reliability estimation can be evaluated in our example. Finally, in Phase III, the Comprehensive CFA Marker Technique will be used to implement the sensitivity analysis included by Lindell and Whitney (2001) in their correlational marker technique, in which various estimates of the amount of method variance are used in conjunction with the partial correlation approach. With the latent variable approach, the initial estimate of the amount of method variance associated with each indicator is represented by the magnitude of the method factor loadings (e paths), as already discussed in the context of the Method-U and Method-C models. The latent variable approach can be extended to examine the impact of alternative estimates of the amount of method variance by choosing larger alternative values for the marker method factor loadings, and then entering these values as fixed (nonestimated) parameters in a model that will be referred to as the Method-S Model (with the S notation reflecting sensitivity). The Method-S Model, the sixth required for implementation of the Comprehensive CFA Marker Technique, is identical to the Method-C and Method-U Models, only the marker method factor loadings are fixed at values determined by the researcher. The fixed values are based on the confidence intervals of the method factor loading parameter estimates from either the Method-C or Method-U Models (depending on which one has been supported via their comparison). The examination of this model allows researchers to determine the sensitivity of their results to increasing amounts of marker method variance associated with sampling error in the measurement of the marker variable.
An Empirical Demonstration of the Comprehensive CFA Marker Technique We now present this approach in more detail by analyzing a data set with three traditional organizational behavior variables (leader–member exchange [LMX], job complexity, and role ambiguity) and with benefit administration as the marker variable. The entire analysis strategy will follow the three-phase approach delineated above. The data for this study were used previously in two unrelated studies based on a common data set. The three substantive variables were included in a study by L.J. Williams, Gavin, and Williams (1996) that investigated negative affectivity as a method variance variable. It is being used for this demonstration of latent variable analysis of marker variables, reliability decomposition, and sensitivity analysis because the substantive variables represent three domains frequently used in organizational research involving self-reports (leadership, job design, and stress). Additionally, the benefit administration marker variable was used in a substantive study that examined antecedents of pay satisfaction (M.L. Williams, 1995). The use of the benefit administration as a marker variable, relative to the three substantive variables included in the research, is consistent with the assumption noted by Lindell and Whitney (2001). Specifically, the marker variable approach requires that the marker variable be unrelated theoretically to the substantive variables under investigation. Although benefit administration has been studied only recently (and thus there is little empirical data on its correlates), it is the case that existing theoretical models of antecedents and consequences of benefit administration emphasize 19 Downloaded from orm.sagepub.com at Tbilisi State University on August 2, 2016
20
Organizational Research Methods 000(00)
variables associated with human resource and compensation systems. For example, benefit administration and its components have been supported as an antecedent of benefit level satisfaction, and it has been correlated with tenure and benefit comparisons, history, and coverage, as well as global job satisfaction and turnover intentions (M.L. Williams, 1995; M.L. Williams, Malos, & Palmer, 2002). However, there are no conceptual models or empirical research linking benefit administration with the leadership, job design, and stress types of substantive variables included in our example study.
Sample This sample included 148 Midwestern library employees who agreed to participate in an employee attitude survey. Respondents ranged in ages from 16 to 80 (M ¼ 45.4, SD ¼ 11.1), and 15% were men and 85% were women. Typical respondents held the job classifications of professional librarians, technical assistants, and clerical maintenance personnel. The average job tenure of the respondents was 8.5 years (SD ¼ 6.7).
Measures Role ambiguity was measured using a 6-item scale developed by Rizzo, House, and Lirztman (1970). The 6-item scale of job complexity was taken from the short version of the Job Characteristics Inventory (Sims, Szilagyi, & Keller, 1976). LMX was measured using the 8-item scale developed by Graen, Novak, and Sommerkamp (1982). For these three variables, the individual items were used as indicators of the latent variables so as to allow for specific results about the amount and statistical significance of marker-based method variance for each substantive item included. Benefit administration was measured using a scale developed by M.L. Williams (1995) and includes 10 items. Example items include (a) I can list all of the benefits provided to me by this organization, (b) I understand the benefits that are provided to me, and (c) My needs and desires concerning benefits are taken into account in planning the benefit program. The items from this scale were used to create three parcels that were used as indicators of the marker latent variable. The use of parcels for this variable was chosen because the properties of the individual marker items were not of interest and to reduce the overall number of indicators used in models examined; this is not a requirement of the proposed approach.
Analyses Phase I: Model comparisons. The first model examined, the CFA model (see Figure 2), allows for a complete set of correlations among the three substantive latent variables (leader–member exchange, role ambiguity, and job complexity) and the marker latent variable (benefit administration satisfaction). As noted earlier, the main reason for evaluating this model is to obtain the factor loading and measurement error variance estimates for the three marker variable indicators for use in subsequent models. The second model evaluated, the Baseline Model shown in Figure 3, allows the three substantive factors to be correlated with each other but has an orthogonal marker latent variable with its indicators having fixed factor loadings and fixed error variances. The estimates from the CFA Model were used as fixed values for the factor loadings and error variances for the marker variable indicators in the Baseline Model. Specifically, the unstandardized factor loadings for B1, B2, and B3 were 3.76, 5.66, and 5.49, respectively. The unstandardized error variances were 16.34, 3.17, and 10.73. The use of these fixed values in the evaluation of the Baseline Model and all subsequent models was necessary to establish the meaning of the marker latent variable because in all subsequent models the marker latent variable was linked to the substantive indicators via secondary factor loadings (which 20 Downloaded from orm.sagepub.com at Tbilisi State University on August 2, 2016
Williams et al.
21
L1
E1
L8
E8
R1
E9
R6
E14
J1
E15
J6
E20
B1
E21
B2
E22
B3
E23
Leader– member exchange
Role ambiguity
Job complexity
Marker variable
Figure 2. Confirmatory factor analysis (CFA) model. Note: Leader–member exchange is represented with eight indicators (L1–L8) and associated factor loadings, role ambiguity is represented with six indicators (R1–R6) and associated factor loadings, and job complexity is represented with six indicators (J1–J6) and associated factor loadings.
would as noted earlier compromise the meaning of the marker latent variable if its indicators did not have fixed measurement parameters). The marker latent variable was assumed to be orthogonal because this assumption would be necessary in subsequent models, and the goal with the Baseline Model was to have it specified so that all subsequent model comparisons would focus only on method variance factor loadings. As noted earlier, this orthogonality is consistent with the definition of ideal markers as originally proposed by Lindell and Whitney (2001) and emphasized by Richardson et al. (2009). In addition, as noted earlier, Lindell and Whitney (2001) made a distinction between common/ restricted method variance (CMV) and UMV models. Currently, these models were implemented using a CFA approach. The Method-C Model shown in Figure 4 is similar to the Baseline Model because the method marker variable is assumed to be orthogonal and the measurement parameters associated with its indicators are fixed. However, the Method-C Model has additional factor loadings from the method marker variable latent to each of the indicators in the model. In the current example, there are a total of 20 method factor loadings (represented with dashed lines in Figure 4). Additionally, each of the marker method factor loadings that relate to substantive items was forced to be equivalent in value, so as to appropriately reflect the assumption of the CMV Model of equal method effects. The comparison of the Method-C Model with the Baseline Model provides a test of the presence of method variance associated with the marker variable. 21 Downloaded from orm.sagepub.com at Tbilisi State University on August 2, 2016
22
Organizational Research Methods 000(00)
L1
E1
L8
E8
R1
E9
R6
E14
J1
E15
J6
E20
Leader– member exchange
Role ambiguity
Job complexity
Marker variable
*
B1
*
B2
* B3
* * *
E21 E22 E23
Figure 3. Baseline model. Note: Leader–member exchange is represented with eight indicators (L1–L8) and associated factor loadings, role ambiguity is represented with six indicators (R1–R6) and associated factor loadings, and job complexity is represented with six indicators (J1–J6) and associated factor loadings. The * symbolizes parameters set at values obtained from the confirmatory factor analysis (CFA) model.
The Method-U Model is similar to the Method-C Model, except that the 20 factor loadings from the marker latent variable to the substantive indicators are not forced to be equivalent and are allowed to have different estimates, thus reflecting the assumption of the UMV or Congeneric model that the marker variable is differentially related to substantive variables. A comparison of the Method-C and Method-U Models provides a test of the key difference between the CMV and UMV models and the assumption of equal method effects. Finally, the Method-R model uses the obtained factor correlations for LMX, role ambiguity, and job complexity from the Baseline Model as fixed values in either the Method-C or the Method-U Model (depending on which is supported). The comparison of either of the latter two models with the Method-R model provides the statistical test of the biasing effects of our marker variable on substantive relations. Phase II: Reliability decomposition. In addition to providing a means for testing the presence of method effects, the proposed latent variable approach provides a way of quantifying the amount of method variance associated with the measurement of the latent variables. As noted earlier, researchers have typically focused on obtaining estimates of the amount of method variance in the indicators in latent variable models by squaring the completely standardized method factor loadings. Although this gives important information about the indicators, researchers should also be interested in the implications related to the measurement of the latent variables. As noted earlier, the impact of method variance associated with marker variables is reflected in associated method factor loadings, 22 Downloaded from orm.sagepub.com at Tbilisi State University on August 2, 2016
Williams et al.
23
L1
E1
L8
E8
R1
E9
R6
E14
J1
E15
J6
E20
Leader– member exchange
Role ambiguity
Job complexity
Marker variable
*
B1
*
B2
* B3
* * *
E21 E22 E23
Figure 4. Method-C, Method-U, and Method-R Models. Note: Leader–member exchange is represented with eight indicators (L1–L8) and associated factor loadings, role ambiguity is represented with six indicators (R1–R6) and associated factor loadings, and job complexity is represented with six indicators (J1–J6) and associated factor loadings. The * symbolizes parameters set at values obtained from the CFA Model. The dashed lines represent the 20 marker factor loadings that are forced to be equal in the Method-C Model and are freely estimated in the Method-U Model. In the Method-R Model, the substantive factor correlations are restricted to values obtained with the Baseline Model.
suggesting that these loadings can be incorporated into the evaluation of latent variable reliability. To assess the effect of method variance on reliability estimates, the goal is to decompose a reliability measure into substantive and method variance components, just as has been done with decomposing the variance of individual indicators in previous method variance research. L.J. Williams and Paglis (1997) and Cavazotte and Williams (2002) have proposed a straightforward approach to reliability decomposition based on estimates obtained from models discussed earlier. Their method begins with estimates of factor loadings and error variances for each latent variable from the Baseline Model and the classic formula provided by Werts, Linn, and Joreskog (1974) and discussed by Bagozzi (1982) to obtain a total reliability estimate (Rtot): (1)
Rtot ¼ (sum of factor ldgs.)2/[(sum of factor ldgs.)2 þ sum of error variances]
Next, using estimates of substantive and method factor loadings and the error variances from the either the Method-C or Method-U Model (depending on which is supported in their comparison), two additional equations are used to partition the overall systematic variance into two components, substantive variance (Rsub) and method variance (Rmeth), as follows: 23 Downloaded from orm.sagepub.com at Tbilisi State University on August 2, 2016
24
Organizational Research Methods 000(00)
Rsub ¼ (sum substantive factor ldgs)2/[(sum substantive factor ldgs)2 þ (sum method factor ldgs)2 þ sum error variances] (3) Rmeth ¼ (sum method factor ldgs)2/[(sum substantive factor ldgs)2 þ (sum method factor ldgs)2 þ sum error variances]
(2)
Finally, it should be noted that the following relation holds: (4)
Rtot ¼ Rsub þ Rmeth
All of the factor loadings and error variance values used should be based on the completely standardized factor estimates from the relevant model (either Method-C or Method-U). This procedure allows for an estimation of the amount of inflation in the reliability estimate for each latent variable attributable to the marker variable under scrutiny. By deriving substantive and method variance components, this approach to reliability estimation offers a direct strategy to decompose reliability and yields a more complete understanding of the impact of method variance on latent variable measurement. Phase III: Sensitivity analysis. As noted earlier, Lindell and Whitney (2001) were concerned with the effects of sampling error on estimates of method variance due to marker variables, and they recommended systematically selecting values of additional marker variable correlations for further study, which were higher than the actual estimates obtained (but within specified confidence interval limits). With the proposed latent variable approach, a sensitivity analysis begins with the unstandardized factor loading estimates associated with the marker latent variable from the Method-C or Method-U Model. The values form the starting point for the specification of the Method-S Model, which has fixed values for these method factor loadings. In various versions of the Method-S Model, the marker method factor loadings are fixed at values greater than the estimates from the Method-U Model and changes in the substantive latent factor correlations are examined. The goal is to determine if values of the method factor loadings associated with the higher range of the confidence intervals of the original estimates of the method factor loadings lead to different conclusions about the impact of marker-based method variance on factor correlations than the original estimates. If the conclusions are not different, concerns about sampling error associated with the original estimates are lessened. In this study, the unstandardized factor loading values were set at values associated with the higher end of the confidence interval for the 0.05 and 0.01 a levels in models referred to as Method-S(.05) and Method-S(.01), respectively. For example, with the Method-S(.05) Model, each method factor loading parameter was fixed at the value computed as the original estimate plus the quantity 1.96 multiplied by the standard error of the original estimate.
Results Phase I: Model comparisons. The model fit results of the analyses for each model are shown in Table 3, including the chi-square, degrees of freedom, and Comparative Fit Index (CFI) values. We note that the CFI values are somewhat short of the .90 or .95 values often suggested, and this may in part reflect the relatively large number of indicators (20) for the substantive variables and the resulting number of constrained parameters in the factor loading matrix. The Baseline Model and Method-C Model were compared to test the null hypothesis that the method factor loadings (assumed to be equal) associated with the marker variable were not related to each of the 20 substantive indicators. The chi-square difference test comparing these two models indicated support for rejecting the restriction to 0 of the 20 method factor loadings in the Baseline Model. Specifically, as shown in Table 3, the comparison yields a chi-square difference of 13.92 with one degree of freedom, which exceeds the 0.05 chi-square critical value for one degree of freedom of 3.84. 24 Downloaded from orm.sagepub.com at Tbilisi State University on August 2, 2016
Williams et al.
25
Table 3. Chi-Square, Goodness-of-Fit Values, and Model Comparison Tests Model
w2
df
CFI
1. CFA 2. Baseline 3. Method-C 4. Method-U 5. Method-R Chi-Square Model Comparison Tests DModels 1. Baseline vs. Method-C 2. Method-C vs. Method-U 3. Method-U vs. Method-R
708.22 738.81 724.59 665.86 669.69
224 233 232 213 210
0.82 0.81 0.81 0.83 0.83
Dw2 13.92* 58.73* 3.83
Ddf 1 19 3
Chi-Square Critical Value; 0.05 3.84 30.14 7.82
*p