International Journal of
Geo-Information Article
Methodology for Evaluating the Quality of Ecosystem Maps: A Case Study in the Andes Dolors Armenteras 1, *, Tania Marisol González 1 , Francisco Javier Luque 1 , Denis López 2 and Nelly Rodríguez 1 1
2
*
Laboratorio de Ecología del Paisaje y Modelación de Ecosistemas ECOLMOD, Departamento de Biología, Edificio 421, Oficina 223, Universidad Nacional de Colombia, Bogotá 111321, Colombia;
[email protected] (T.M.G.);
[email protected] (F.J.L.);
[email protected] (N.R.) Infometrika Ltda, Carrera 7 # 16-56 Ofi. 804. Edificio Calle Real, Bogotá 110321, Colombia;
[email protected] Correspondence:
[email protected]; Tel.: +57-1-316-5000 (ext. 11333); Fax: +57-1-316-5310
Academic Editor: Wolfgang Kainz Received: 17 June 2016; Accepted: 8 August 2016; Published: 15 August 2016
Abstract: Uncertainty in thematic maps has been tested mainly in maps with discrete or fuzzy classifications based on spectral data. However, many ecosystem maps in tropical countries consist of discrete polygons containing information on various ecosystem properties such as vegetation cover, soil, climate, geomorphology and biodiversity. The combination of these properties into one class leads to error. We propose a probability-based sampling design with two domains, multiple stages, and stratification with selection of primary sampling units (PSUs) proportional to the richness of strata present. Validation is undertaken through field visits and fine resolution remote sensing data. A pilot site in the center of the Colombian Andes was chosen to validate a government official ecosystem map. Twenty primary sampling units (PSUs) of 10 × 15 km were selected, and the final numbers of final sampling units (FSUs) were 76 for the terrestrial domain and 46 for the aquatic domain. Our results showed a confidence level of 95%, with the accuracy in the terrestrial domain varying between 51.8% and 64.3% and in the aquatic domain varying between 75% and 92%. Governments need to account for uncertainty since they rely on the quality of these maps to make decisions and guide policies. Keywords: ecosystem mapping; remote sensing; uncertainty; field validation
1. Introduction Thematic maps are used throughout the environmental sector for research but mostly for supporting policy decisions and land planning. Ecosystem maps are also used to describe the spatial patterns of various types of ecological units and often to describe the extents of different ecosystem types for biodiversity conservation purposes [1], as well as quantifying, valuing and planning for ecosystem services [2–4]. However, before being used, any map should undergo a process of some kind of accuracy assessment [5] as a way of testing whether the data set values fall within some limits of reliability. This is of particular importance before making any decisions based on a map. Many examples of accuracy assessment have been developed for ecosystem [6,7] and land cover maps, which are mainly constructed from remotely sensed data [5,8]. Map accuracy assessment usually has a sampling design component, followed by a response design, and finally some type of estimation and analysis procedures [5]. For land-cover validation, Foody and Atkinson (2002) undertook a review of methodologies and identified trouble areas including the measurement precision, sampling type, error type and dimension, as well as the spatial distribution and error in evaluating the differences. In terms of ecosystem maps, Meidinger [6] was one of the first
ISPRS Int. J. Geo-Inf. 2016, 5, 144; doi:10.3390/ijgi5080144
www.mdpi.com/journal/ijgi
ISPRS Int. J. Geo-Inf. 2016, 5, 144
2 of 15
to propose a multiscalar protocol to determine the acceptability of a map through an unbiased statistical design of the map polygons and then an assessment of the thematic content with finer spatial resolution data and ground verification. Meidinger’s protocol proposed several steps including selecting the type of unit to be evaluated (either polygons or small areas), selecting the level of sampling, selecting the sampling size, conducting planning, scoring to determine the proportions of the map, during which the dominant mapping entity is corrected, and finally developing comparative tables such as confusion matrices. Other accuracy assessments have been developed for vegetation cover within the Geosphere-Biosphere International Program, Global Land Cover 2000 [9] and Glob Cover, highlighting the high cost of map validation and the need to have a global protocol and data available [10]. Some of the proposed approaches include a stratified random mapping of 5 × 5 km units for global datasets and a follow-up design based on interpretation by local experts at a finer spatial resolution using, for instance, QuickBird data [5,10]. A recent article [7] discusses uncertainty in ecosystem mapping by remote sensing and reviews some of the methods available, including fuzzy set theory, spectral unmixing and other alternative approaches based on Bayesian theory, maximum entropy or multivariate analysis. The application of the methods is even scarcer in the literature, and most of the examples use remote sensing data or validate only the remotely sensed derived data even when assessing thematic maps. The global land cover [9] was validated using a cluster analysis for only three classes—forests, agriculture land and wetlands—choosing the proportion of pixels to be validated according to the class proportion of the map and reporting a general accuracy of 68% of the map using confusion matrices [11]. In South America, using stratified sampling, the land use and land cover map was validated using 26 sites per type of land cover after first eliminating macroscopic errors on polygon limits and labels [12]. A separate study on Latin America and the Caribbean [13] focused on land use changes from 2001 to 2010. They used visual interpretation of fine resolution images from Google Earth, Digital Globe’s QuickBird and IKONOS as reference data for the accuracy assessment and applied it to a sampling grid, providing error matrix analysis including details of producer (omission) and user (commission) error. The overall accuracy was 80.2% ± 8.1%, with a minimum of 65.1% in the Caribbean and a maximum of 97.1% in the savannahs of Uruguay. Other than global and regional approaches, most of the Latin American local experiences of map validation are focused in Mexico, Peru, Ecuador and Argentina [14,15], but even there, sometimes despite field validation (plots, transects or rapid assessments), the accuracy of the map is not reported. In Venezuela, one study [16] reported the validation of a map of savannah ecosystems with field sampling areas of 1 km and had an overall accuracy of 90%, while the accuracy for hyper-seasonal and seasonal savannahs was 75%, and that for semi-seasonal savannah was below 50%. Colombia has some tradition of constructing maps of land cover and ecosystems, but most do not include validation [17,18]. Two subnational maps, for the Andes and the Orinoquia [19,20], adapted Meidinger’s (2003) protocol for accuracy assessment of ecosystem maps to tropical conditions using fine resolution satellite data and field validation, and reported a global accuracy and a stratum accuracy per biome type. Mapping complex ecological units as ecosystems is a process that has changed over time, and although remote sensing is an important part of these processes, other abiotic and biotic components of ecosystems are often incorporated. The Colombian ministry of environment and sustainable development, along with the research institutes, have been working on ecosystem mapping at a regional scale as an important contribution to land planning, and to provide scientific information for wildlife management [21]. With the purpose of fulfilling these objectives, an update of the ecosystems map at a scale of 1:100,000 was carried out, from the identification, classification and characterization of the ecosystems as a way to understand the territory. This process consisted of a bibliographic revision of the different identified, charted and investigated land and aquatic ecosystems in the country, to obtain a general typology [21]. Following this, a classification of the natural and transformed ecosystems
ISPRS Int. J. Geo-Inf. 2016, 5, 144
3 of 15
was done, and natural ecosystems were identified by characteristics such as: weather, geopedology ISPRS Int. J. Geo-Inf. 2016,ecosystems 5, 144 3 of 15 and cover. Posteriorly, were grouped and classified in synthesis units in accordance with the limit variables named before, resulting in a hierarchic legend which relates the ecosystems’ classified in synthesis units in accordance with the limit variables named before, resulting in a components [21].legend However, need to know the quality the information on which hierarchic whichgovernments relates the ecosystems’ components [21]. of However, governments need tothey are basing their decisions. This paper presents the development and application of a methodology know the quality of the information on which they are basing their decisions. This paper presents the to validate the qualityand of the official of ecosystem map in thisofficial methodology a pilot development application a methodology to Colombia, validate the applying quality of the ecosystemtomap applyingThe thispilot methodology a pilot site in by thedifferent Andean region. The pilot region is site in in theColombia, Andean region. region istocharacterized altitude, geomorphological characterized bygradients different altitude, geomorphological and transformation gradientsand withlowland ecosystems and transformation with ecosystems converging from both upland areas. converging from both upland and lowland areas. The objectives of this work are to develop andusing applyfine The objectives of this work are to develop and apply a selected sample and response design a selected sample and response design resolution images and field validation data and to resolution images and field validation datausing and fine to assess the thematic accuracy of the results. assess the thematic accuracy of the results.
2. Methods
2. Methods
2.1. Ecosystem Map
2.1. Ecosystem Map
The Colombian ecosystem map (scale 1:100,000) contains terrestrial and aquatic ecosystems The Colombian ecosystem map (scale 1:100,000) contains terrestrial and aquatic ecosystems information [21] and a vertical structure [22] and relates relatesboth bothbiotic biotic and abiotic information [21] uses and uses a vertical structure [22]that thatcombines combines and and abiotic components in a hierarchical way way [23].[23]. Overall, thisthis map reports a total ofof 3930 components in a hierarchical Overall, map reports a total 3930ecosystems ecosystems(Figure (Figure 1a), grouped 274 biomes the terrestrial domain (Figure 1b) and intointo 5878 ecosystems 1a),into grouped into 274for biomes for the terrestrial domain (Figure 1b) and 5878 ecosystems(Figure (Figure 2a) contained within 625 types oftypes general ecosystems (Figure 2b) for water domain. 2a) contained within 625 of general ecosystems (Figure 2b) the for the water domain.
(a)
(b)
Figure 1. Map of ecosystems (a) and biomes; (b) terrestrial domain (colors indicate different categories).
Figure 1. Map of ecosystems (a) and biomes; (b) terrestrial domain (colors indicate different categories).
2.2. Pilot Site Site 2.2.Study Pilot Study The validation waswas performed onona awindow thecentral central Andes in departments the departments The validation performed window located located ininthe Andes in the of Cundinamarca, Boyacáand and Casanare, Casanare, covering sixsix sheets at 1:100,000 (Plates 190, 191, 193, 209193, of Cundinamarca, Boyacá covering sheets at 1:100,000 (Plates 190,192, 191, 192, and 228)and andan an area area of This window was was selected with the assistance of officers 209 and 228) of 1,501,709 1,501,709ha. ha. This window selected with the assistance of from officers IDEAM, the producing institution, and is located in a terrestrial strategic area that includes from IDEAM, the producing institution, and is located in a terrestrial strategic area that includes ecosystems of the Andean region, specifically in the Eastern Mountain Range and some Orinoco ecosystems of the Andean region, specifically in the Eastern Mountain Range and some Orinoco lowland ecosystems, both terrestrial and aquatic (Figure 3). lowland ecosystems, both terrestrial and aquatic (Figure 3). The region comprises the Andean system belonging to the Eastern Cordillera and is The region comprises the Andean system the Easterngradient Cordillera andfrom is characterized characterized by a variety of thermal floorsbelonging that give ato temperature ranging 32 °C in ◦ C in the equatorial by a variety of thermal floors that give a temperature gradient ranging from 32 the equatorial zone to 2 °C in the Páramo region [24], and moisture regimes from superhumid to dry zone towith 2 ◦ Corinwithout the Páramo and moisture regimes from to dryinwith or without water region deficit, [24], with tendencies toward minimal orsuperhumid very high changes temperature water deficit, with minimal very high changes in temperature depending depending ontendencies the region. toward The selected pilotor window contains 994 terrestrial ecosystems, which on the region. The selected pilot window contains 994 terrestrial ecosystems, which represent 25.3%
ISPRS Int. J. Geo-Inf. 2016, 5, 144
4 of 15
ISPRS Int. J. Geo-Inf. 2016, 5, 144 ISPRS Int. J. Geo-Inf. 2016, 5, 144
4 of 14 4 of 15
of the terrestrial ecosystems identified in the national territory are grouped into 20into biomes, represent 25.3% of the terrestrial ecosystems identified in the nationaland territory and are grouped represent 25.3% of the terrestrial ecosystems identified in the national territory and are grouped into and 107 aquatic ecosystems representing 1.82% of those reported for the country, contained in 20 biomes, and 107 aquatic ecosystems representing 1.82% of those reported for the country, eight 20 biomes, ecosystems those 3). reported for the country, functional subsystems, allaquatic of them continental 3).1.82% of(Figure contained in and eight107 functional subsystems, allrepresenting of(Figure them continental contained in eight functional subsystems, all of them continental (Figure 3).
(a)
(b)
Figure 2. Map of ecosystems of Colombia (a) and general ecosystem types; (b) for aquatic domain. Figure 2. Map of ecosystems(a) of Colombia (a) and general ecosystem (b) types; (b) for aquatic domain. (colors indicate different categories). (colors indicate different categories). Figure 2. Map of ecosystems of Colombia (a) and general ecosystem types; (b) for aquatic domain. (colors indicate different categories).
(a)
(b)
Figure 3. Location of the pilot window in Colombia (a) and (b) detailed location of the six sheets (in (a)base cartography in the departments of Cundinamarca, (b) red) of 1:100,000 Boyacá and Casanare, (colours correspond to the different administrative units-departments within the Figure 3. Location of the pilot window in Colombia (a) and (b) detailed locationcountry). of the six sheets (in
Figure 3. Location of the pilot window in Colombia (a,b) detailed location of the six sheets (in red) red) of 1:100,000 base cartography in the departments of Cundinamarca, Boyacá and Casanare, of 1:100,000 base cartography in the departments of Cundinamarca, Boyacá and Casanare, (colours 2.3. Sampling Design (colours correspond to the different administrative units-departments within the country). correspond to the different administrative units-departments within the country). Areas for probability sampling with two domain and multiple stages were established, and 2.3. Sampling stratified withDesign selection proportional to the richness of strata present in each primary sampling unit 2.3. Sampling Design (PSU).Areas These strata are defined geographical units limited by multiple biomes for the terrestrial domain and for probability sampling with two domain and stages were established, and functional subsystems for the aquatic domain. For purposes of logistics associated with unit the and stratified selection proportional to thetwo richness of strata in each primary Areas forwith probability sampling with domain andpresent multiple stages weresampling established, optimization of financial resources, the selection of the sample includes the following stages. (PSU). These strata are defined geographical units limited by biomes for the terrestrial domain and
stratified with selection proportional to the richness of strata present in each primary sampling functional subsystems the aquatic domain. units For purposes ofbiomes logisticsfor associated with the unit (PSU). These strata arefor defined geographical limited by the terrestrial domain optimization of financial resources, the selection of the sample includes the following stages. and functional subsystems for the aquatic domain. For purposes of logistics associated with the optimization of financial resources, the selection of the sample includes the following stages.
ISPRS Int. J. Geo-Inf. 2016, 5, 144
5 of 15
ISPRS Int. J. Geo-Inf. 2016, 5, 144
5 of 15
2.3.1. First Stage
2.3.1. First Stage Primary Sampling Units (PSUs) were selected at the country level, each consisting of a rectangular 2 ), selected Primary Sampling Units were at the country level, eachwith consisting of of a 1:100,000 geographical area of 10 km × 15 km(PSUs) (150 km corresponding to 1/16 units a scale rectangular geographical area of 10 km × 15 km (150 km2), corresponding to 1/16 units with a scale of (Figure 4). 1:100,000 (Figure 4).
ISPRS Int. J. Geo-Inf. 2016, 5, 144
5 of 15
2.3.1. First Stage Primary Sampling Units (PSUs) were selected at the country level, each consisting of a rectangular geographical area of 10 km × 15 km (150 km2), corresponding to 1/16 units with a scale of 1:100,000 (Figure 4).
Figure 4. General scheme for primary sampling units (PSUs) at Boyacá department (colours
Figure 4. General scheme for primary sampling units (PSUs) at Boyacá department (colours correspond correspond to the present strata). to the present strata).
The random sampling was adjusted using the probability derived from the number of strata and ecosystems contained in each PSU; thus it is most likely to choose those PSUs that have the most Figure 4. General scheme for primary sampling units (PSUs) at Boyacá department (colours diverse strata (Figure 5). correspond to the present strata).
(a)
(a) Figure 5. Cont.
ISPRS Int. J. Geo-Inf. 2016, 5, 144
6 of 15
ISPRS Int. J. Geo-Inf. 2016, 5, 144
6 of 15
(b)
(c) Figure 5. Example outline of the final sampling units for validation models for the terrestrial domain:
Figure 5. Example outline of the final sampling units for validation models for the terrestrial domain: (a) selected PSU; (b) grid of 25 ha terrestrial FSU; (c) FSU selected for validation (colours indicate (a) selected PSU; (b) grid of 25 ha terrestrial FSU; (c) FSU selected for validation (colours indicate different strata). different strata). The random sampling was adjusted using the probability derived from the number of strata and ecosystems contained in each PSU; thus it is most likely to choose those PSUs that have the most 2.3.2. Second Stage diverse strata (Figure 5).
Final Sampling Units (FSUs) or reference units are the spatial unit that serves as the basis for 2.3.2. Second the comparison of Stage the reference classification and the ecosystems map. The size and shape of each Final Sampling Units units aredomain the spatial unitto that serves as the forthe the aquatic FSU correspond to squares of (FSUs) 25 ha or forreference the terrestrial and hexagons of 5basis ha in of the reference classification and the ecosystems map.and The size and shape of each FSU domaincomparison in lotic and lentic subsystems, whereas the transitional transformed aquatic units also used squares of 25 ha (Table 1). These areas correspond to the minimum mapping units included in the National Ecosystem Map are sampled within each stratum contained in the selected PSUs. Given the characteristics of the main land mass of the ecosystem map, the observation unit can be constituted by a transect (subsample of the FSU), an observation of the entire FSU or plot size defined according to the type of layer used to validate the response design. Finally, the following criteria were met:
ISPRS Int. J. Geo-Inf. 2016, 5, 144
• • • • • •
7 of 15
Each FSU belonged to a single stratum. The sample size for each stratum (n) was proportional to the ecosystem richness in each biome or subsystem. To consider each biome/functional subsystem as a stratum, it is required to have a minimum of 3 final sampling units (FSUs) which allows to obtain an estimate of the sampling error. The transformed ecosystems were grouped into one stratum for both terrestrial and aquatic domains. The selection of FSU (spatial distribution) was based on randomness. Each selected FSU had to contain more than 80% of the stratum to be validated. If the first selected FSU did not meet this requirement, a second FSU was selected in order to meet the proposed sample size for each stratum. When a FSU had several ecosystems within the stratum to validate, it was necessary to evaluate each ecosystem and to assign an agreement to the reference unit. Table 1. Size of the final sampling unit (FSU) or reference unit. Stratum
Ecosystem Richness
FSU Size (ha)
10 11 264 3582 57
25 25 25 25 25
6
25
7 7 24 3 84 5734 1 6 12
5 5 25 5 25 25 5 5 25
Terrestrial Domain Lithobiome of the high plains, Amazonian Plain Lithobiome of the high plains, floodplains, Guiana shield Transformed Stratum THZ of the Magdalena River Delta, Eastern Mountain Range THZ of the alluvial valley, the Atrato and San Juan Rivers, the Serranía del Baudó, and the coastal plains of the Pacific Aquatic Domain Andean Atlantic Lentic Andean Atlantic Lotic Andean Atlantic Transitional Artificial Transformed Stratum n Old lentic platforms Old lotic platforms Old transitional platforms
2.4. Sampling Size The sample size is the number of ultimate final sampling units (FSUs) necessary to estimate the reliability of the map. The following formula was used: n =
p x q t2α/2 e2
(1)
where n is the number of FSUs to evaluate p is the number of units classified correctly q is the proportion of units classified incorrectly t is the abscissa of the t distribution for a 95% confidence e is the relative error of 5% The FSUs are randomly selected to meet the required number for each stratum, i.e., the estimated n. Once the PSU is selected (Figure 5a), a division of the strata was made (FSU) (Figure 5b), and finally the FSUs were randomly selected (Figure 5c). For the aquatic domain and the transitional subsystem, the same process was undertaken (Figure 6a–c); however, for the lotic and lentic subsystems, FSUs
t is the abscissa of the t distribution for a 95% confidence e is the relative error of 5% ISPRS Int. J. Geo-Inf. 2016, 5, 144 8 of 15 The FSUs are randomly selected to meet the required number for each stratum, i.e., the estimated n. Once the qPSU is proportion selected (Figure a division of the strata was made (FSU) (Figure 5b), and finally is the of units5a), classified incorrectly ISPRS Int. J. Geo-Inf. 2016, 5, 144 8 of 15 the FSUs were randomly (Figure 5c). theconfidence aquatic domain and the transitional subsystem, t is the abscissa selected of the t distribution forFor a 95% the same process undertaken e is the was relative error of 5%(Figure 6a–c); however, for the lotic and lentic subsystems, FSUs correspond to hexagons (Figure 6b–d). Material for testing was prepared from the appropriate correspond to hexagons 6b–d).selected Material for testing was prepared from appropriate sources The FSUs(Figure are randomly to meet the required number for eachthe stratum, i.e., the estimated sources of reference. of reference.n. Once the PSU is selected (Figure 5a), a division of the strata was made (FSU) (Figure 5b), and finally
the FSUs were randomly selected (Figure 5c). For the aquatic domain and the transitional subsystem, the same process was undertaken (Figure 6a–c); however, for the lotic and lentic subsystems, FSUs correspond to hexagons (Figure 6b–d). Material for testing was prepared from the appropriate sources of reference.
(c)
(c)
(a)
(b)
(d)
Figure 6. Example Figure 6. Example outline outline of of the the final final sampling sampling units units for for validation validation models models for for the the aquatic aquatic domain. domain. (a) grid of 25 ha terrestrial FSUs (b) grid of 25 ha aquatic and transitional FSU (squares) of 5 (b) FSU (squares)and (d) (a) grid of 25 ha terrestrial(a) FSUs (b) grid of 25 ha aquatic and transitional andgrid grid of ha lotic and lentic FSU (hexagons) (c) (c) selected 25 ha and transitional FSUFSU (d) selected 5 ha lotic 5 ha lotic and lentic (hexagons) selected 25 aquatic ha aquatic transitional 5 ha Figure 6. FSU Example outline of the final sampling units forand validation models for (d) the selected aquatic domain. and lentic FSU lotic and lentic FSU.
(a) grid of 25 ha terrestrial FSUs (b) grid of 25 ha aquatic and transitional FSU (squares) and grid of 5 ha lotic and lentic FSU (hexagons) (c) selected 25 ha aquatic and transitional FSU (d) selected 5 ha lotic 2.5. Data Sourcesand and Validation FSU 2.5. Data Sources andlentic Validation
The FSUs can be evaluated using various sources of information, and the chosen method or The FSUs can Sources be evaluated using various sources of information, and the chosen method or 2.5. Data and Validation methods must be consistent with the purpose of assessing the accuracy, time and resources available methods must be consistent with the purpose of assessing the accuracy, time and resources available FSUs can be evaluated various sourcesofofimportance information,(Table and the to carry out theThe process. Several sources using are listed in order 2).chosen Thesemethod sourcesor to carry outmethods the process. Several sources arepurpose listed in order of importance (Table 2).resources These sources must be consistent with the of assessing the accuracy, time and available must be of higher quality than those used for mapping the ecosystem (finer resolution scale). If by must be of to higher than those usedsources for mapping (finer resolution If by carry quality out the process. Several are listedthe in ecosystem order of importance (Table 2). scale). These sources some chance the same information source used for creating the map has to be used for validation, some chancemust the be same information usedused for creating the map has to be (finer used resolution for validation, of higher qualitysource than those for mapping the ecosystem scale).then If by then the process used to create the reference classification must be more accurate than the process the process some used chance to create reference classification must morethe accurate than theused process used to thethe same information source used for be creating map has to be for validation, used to develop theprocess map; and date for satellite images used must as reference sources must coincide the usedthe to create the images reference classification be moremust accurate than the process develop thethen map; and the date for satellite used as reference sources coincide with the with the year of to thedevelop inputs the of the classification, particularly in theused land-cover component. used map; and the date for satellite images as reference sources must coincide year of the inputs of the classification, particularly in the land-cover component. with the year of the inputs of the classification, particularly in the land-cover component. Table 2. Information sources for reference data recommended for the validation process. Table 2. Information sources for reference data recommended for the validation process.
Table 2. Information sources for reference data recommended for the validation process. Data Sources Characteristics Example Data Sources Characteristics Example Data Sources Characteristics Example
Field work data collection to fill validation formats.formats. Field workFieldField datadata collection totofill work Field Field collection fillvalidation validation formats. ISPRS Int. J. Geo-Inf. 2016, 5, 144
Medium-
Medium-resolution resolution satellite images satellite images
9 of 15
Landsat 7 ETM (30 m) Landsat 7 ETM (30 m) SPOT-4 multispectral (20 m) SPOT-4 multispectral (20 m) SPOT-4 panchromatic (10 m)
SPOT-4 panchromatic (10 m)
Aerial photography (resolution 1 m).
Fine resolution satellite images
Ikonos panchromatic (1 m), multispectral (4 m) Aster Airborne multispectral scanners > 0.3 m CBERS 1–3, Geoeye Lidar, QuickBird Worldview
ISPRS Int. J. Geo-Inf. 2016, 5, 144
9 of 15
Landsat 7 ETM (30 m) ISPRS Int. J. Geo-Inf. 2016, 5, 144 MediumLandsat 7 ETM (30 (20 m) m) SPOT-4 multispectral SPOT-4 panchromatic multispectral (20 SPOT-4 (10 m) m) resolution satellite images SPOT-4 panchromatic (10 m) satellite images
9 of 15
ISPRS Int. J. Geo-Inf.resolution 2016, 5, 144 Medium-
9 of 15
Table 2. Cont.
Data Sources
Mediumresolution satellite images
Landsat 7 ETM (30 m) SPOT-4 multispectral (20 m) SPOT-4 panchromatic (10 m) Characteristics
Example
Aerial photography (resolution 1 m). Aerial photography (resolution 1 m).
Ikonos panchromatic (1 m), multispectral (4 m) Ikonos panchromatic m),multispectral multispectral (4(4m) Aster Airborne multispectral scanners > 0.3 mm) Ikonos panchromatic (1(1m), Aster Airborne multispectral scanners >>0.3 Fine resolution Aster CBERS 1–3, Geoeye Airborne multispectral scanners 0.3mm Fine resolutionsatellite satellite Fine resolution CBERS 1–3, Geoeye images Lidar, QuickBird CBERS 1–3, Geoeye images Ikonos panchromatic (1 m), multispectral (4 m) satellite images Lidar, QuickBird Worldview Lidar, QuickBird Aster Airborne multispectral scanners > 0.3 m Worldview Worldview Fine resolution CBERS 1–3, Geoeye satellite images
Aerial photography (resolution 1 m).
Lidar, QuickBird Worldview
Soil maps of Colombia Scales of 1:100,000 Soilmaps maps of Colombia Scales of Soil of Colombia Scales of to1:25,000 [25] Map of Paramos in 1:100,000 Colombia, 1:100,000 toof 1:25,000 [25] SoilMap maps of Paramos Colombia Scales of 1:100,000 to1:25,000 [25] scale 1:100,000 [26]in Colombia, [25] Map scale of Paramos in Colombia, Map of Paramosto1:25,000 in Colombia, [26] scale 1:100,000 [26]in1:100,000 Thematic Map of dry forests distribution Colombia, scale 1:100,000 [26] Thematic cartography Map of dry forests distribution in Colombia, Thematic Map of dry forests distribution in Colombia, cartography scale 1:100,000 [27]. Thematic Map of dry forests distribution in Colombia, scale 1:100,000 [27]. cartography cartography 1:100,000 [27]. 1:100,000 Wetland mapscale for Colombia, scale and scale 1:100,000 [27]. Wetland map for scale 1:100,000 Wetland map for [28] Colombia, scale 1:100,000 Wetland map forColombia, Colombia, scale 1:100,000 and and 1:25,000 and 1:25,000 [28] [28] 1:25,000 1:25,000 [28]
of records biological from collections Database of biological from Database ofDatabase biological recordsrecords from collections collections Floristic mainly of the Biodiversity Information System Database of biological records from collections of theofBiodiversity Information System Floristic mainly mainly the Biodiversity Information Systemfor inventories or for Colombia (SIB), the Global System of Floristic inventories or Floristic orColombia mainly of the Biodiversity Information System the Global System of Biodiversity inventories Colombia (SIB), Information the Global System of and other datafor for(SIB), Biodiversity Facility (GBIF) other data for species inventories or Information for Colombia (SIB), the and Global System of Facility (GBIF) project other data for Biodiversity Information Facility (GBIF) andof species specific project dataspecific (i.e., inventory other data for data Biodiversity Information Facility (GBIF)ofand (i.e., inventory ofwetlands—MADS). wetlands—MADS). species specific project data (i.e., inventory species specific project data (i.e., inventory of wetlands—MADS). wetlands—MADS). 2.6. Field Data
2.6. Field Data 2.6. Field Data 2.6. Field Data
Field data represent the most accurate way to measure the reference classification source. The
field data collection is based on pre-established methodologies developed by a group of experts in Field data represent the most accurate to measure the reference classification source.source. The field Field data represent the mostway accurate way to measure the reference classification The the field. Generally, the evaluation is done by observation, sampling transects or plots randomly Field data represent the most accurate way to measure the reference classification source. The data collection based on pre-established methodologies developed by a group of experts in the field. fieldisdata collection is based on pre-established methodologies developed by a group of experts in distributed within each selected FSU. field data Generally, collection isthe based on pre-established methodologies developed by a group of experts in the evaluation field. evaluation is done by observation, sampling transects plots Two field trips conducted during the month of November 2014; the firstor in the arearandomly of the Generally, the is done by were observation, sampling transects or plots randomly distributed the field. Generally, theselected evaluation is done by observation, sampling or plots randomly Altiplano Cundiboyacense (Cundinamarca and Boyacá high plateaus) transects and the second in a sector of within each FSU. within eachdistributed selected FSU. distributed within each selected FSU. the piedmont and eastern slopes of the Eastern Mountain Range (Casanare and Boyacá). The PSUs Two field trips were conducted during the month of November 2014; the first in the area of the Two field trips were conducted during theselection monthofoftheNovember 2014;thethe inwithin the area of the weretrips randomly like the FSUs,November considering richfirst strata each PSU, Two field wereselected, conducted during and the month 2014; in the of the Altiplano Cundiboyacense (Cundinamarca Boyacáofhigh plateaus) andthe thefirst second in area a sector of Altiplano Cundiboyacense (Cundinamarca and high plateaus) and theand second in sector of theof in order to optimize logistics andBoyacá timeand resources during the verification process. Theafield Altiplano Cundiboyacense (Cundinamarca Boyacá high plateaus) the second in material aThe sector the piedmont and eastern slopes of the Eastern Mountain Range (Casanare and Boyacá). PSUs PSU for reference classification consisted of the following:and Boyacá). The PSUs were piedmont and easternper slopes ofthe the Eastern Range (Casanare the piedmont and eastern slopes of Mountain the Eastern Range (Casanare and Boyacá). The PSUs were randomly selected, like the selection of theMountain FSUs, considering the rich strata within each PSU, randomly selected, like the selection of the FSUs, considering the rich strata within each PSU, in order were randomly selected, like the selection of the FSUs, considering the rich strata within each PSU, in order to optimize logistics and time resources during the verification process. The field material order toand optimize logistics and time consisted resources during the verification process. The per fieldPSU material to optimizein logistics resources during the verification process. The field material for per PSU for thetime reference classification of the following: per PSU for the reference classification consisted of the following: the reference classification consisted of the following:
-
-
Basic Cartography: information on location of paths, roads and rivers to facilitate the location and access to the FSU. Cartography corresponding to the selected PSU using Landsat images from 2008 (reference date of the land-cover map used in the original mapping ecosystems) and RapidEye images from 2010 for the location of each FSU. Additional cartographic material such as ecosystems in each FSU and map of edaphogenetic environments. Field formats.
ISPRS Int. J. Geo-Inf. 2016, 5, 144
-
-
10 of 15
GPS Garmin62sc (Garmin, Lenexa, KS, USA), Munsell chart, pH metre and reagents for testing some edaphogenetic characteristics. Satellite images: Data obtained from satellite imagery can be relatively inexpensive and an easier alternative application in hard to reach areas, complementing the field validation process. Such an assessment must be performed by an expert in the subject, and the uncertainty and variability of the data should be considered through clear evaluation criteria. Either intermediate resolution images such as Landsat and SPOT or fine resolution images can be used. The images used for the pilot correspond to the Landsat 7-56200801-02, 8-56 and 8-572007/02/232007/02/07, a fine resolution Rapideye of 2010 was also used and in some cases Google Earth consulted. Cartographic information and additional data bases: Other supporting data can provide useful sources of reference in the first level of classification of ecosystems, e.g., projects at national and regional level that are being carried out in the country. Available information for Páramos [26], dry forests [27], wetlands [28], fauna and flora inventories was used.
For this assessment, the selection of two to three FSU for each stratum were evaluated in the PSU, validating one or two FSU at most. Finally, to define the rules on the agreement of the classification map versus the reference classification, the variables that define both strata and ecosystems were prioritized. First the stratum is evaluated, and once there is agreement between the classifications, the ecosystem or ecosystems contained within that stratum are then evaluated. If there are two or more ecosystems within the PSU, its presence is first validated to indicate the percentage occupied by each ecosystem. If it is not possible to identify this in the reference classification, the entry is made by validating the ecosystem with the highest percentage in the stratum. To reach “agreement” status, at least 70% of the area of an ecosystem must be occupied by the variable that characterizes it. 2.7. Analysis The estimation of the overall proportion of the well classified PSUs and the accuracy were quantified by standard errors, using the following formulas: H
pˆ =
∑ Wh Ph
(2)
h =1
where: Pˆ is the sample proportion of FSUs correctly classified in the map Ph is the proportion of PSUs correctly classified in stratum Wh is the FSU proportion that belong to the stratum H is the weight associated with each stratum Wh and H are determined by the relationship between the number of FSU in each stratum and the total number of FSU in the map (proportion of units classified incorrectly) v u u 1 H N − nh ph qh = z t 2 ∑ Nh2 h (3) Nh nh − 1 N H =1 where:
∈: standard error Z: 1.96 (95% confident) N: total number of UFM in the map Nh : total number of PSU in stratum h nh : number of PSU in stratum h of the sample qh : represents the proportion of PSU classified incorrectly in stratum
N: number of UFM in thehmap nh: total number of PSU in stratum of the sample N h: total number of PSU in stratum h qh: represents the proportion of PSU classified incorrectly in stratum nh: number of PSU in stratum h of the sample q3.h:Results represents proportion of PSU classified incorrectly in stratum andthe Discussion ISPRS Int. J. Geo-Inf. 2016, 5, 144
11 of 15
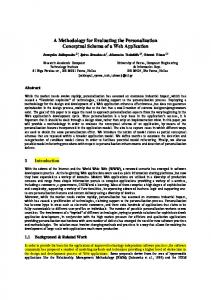
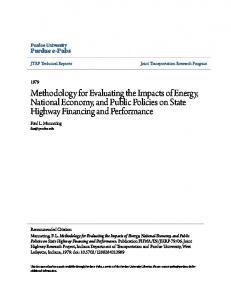
A totaland of 22 PSUs were selected (Figures 7 and 8), and a total of 76 FSUs for the terrestrial domain 3. Results Discussion and 46 for the aquatic domain (Figures 9 and 10, Tables S1 and S2). In the terrestrial domain, 34 out A of 22 PSUs weredid selected (Figures and 8),given and aby total 76 FSUs for the terrestrial domain Results and Discussion of 763. oftotal the validated FSUs not match the7legend theofmap. Therefore, with a confidence and thethe aquatic domain (Figures 9 and 10, Tables S1 and S2). In the terrestrial domain, 34 out level46offor 95%, of single the theof terrestrial ranged A total of labelling 22 PSUs were selecteddomains (Figures 7in and 8),map and aof total 76 FSUs forecosystems the terrestrialonly domain of 76 of the validated did not match9).the legend given by the map. Therefore, with a confidence between 51% 64%FSUs accuracy (Figure For aquatic domain, only 8 out ofdomain, 46 of the validated and 46 forand the aquatic domain (Figures 9 and 10,the Tables S1 and S2). In the terrestrial 34 out of level of 95%, the labelling of single domains in the map of the terrestrial ecosystems only ranged units76did notvalidated match FSUs the legend; with the a confidence of 95%, the accuracy for thelevel aquatic of the did not match legend giveninterval by the map. Therefore, with a confidence between 51% 64% accuracy (Figure 9). Formap the10, aquatic domain, only 8 out of ranged 46 of the validated of 95%, theand labelling of single in (Figure the of the terrestrial only between ecosystems ranged between 75%domains and 92% Table S2). ecosystems units51% didand not64% match the legend; with confidence intervalonly of 895%, the46accuracy for theunits aquatic accuracy (Figure 9). Fora the aquatic domain, out of of the validated ecosystems between 92% (Figure 10,ofTable did not ranged match the legend; 75% with and a confidence interval 95%,S2). the accuracy for the aquatic ecosystems ranged between 75% and 92% (Figure 10, Table S2).
Figure 7. Map of the PSUs for the terrestrial domain. Figure 7. Map of the PSUs for the terrestrial domain.
Figure 7. Map of the PSUs for the terrestrial domain.
Figure 8. Map of the PSUs for the aquatic domain.
Figure 8. Map of the PSUs for the aquatic domain.
The confidence intervals for our results can still be considered too large, but because only a pilot 8. Map of the PSUs for aquatic domain. The was confidence intervals for our results can still bethe considered too large,indicator but because a pilot area used to test the Figure methodology, we believe that our results are a good of theonly quality area of was test the methodology, we believe our results a good indicator of the quality theused map.toIndeed, more extended strata are easierthat to evaluate, andare their level of agreement is high, The confidence intervals forare ourrare results beevaluate, considered too large, butofbecause onlye.g., pilot azonal strata, which within thestill pilot window, yielded lesslevel favourable results, of thewhereas map. Indeed, more extended strata arecan easier to and their agreement isa high, area was azonal used tostrata, test Orobiome the methodology, we believe thatRange our results are a good indicator ofresults, the quality Andean Aazonal of the Mountain andyielded Altiplano Cundiboyacense strata whereas which are rareEastern within the pilot window, less favourable e.g., of the map. Indeed, more extended strata are easier to evaluate, and their level of agreement is high, (AAOEMR-AC) (Figure 9). This is partly due to the smaller number of FSUs (Figure 9) and the Andean Aazonal Orobiome of the Eastern Mountain Range and Altiplano Cundiboyacense strata location within an anthropic matrix. of thewindow, common mistakes of thefavourable ecosystem maps are e.g., whereas azonal strata, which are rareFurther, within some the pilot yielded less results, associated with errors from information used; suchand is theAltiplano case with Cundiboyacense the land-cover map, Andean Aazonal Orobiome ofthe thesource Eastern Mountain Range strata where the label of a polygon does not tend to match the current or previous information condition of the reference year. This is most evident in areas with high land use dynamics, like the current area where the pilot window is located [29]. In addition, the high heterogeneity in some areas, in relation to the scale of the map, makes it very difficult to differentiate biomes and ecosystems. In this sense,
ISPRS Int. J. Geo-Inf. 2016, 5, 144
11 of 14
ISPRS Int. J. Geo-Inf. 2016, 5, 144 12 of 15 where the pilot window is located [29]. In addition, the high heterogeneity in some areas, in relation to the scale of the map, makes it very difficult to differentiate biomes and ecosystems. In this sense, it it will will be be necessary necessary to to develop develop specific specific criteria criteria to to classify classify and and evaluate evaluate both both biomes biomes and and ecosystems. ecosystems. In this sense, the development of specific criteria to classify and assess biomes and ecosystems will In this sense, the development of specific criteria to classify and assess biomes and ecosystems will be necessary, including spatial pattern information [30], and thus distinguish the ecosystems highly be necessary, including spatial pattern information [30], and thus distinguish the ecosystems highly influenced by anthropic pressures among the regional matrices, or small ecosystems restricted by influenced by anthropic pressures among the regional matrices, or small ecosystems restricted by physical factors or local dynamics. physical factors or local dynamics.
Figure 9. Overall agreement data for strata in the terrestrial domain. Top terrestrial domain strata Figure 9. Overall agreement data for strata in the terrestrial domain. Top terrestrial domain with agreement. Bottom: terrestrial domain strata without agreement. See Table S1 for ecosystem strata with agreement. Bottom: terrestrial domain strata without agreement. See Table S1 for abbreviation. ecosystem abbreviation.
ISPRS Int. J. Geo-Inf. 2016, 5, 144
13 of 15
Figure 10. Overall agreement data for strata on aquatic domain. Top: aquatic domain strata with aquatic domain. domain. Top: aquatic domain strata with Figure 10. Overall agreement data for strata on aquatic agreement. Bottom: aquatic domain strata without agreement. See Table S2 for ecosystem agreement. domain stratastrata without agreement. See TableSee S2 for ecosystem agreement. Bottom: Bottom:aquatic aquatic domain without agreement. Table S2 forabbreviation. ecosystem abbreviation. abbreviation.
On the other hand, azonal Andean ecosystems and azonal Páramos are difficult to identify due to their high level of anthropic intervention processes [29]. This has caused soil changes and the establishment of a series of ecosystem successional stages. Thus, some characteristics of these ecosystems vary considerably even in nearby sites, and it is very complex to identify the reference unit, as there are no specific parameters in these cases. Therefore, the recommendation is to consider
ISPRS Int. J. Geo-Inf. 2016, 5, 144
13 of 15
On the other hand, azonal Andean ecosystems and azonal Páramos are difficult to identify due to their high level of anthropic intervention processes [29]. This has caused soil changes and the establishment of a series of ecosystem successional stages. Thus, some characteristics of these ecosystems vary considerably even in nearby sites, and it is very complex to identify the reference unit, as there are no specific parameters in these cases. Therefore, the recommendation is to consider the FSUs of these subsystems as a single transitional layer and to focus future efforts on better characterization. These are key sites for which future policy efforts should focus on restoration and conservation. The FSUs of the sub-Andean biomes of the Eastern Mountain Range and the high plains also have a very low agreement, probably due to the high levels of intervention. There were some errors on the altitudinal limit defined in the methodology. We suggest the establishment of a minimum size of altitudinal ranges for acceptable sampling units in these transitional areas, and that size should also be associated with the slopes of each mountain range. The ecosystem map is the result of a combination of formation factors organized in a hierarchical fashion, and, for the terrestrial domain, the ecosystem spatial unit must consider the incorporation of the floristic aspect. From this perspective, it is necessary to incorporate into the ecosystem mapping process modeling methods to identify the emergent properties of the ecosystems, where a group of plant communities coexist among heterogeneous landscapes, meaning more functional ecosystem units are mapped. Specifically, for the aquatic domain, it is recommended that the transitional ecosystems are considered as an amphibious domain, because these zones gather characteristics of both domains, aquatic and terrestrial. The river landscape integrity for the lotic stratum and the mean depth of the lentic stratum are variables that explain the dynamism of these systems, and its incorporation into the mapping process strengthens the delimitation and characterization of the ecosystems’ units. Finally, the fact that a government conducts this type of quality assessment for the information produced by official institutions is a key step to make better decisions regarding ecosystem conservation, ecosystem service valuation and, finally, land planning and management. Acknowledgments: We thank Saralux Valbuena, Subdirector and Carlos Ortegon and Diana Ramírez from the Subdirección de Ecosistemas e Información Ambiental—Instituto de Estudios Ambientales y Meteorológicos—IDEAM (Colombia) for all their advice, support and comments. We are grateful to William Agudelo for his support in data management. We also thank the Universidad Nacional de Colombia for its continuous support. Finally wewould like to thank IDEAM for its financial support through contracts 203-2015 and 275-2014 Author Contributions: Dolors Armenteras and Nelly Rodriguez conceived the idea, designed the analysis, performed data analysis, Deni López designed the statistical analysis, Dolors Armenteras wrote the manuscript; Tania M González y Francisco J Luque prepared the information and performed part of the analysis. All authors contributed with field validation and revising the manuscript. Conflicts of Interest: The authors declare no conflict of interest.
References 1.
2. 3. 4. 5.
Keith, D.A.; Rodríguez, J.P.; Rodríguez-Clark, K.M.; Nicholson, E.; Aapala, K.; Alonso, A.; Asmussen, M.; Bachman, S.; Basset, A.; Barrow, E.G.; et al. Scientific foundations for an IUCN red list of ecosystems. PLoS ONE 2013, 8, e62111. [CrossRef] [PubMed] Egoh, B.; Reyers, B.; Rouget, M.; Bode, M.; Richardson, D.M. Spatial congruence between biodiversity and ecosystem services in South Africa. Biol. Conserv. 2008, 142, 553–562. [CrossRef] Egoh, B.; Reyers, B.; Rouget, M.; Richardson, D.M.; Le Maitre, D.C.; van Jaarsveld, A.S. Mapping ecosystem services for planning and management. Agric. Ecosyst. Environ. 2008, 127, 135–140. [CrossRef] Crossman, N.D.; Burkhard, B.; Nedkov, S. Quantifying and mapping ecosystem services. Int. J. Biodivers. Sci. Ecosyst. Serv. Manag. 2012, 8, 1–4. [CrossRef] Stehman, S.V.; Czaplewski, R.L. Design and analysis for thematic map accuracy assessment—An application of satellite imagery. Remote Sens. Environ. 1998, 64, 331–344. [CrossRef]
ISPRS Int. J. Geo-Inf. 2016, 5, 144
6. 7.
8. 9. 10.
11.
12. 13.
14. 15.
16. 17.
18.
19. 20.
21. 22. 23. 24. 25. 26.
14 of 15
Meidinger, D.V. Protocol for Accuracy Assessment of Ecosystem Maps; Technical Report 011; Ministry of Forests: Victoria, BC, USA, 2003; p. 23. Rocchini, D.; Foody, G.M.; Nagendra, H.; Ricotta, C.; Anand, M.; He, K.S.; Amici, V.; Kleinschmit, B.; Förster, M.; Schmidtlein, S.H.; et al. Uncertainty in ecosystem mapping by remote sensing. Comput. Geosci. 2013, 50, 128–135. [CrossRef] Foody, G.M.; Atkinson, P.M. Uncertainty in Remote Sensing and GIS; John Wiley & Sons, Ltd.: Chichester, UK, 2002. De Badts, E.P.J. Global Land Cover 2000: Evaluation of the Spot Vegetation Sensor for Land Use Mapping; Wageningen, Alterra, Green World Research: Wagenigen, The Netherlands, 2002; p. 49. Olofsson, P.; Stehman, S.V.; Woodcock, C.E.; Sulla-Menashe, D.; Sibley, A.M.; Newell, J.D.; Friedl, M.A.; Herold, M. A global land-cover validation data set, part I: fundamental design principles. Int. J. Remote Sens. 2012, 33, 5768–5788. [CrossRef] Mayaux, P.; Eva, H.; Gallego, J.; Strahler, A.H.; Herold, M.; Agrawal, S.; Naumov, S.; De Miranda, E.E.; Di Bella, C.M.; Ordoyne, C.; et al. Validation of the global land cover 2000 map. IEEE Trans. Geosci. Remote Sens. 2006, 44, 1728–1739. [CrossRef] Eva, H.D.; Belward, A.S.; De Miranda, E.E.; Di Bella, C.M.; Gond, V.; Huber, O.; Jones, S.; Sgrenzaroli, M.; Fritz, S. A land cover map of South America. Glob. Chang. Biol. 2004, 10, 731–744. [CrossRef] Clark, M.L.; Aide, T.M.; Grau, H.R.; Riner, G. A scalable approach to mapping annual land cover at 250 m using MODIS time series data: A case study in the Dry Chaco ecoregion of South America. Remote Sens. Environ. 2010, 114, 2816–2832. [CrossRef] Vreugdenhil, D.; Meerman, J.; Meyrat, A.; Gómez, L.D.; Graham, D.J. Map of the Ecosystems of Central America; World Bank: Washington, DC, USA, 2002. Galeas, R., Guevara, J. (Eds.) Metodología para la representación cartográfica de los ecosistemas del Ecuador Continental. sistema de clasificación de ecosistemas del Ecuador Continental. In Proyecto Mapa de Vegetación del Ecuador; Dirección Nacional Forestal, Subsecretaría de Patrimonio Natural, Ministerio de Ambiente del Ecuador: Quito, Ecuador, 2012; p. 136. Chacón-Moreno, E.J. Mapping savanna ecosystems of the Llanos del Orinoco using multitemporal NOAA satellite imagery. Int. J. Appl. Earth Observ. Geoinform. 2004, 5, 41–53. [CrossRef] Etter, A. Mapa general de ecosistemas de Colombia. In Informe Nacional Sobre El Estado de La Biodiversidad—Colombia; Chaves, M.E., Arango, N., Eds.; Instituto de Investigación de Recursos Biológicos Alexander von Humboldt, PNUMA y Ministerio del Medio Ambiente: Bogotá, Colombia, 1998. IDEAM, I.; IAvH, I.; Sinchi, I.I. Ecosistemas Continentales, Costeros y Marinos de Colombia; Instituto de Hidrología, Meteorología y Estudios Ambientales, Instituto Geográfico Agustín Codazzi, Instituto de Investigación de Recursos Biológicos Alexander von Humboldt, Instituto de Investigaciones Marinas y Costeras José Benito Vives de Andréis, Ins: Bogotá, Colombia, 2007. Rodríguez, N.A.; Morales, D.; Romero, M.M. Ecosistemas de los Andes Colombianos; Instituto de Investigaciones de Recursos Biológicos Alexander von Humboldt: Bogotá, Colombia, 2004. Romero, R.; Milton Armenteras, P.; Dolors Galindo, G.; Gustavo Otero, J. Ecosistemas de la Cuenca del Orinoco Colombiano; Instituto de Investigaciones de Recursos Biológicos Alexander von Humboldt: Bogotá, Colombia, 2004. IDEAM; IGAC; IAVH; INVEMAR; SINCHI; IIAP. Mapa de Ecosistemas Continentales de Colombia, Escala 1:100,000; IGACIGAC: Bogotá, Colombia, 2015. Bailey, R.G. Ecosystem Geography: from Ecoregions to Sites; Springer Science & Business Media: New York, NY, USA, 2009. IDEAM. Informe de la Metodología Para la Elaboración del Mapa Nacional de Ecosistemas de Colombia, Escala 1:100,000; Primera Versión; IDEAM: Bogotá, Colombia, 2014. Rangel, J. (Ed.) Colombia, Diversidad Biótica; I. Instituto de Ciencias Naturales, Universidad Nacional de Colombia: Bogotá, Colombia, 1995. IGAC. Mapa Nacional de Suelos 1:100,000; Instituto Geográfico Agustín Codazzi: Bogotá, Colombia, 2014. IAVH. Identificación Cartográfica de los Páramos de Colombia a Escala 1:100,000 (Versión a Junio de 2012); Instituto de Investigaciones de Recursos Biológicos Alexander von Humboldt y Fondo de Adaptación: Bogotá, Colombia, 2013.
ISPRS Int. J. Geo-Inf. 2016, 5, 144
27.
28. 29. 30.
15 of 15
González, -M.R.; Isaacs, P.; García, H.Y.; Pizano, C. Memoria Técnica Para la Verificación en Campo del Mapa de Bosque Seco Tropical en Colombia. Escala 1:100,000; Instituto de Investigaciones de Recursos Biológicos Alexander von Humboldt: Bogotá, Colombia, 2014. IAVH. Humedales Interiores de Colombia; Instituto de Investigaciones de Recursos Biológicos Alexander von Humboldt y Fondo de Adaptación: Bogotá, Colombia, 2015. Rodríguez, N.; Armenteras, D.; Retana, J. Land use and land cover change in the Colombian Andes: Dynamics and future scenarios. J. Land Use Sci. 2012, 8, 154–174. [CrossRef] Sayre, R.G.; Comer, P.; Hak, J.; Josse, C.; Bow, J. A New Map of Standardized Terrestrial Ecosystems of Africa; Association of American Geographers: Washington, DC, USA, 2009. © 2016 by the authors; licensee MDPI, Basel, Switzerland. This article is an open access article distributed under the terms and conditions of the Creative Commons Attribution (CC-BY) license (http://creativecommons.org/licenses/by/4.0/).